Download to read offline


![46 www.power-eng.com
of multiple, parallel flow modules each
containing thousands of spaghetti-like,
hollow-fiber membranes.
The membranes must be regularly
backwashed every 10 to 20 minutes
or thereabouts to remove particulates.
The backwash flow path is the reverse
of the normal flow path. In this par-
ticular case, conversion of the mem-
branes from inside-out to outside-in
normal flow path greatly improved the
backwash efficiency.
Another interesting initial difficul-
ty was noted with the UF backwash
process. Typically with these systems
a small portion of the permeate is col-
lected in a separate tank at the begin-
ning of each process cycle for use in
backwash. So far, so good. But most
modern MF and UF units are now
equipped with automatic chemical-
ly-enhanced backwash (CEB) systems.
After a certain number of cycles, a
CEB backwash kicks in where first the
membranes are cleaned with a dilute
caustic/bleach solution to remove or-
ganics and microbiological organisms,
followed by rinsing and then a dilute
citric acid wash to remove iron partic-
ulates. When this UF was first com-
missioned and CEB backwashes com-
menced, the membranes developed a
layer of calcium silicate during the CEB
caustic stage. The driving force was
the higher pH generated by the caus-
tic, which in turn greatly reduced the
silicate solubility. The solution to this
problem was a switch to softened water
for the backwash supply.
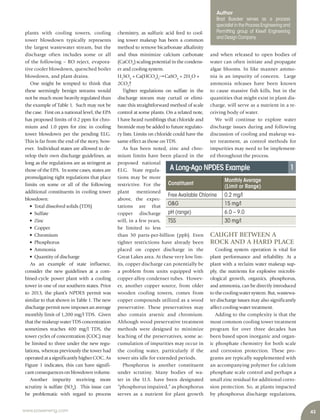
CONCLUSION
This article hopefully illustrated many
of the threads between the water treat-
ment processes at new power plants.
Complex scenarios may arise due to wa-
ter chemistry issues and discharge reg-
ulations. Processes must be viewed and
designed in a holistic manner and not
piecemeal. Accurate and historical water
quality data is an absolute must for de-
signing reliable systems.
feed and a degasifier to lower bi-
carbonate alkalinity.
Under proper conditions, the RO
recovery rate may reach 90 percent.
The RO permeate recycles to the plant
high-purity makeup water system or oth-
er locations. However, while the process
appears straightforward, a number of
lessons-learned have emerged regarding
this technology in actual application.
The following lessons are taken from a
HERO system operating at a power plant
near the Pacific Northwest. One of the
most notable examples for any of these
systems is that some standard water
treatment chemicals may foul the UF
membranes. Operating experience indi-
cates that the membrane manufacturer
and type greatly influence this phenom-
enon. Fouling is induced because mem-
branes typically carry a negative surface
charge while often cationic polymers
are employed for coagulation or floc-
culation. Residual cationic polymer is
strongly attracted to the membranes. A
very similar phenomenon has been ob-
served with MF or UF systems installed
in makeup water systems downstream of
a clarifier. Inexperienced designers and/
or plant personnel have not always rec-
ognized that MF or UF should generally
serve as a replacement for clarification,
not a polishing process for the clarifier.
A straightforward solution that has
significantly improved the reliability of
this particular system is conversion of
the ultrafilter from an inside-out nor-
mal flow path to outside-in. Typical
micro- and ultrafilter systems consist
helps to overcome the boiling point rise
that occurs in conventional units as the
dissolved solids concentration increases.
Considerable energy savings appear pos-
sible with the vacuum systems.
Becoming popular are treatment meth-
ods to reduce the volume of the plant
waste stream before final treatment. Most
notable is high-recovery reverse osmosis.
This schematic outlines the HERO pro-
cess, which is licensed by such firms as
Aquatech, GE, and U.S. Water, while Veo-
lia supplies their Opus technology, which
may also include high-rate softening/clar-
ification as a unit operation. Keys to the
process are:
• Microfiltration (MF) or ultrafiltra-
tion (UF) to remove suspended sol-
ids in the waste stream. This is a
critical process to prevent suspended
solids from fouling reverse osmosis
(RO) membranes.
• Sodium bisulfite (NaHSO3) feed
to remove residual oxidizing bio-
cides. This is also critical to remove
oxidizers that would degrade soft-
ener resin and RO membranes.
• A sodium softener to remove cal-
cium and magnesium. Otherwise
the downstream equipment would
suffer from calcium carbonate and
magnesium silicate scaling.
• Sodium hydroxide injection to ele-
vate the pH above 10. (The combi-
nation of hardness removal and pH
elevation keeps silica in solution.)
• Two-pass reverse osmosis (RO)
treatment.
• Some systems may include acid
Source:
Pollutant Maximum for any 1 day
Average of daily
values for 30 consecutive
days shall not exceed
Arsenic,total (µg/L) 8 6
Mercury,total (ng/L) 242 119
Selenium,total (µg/L) 16 10
Nitrite/nitrate (mg/L) 0.17 0.13
Proposed ELG for FGD Wastewater
Best Technology Available [1] 2](https://image.slidesharecdn.com/201508powereng-160314132843/85/2015-08-Power-Engineering-49-320.jpg)


The document discusses recent positive developments for renewable energy in June, including major financial commitments from investors, foundations, and governments. Bill Gates and Softbank committed billions more for clean technology investments. A growing number of large investment firms plan to invest in solar projects due to confidence in returns and a desire to support clean energy. China committed to reduce emissions and increase non-fossil fuel energy use, joining new commitments from other nations ahead of climate talks. Rapidly improving economics and technology are driving momentum for renewables as costs drop and targets increase around the world.