This document defines the indicator "Percentage of adults and children known to be alive and on treatment 12 months after initiation of antiretroviral therapy". It provides detailed explanations of the numerator, which is the number of individuals alive and on ART at 12 months, and the denominator, which is the total number who initiated ART 12 months prior. Retention in care is a key measure of program success. The indicator is calculated using cohort analysis to assess retention over time and identify areas for improvement.
Medical Records: Intro, importance, characteristics & issuesSrishti Bhardwaj
Unit 1 of MHA SEM- III's syllabus of Medical records Management
(Bharati Vidyapeeth- Center for Health Management Studies & Research, Pune)
Self made- study purpose- reference presentation
avoid hyperlinks on certain slides- inactive
sources shared on last slide as REFERENCES
Hope it helps :)
Medical Record Audit in Clinical Nursing Units in Tertiary Hospitaliosrjce
IOSR Journal of Nursing and health Science is ambitious to disseminate information and experience in education, practice and investigation between medicine, nursing and all the sciences involved in health care. Nursing & Health Sciences focuses on the international exchange of knowledge in nursing and health sciences. The journal publishes peer-reviewed papers on original research, education and clinical practice.
By encouraging scholars from around the world to share their knowledge and expertise, the journal aims to provide the reader with a deeper understanding of the lived experience of nursing and health sciences and the opportunity to enrich their own area of practice. The journal publishes original papers, reviews, special and general articles, case management etc.
Medico Legal implication of medical records-IndiaSrishti Bhardwaj
Medico legal liabilities related to patient records,
Medical Record committee and role of committee Hospital Utilization
Bed turnover ratio,
Average length of stay,
Death rate,
Bed occupancy rate
Unit 4- BVUCHMSR Portion (Sem-3)
Standard Operating Procedure and Conduct Guidelines Anaemia Control Project, ...Anand Ahankari
The attached draft is the Standard Operating Procedures of Anaemia Control Project (ACP) implemented in central India in collaboration with Halo Medical Foundation (HMF), India and the University of Nottingham, UK. The document is made available in public domain to promote knowledge sharing and also to enable authors to cite for the manuscripts generated from ACP project. If you use the whole document or in parts, then it needs to be cited appropriately. The document is subjected to CC copyrights (CC) authors.
Measuring & Monitoring Clinical Quality Measures Using Practice FusionPractice Fusion
Review CMS quality measures, how to capture the data in Practice Fusion, and how this data can be used to earn incentive payments through quality reporting programs, including Meaningful Use and PQRS.
Change Implementation Plan for Combating Hospital-Acqu.docxsleeperharwell
Change Implementation Plan for Combating Hospital-Acquired Infections
Hospital-acquired infections, (HAIs) or nosocomial infections or health-care associated infections, are those infections that are contracted because of toxins or infections that exist in hospitals. Since one in ten people who are admitted in hospitals will contract as HAI, it is imperative that these institutions put in place various strategies that ensure that the cases of such infections happening are reduced, especially in the face of potential growth in the numbers of patients with HAIs as medical care becomes more complex and antibiotic resistance increases (Monegro, & Regunath, 2017). Hospital organizations, then, need to apportion adequate resources even as they identify and secure buy in from various stakeholders so that they can implement changes necessary for there to be reduced cases of hospital-acquired infections.
One of the critical stakeholders in implementing the plan to reduce the risk of HAIs in the hospital is the hospital personnel. Physicians, surgeons, nurses, and technical and janitorial staff in hospitals would need to be engaged so that they were aware of the need to maintain both hand hygiene and environmental hygiene. By emphasizing the need for cleaning when going in to handle patients and cleaning when coming from this task, as well as wearing sterile garments whenever required, these hospital personnel can prevent the spread of infections in a large way. And since there are certain types of microbial bacteria that can survive on environmental surfaces for months at a time, it is quite imperative to have hospital personnel remain aware of the need to maintain environmental hygiene. In doing so, infections that may be transmitted by having patients or hospital personnel touch surfaces with their skin only for these surfaces to be touched by others can be controlled (Mehta et al., 2014).
Hospital trustees and administrative staff must also be interested in implementing the plan to reduce HAIs. With their buy in, these stakeholders can be effective in ensuring an organizational culture of cleanliness and hygiene is not only instituted but also allowed to thrive so that no department lags behind in the support of an infection prevention program. Senior staff in the hospital can play a critical role in coordinating care, especially since some of the measures taken in the prevention of HAIs extend well beyond hand and environmental hygiene. Patients with certain infections may be required to be quarantined or grouped together so that they do not infect others. But when there is a breakdown of communication, departments may end up assuming that certain infection prevention or surgical preparation activities have been executed by other departments. When such activities are not timed or accountability is not assigned to specific departments, it is the result of a failure in coordination of care and communication, which can often be attributed to.
The Role of Real-World Data in Clinical DevelopmentCovance
Healthcare is experiencing an avalanche of electronic data with sources that include social media, smart phones, activity trackers, electronic health records (EHRs), insurance claim databases, patient registries, health surveys, and more. **Disclaimer: This article was previously published. Sciformix is now a Covance company.
Steps for Effective Patient and Staff Contact Tracing to Defend Against COVID...Health Catalyst
While the world waits for a vaccine or effective treatment for COVID-19, managing disease spread is paramount. For health systems, patient and staff contact tracing is one of the top transmission-control strategies. Because the virus appears to spread mainly through respiratory droplets from person-to-person contact, knowing where infected individuals have been and with whom they’ve been in contact is an essential capability. With this insight, organizations can manage transmission with data-driven emergency planning and monitoring capabilities. The resulting appropriate and timely workflow modifications will serve disease control efforts during the 2020 pandemic and help health systems prepare for future outbreaks.
The Entity chosen was Baptist Healthcare South Florida for years 201.docxtodd701
The Entity chosen was Baptist Healthcare South Florida for years 2017,2018,2019 the stats are online
The course project will require students to select a
healthcare
organization and review its financial operations based on data available from various sources. The entity may be a individual hospital, medical group practice, managed care organization, or government agency delivering healthcare services. Once the group has selected a healthcare entity, it will obtain three years of financial statements to analyze along with appropriate literature reviews about the entity or similar entities. The final paper will be submitted in a case study format, which includes the following sections:
Background
Issues/problems identified
Analysis utilizing ratios and other financial analysis tools
Recommendations
Implementation plan
Monitoring methodology
References demonstrating graduate-level research (only references of the highest quality grade will be accepted)
The page count for this assignment is at least seven (7) pages plus references and title pages. Your paper needs to be submitted in APA 6th format and must have a minimum of 10 current resources four (4) of them from current peer-reviewed articles. The final group assignment paper is submitted Canvas with each team member sharing equally in the development of the group project.
Rubric
Written Grading Rubric (AW) (1) (1)
Written Grading Rubric (AW) (1) (1)CriteriaRatingsPtsThis criterion is linked to a Learning OutcomeIntroduction25.0 pts
This criterion is linked to a Learning OutcomeAccuracy25.0 pts
This criterion is linked to a Learning OutcomeRelevance25.0 pts
This criterion is linked to a Learning OutcomeReference List25.0 pts
This criterion is linked to a Learning OutcomeIn Text Citations and Paraphrasing25.0 pts
This criterion is linked to a Learning OutcomeCritical Thinking25.0 pts
This criterion is linked to a Learning OutcomeCreative Thinking25.0 pts
This criterion is linked to a Learning OutcomeOrganization25.0 pts
Total Points: 200.0
Previous
So far this is whats done but I am only responsible for the Monitoring Methdology Part
Baptist Health South Florida Financial Operations Case Study
Background
Baptist Health South Florida is the biggest healthcare organization in the region, with 11 hospitals, approximately 23,000 employees, more than 4,000 physicians and more than 100 outpatient centers, such as urgent care facilities and physician practices across Miami-Dade, Monroe, Broward and Palm Beach counties. Baptist Health was founded in 1960 and it is well known for having centers in different areas of health care such as cancer, cardiovascular care, orthopedics, sports medicine and neurosciences, which attracts patients from all over the U.S., the Caribbean, and Latin America. It is a not-for-profit organization committed to their faith-based generous mission of medical excellence. Also, Baptist Health has been recognized by Fortune as one of the 100 be.
Hiv Prevention Nevada #ENDHIV #AIDSFREE#GOMOJO, INC.
Quality Management
The Nevada Ryan White Part B Program is committed to improving the quality of care and services for persons living with HIV and AIDS through continuous quality monitoring and improvement in a comprehensive performance measurement program.
NEVADA STATEWIDE HIV CONTINUUM OF CARE
The Nevada Statewide HIV Care Continuum and HIV Fast Facts shows all HIV/AIDS positive persons in the State of Nevada. This data includes persons who are engaged in care either in private clinics or a Ryan White Program, as well as, persons who are not engaged in care or not connected to a Ryan White Program.
Nevada Statewide HIV Continuum of Care 2017
Nevada Statewide HIV Continuum of Care 2016
2017 HIV Fast Facts
NEVADA RYAN WHITE PART B HIV CONTINUUM OF CARE
The Nevada Ryan White Part B Program HIV Care Cascade shows HIV/AIDS positive persons who have engaged in care and received at lease one service from the Nevada Ryan White Part B Program during the reported year.
HIV Care Cascade Calendar Year 2017
HIV Prevention Data Calendar Year 2017
NEVADA RYAN WHITE PART B QUALITY MANAGEMENT
The mission of the Nevada Ryan White Part B Program Quality Management Program is to improve access and ensure the highest quality medical care and supportive services through continuous evaluation, strategic planning and assessment, and the implementation of quality management and quality improvement projects.
Quality Management Plan 2018-2019
Quality Plan Performance Review 2018 Mid-Year Report
Calendar Year 2018 Reports
Viral Suppression by Disparities CY 2018- Age
Viral Suppression by Disparities CY 2018- Gender
Viral Suppression by Disparities CY 2018- HIV Risk Factor
Viral Suppression by Disparities CY 2018- Housing Status
Viral Suppression by Disparities CY 2018- Race and Ethnicity
Viral Suppression by Disparities CY 2018- All Disparity Data
Viral Suppression by Disparities CY 2018- ADAP Assistance
Grant Year 2018-2019 Mid-Year Reports
Viral Suppression by Disparities 2018 Mid-Year Report
Viral Suppression by Disparities 2018 Mid-Year Report-Age
Viral Suppression by Disparities 2018 Mid-Year Report-Gender
Viral Suppression by Disparities 2018 Mid-Year Report-HIV Risk Factor
Viral Suppression by Disparities 2018 Mid-Year Report-Housing
Viral Suppression by Disparities 2018 Mid-Year Report-Race and Ethnicity
Ryan White Part B Calendar Year 2017 Statistics
If you have any questions concerning Quality Management, please contact the person(s) below:
Samantha Penn, MBA
Management Analyst I
(Quality Assurance & Evaluation Analyst)
Phone: (702) 486-8103
Email: spenn@health.nv.gov
Core practices that are moving from a pilot state to implementation at scale: Many of the
barriers facing HIV programs are common across countries. PEPFAR’s ECTs (described below in
Sections 2.3.2 and 2.3.3) identified common issues affecting countries at various levels of
epidemic control and then developed a compendium of evidence-based solutions, approaches
and case-studies that highlight successful means of addressing common barriers. Additional
evidence-based approaches and case-studies will be incorporated into this living compendium
over time. As highlighted in this PEPFAR Solutions Platform, these practices can be rapidly
adapted and scaled to move countries forward.
Key considerations for all PEPFAR programs include:
• Bringing Interventions to Scale with Fidelity: Getting to HIV epidemic control is dependent on
several factors; not the least of which is the ability to rapidly scale successful interventions with
fidelity and demonstrated impact. However, the logistics of cost- effective programmatic scale
have proven challenging, with several implementation barriers. Implementation science
defines scalability as the capacity to expand or extend an intervention to account for a growth
factor that aims to fill a gap or address unmet need in a defined population group/geographic
area.
• Data and Information Technology: The enabling environment for data and information
technology is rapidly maturing across countries, creating space, opportunity, and needed
political will to harness the Data Revolution for epidemic control. OUs should consider
innovative ways to use data and information technology to improve efficiency and
sustainability in achieving epidemic control, beyond immediate PEPFAR indicator data
collection needs. As highlighted in the Data Revolution Innovation Toolkit, available on the
PEPFAR SharePoint, OUs are encouraged to explore, adapt, and scale these and other data
driven approaches to move country epidemic control forward.
Nevada profile 2015 stda re'port for cdc#GOMOJO, INC.
Core practices that are moving from a pilot state to implementation at scale: Many of the
barriers facing HIV programs are common across countries. PEPFAR’s ECTs (described below in
Sections 2.3.2 and 2.3.3) identified common issues affecting countries at various levels of
epidemic control and then developed a compendium of evidence-based solutions, approaches
and case-studies that highlight successful means of addressing common barriers. Additional
evidence-based approaches and case-studies will be incorporated into this living compendium
over time. As highlighted in this PEPFAR Solutions Platform, these practices can be rapidly
adapted and scaled to move countries forward.
Key considerations for all PEPFAR programs include:
• Bringing Interventions to Scale with Fidelity: Getting to HIV epidemic control is dependent on
several factors; not the least of which is the ability to rapidly scale successful interventions with
fidelity and demonstrated impact. However, the logistics of cost- effective programmatic scale
have proven challenging, with several implementation barriers. Implementation science
defines scalability as the capacity to expand or extend an intervention to account for a growth
factor that aims to fill a gap or address unmet need in a defined population group/geographic
area.
• Data and Information Technology: The enabling environment for data and information
technology is rapidly maturing across countries, creating space, opportunity, and needed
political will to harness the Data Revolution for epidemic control. OUs should consider
innovative ways to use data and information technology to improve efficiency and
sustainability in achieving epidemic control, beyond immediate PEPFAR indicator data
collection needs. As highlighted in the Data Revolution Innovation Toolkit, available on the
PEPFAR SharePoint, OUs are encouraged to explore, adapt, and scale these and other data
driven approaches to move country epidemic control forward.
Nevada state health division screen shot of site #GOMOJO, INC.
Nevada Prevention and Care Programs
Core practices that are moving from a pilot state to implementation at scale: Many of the
barriers facing HIV programs are common across countries. PEPFAR’s ECTs (described below in
Sections 2.3.2 and 2.3.3) identified common issues affecting countries at various levels of
epidemic control and then developed a compendium of evidence-based solutions, approaches
and case-studies that highlight successful means of addressing common barriers. Additional
evidence-based approaches and case-studies will be incorporated into this living compendium
over time. As highlighted in this PEPFAR Solutions Platform, these practices can be rapidly
adapted and scaled to move countries forward.
Key considerations for all PEPFAR programs include:
• Bringing Interventions to Scale with Fidelity: Getting to HIV epidemic control is dependent on
several factors; not the least of which is the ability to rapidly scale successful interventions with
fidelity and demonstrated impact. However, the logistics of cost- effective programmatic scale
have proven challenging, with several implementation barriers. Implementation science
defines scalability as the capacity to expand or extend an intervention to account for a growth
factor that aims to fill a gap or address unmet need in a defined population group/geographic
area.
• Data and Information Technology: The enabling environment for data and information
technology is rapidly maturing across countries, creating space, opportunity, and needed
political will to harness the Data Revolution for epidemic control. OUs should consider
innovative ways to use data and information technology to improve efficiency and
sustainability in achieving epidemic control, beyond immediate PEPFAR indicator data
collection needs. As highlighted in the Data Revolution Innovation Toolkit, available on the
PEPFAR SharePoint, OUs are encouraged to explore, adapt, and scale these and other data
driven approaches to move country epidemic control forward.
America cares hiv-aids in black america#GOMOJO, INC.
Increase community awareness of HIV/AIDS and HIV prevention strategies.
Increase community understanding of the clinical research process.
Develop and strengthen relationships with community stakeholders, including (but not limited to) medical care providers, STD/HIV counseling and testing providers, faith leaders, Non Governmental Organizations and Community Based Organizations.
Increasingly, African Americans in general are recognizing that HIV is wreaking devastation across our communities. Those who have joined the fight against HIV and AIDS in Black communities are coming to understand that it is a difficult and multifaceted problem—but that it is also a winnable war. With this report, we aim to arm those people with the information they need to get there.
Downtown las vegas community culture and values#GOMOJO, INC.
Downtown Las Vegas is a growing community with a focus on becoming the greatest city in the world to live, learn, work and play. My intuition said we need to have one solid list of core values for us all to remember we are one team.
ARTIFICIAL INTELLIGENCE IN HEALTHCARE.pdfAnujkumaranit
Artificial intelligence (AI) refers to the simulation of human intelligence processes by machines, especially computer systems. It encompasses tasks such as learning, reasoning, problem-solving, perception, and language understanding. AI technologies are revolutionizing various fields, from healthcare to finance, by enabling machines to perform tasks that typically require human intelligence.
Lung Cancer: Artificial Intelligence, Synergetics, Complex System Analysis, S...Oleg Kshivets
RESULTS: Overall life span (LS) was 2252.1±1742.5 days and cumulative 5-year survival (5YS) reached 73.2%, 10 years – 64.8%, 20 years – 42.5%. 513 LCP lived more than 5 years (LS=3124.6±1525.6 days), 148 LCP – more than 10 years (LS=5054.4±1504.1 days).199 LCP died because of LC (LS=562.7±374.5 days). 5YS of LCP after bi/lobectomies was significantly superior in comparison with LCP after pneumonectomies (78.1% vs.63.7%, P=0.00001 by log-rank test). AT significantly improved 5YS (66.3% vs. 34.8%) (P=0.00000 by log-rank test) only for LCP with N1-2. Cox modeling displayed that 5YS of LCP significantly depended on: phase transition (PT) early-invasive LC in terms of synergetics, PT N0—N12, cell ratio factors (ratio between cancer cells- CC and blood cells subpopulations), G1-3, histology, glucose, AT, blood cell circuit, prothrombin index, heparin tolerance, recalcification time (P=0.000-0.038). Neural networks, genetic algorithm selection and bootstrap simulation revealed relationships between 5YS and PT early-invasive LC (rank=1), PT N0—N12 (rank=2), thrombocytes/CC (3), erythrocytes/CC (4), eosinophils/CC (5), healthy cells/CC (6), lymphocytes/CC (7), segmented neutrophils/CC (8), stick neutrophils/CC (9), monocytes/CC (10); leucocytes/CC (11). Correct prediction of 5YS was 100% by neural networks computing (area under ROC curve=1.0; error=0.0).
CONCLUSIONS: 5YS of LCP after radical procedures significantly depended on: 1) PT early-invasive cancer; 2) PT N0--N12; 3) cell ratio factors; 4) blood cell circuit; 5) biochemical factors; 6) hemostasis system; 7) AT; 8) LC characteristics; 9) LC cell dynamics; 10) surgery type: lobectomy/pneumonectomy; 11) anthropometric data. Optimal diagnosis and treatment strategies for LC are: 1) screening and early detection of LC; 2) availability of experienced thoracic surgeons because of complexity of radical procedures; 3) aggressive en block surgery and adequate lymph node dissection for completeness; 4) precise prediction; 5) adjuvant chemoimmunoradiotherapy for LCP with unfavorable prognosis.
Couples presenting to the infertility clinic- Do they really have infertility...Sujoy Dasgupta
Dr Sujoy Dasgupta presented the study on "Couples presenting to the infertility clinic- Do they really have infertility? – The unexplored stories of non-consummation" in the 13th Congress of the Asia Pacific Initiative on Reproduction (ASPIRE 2024) at Manila on 24 May, 2024.
These simplified slides by Dr. Sidra Arshad present an overview of the non-respiratory functions of the respiratory tract.
Learning objectives:
1. Enlist the non-respiratory functions of the respiratory tract
2. Briefly explain how these functions are carried out
3. Discuss the significance of dead space
4. Differentiate between minute ventilation and alveolar ventilation
5. Describe the cough and sneeze reflexes
Study Resources:
1. Chapter 39, Guyton and Hall Textbook of Medical Physiology, 14th edition
2. Chapter 34, Ganong’s Review of Medical Physiology, 26th edition
3. Chapter 17, Human Physiology by Lauralee Sherwood, 9th edition
4. Non-respiratory functions of the lungs https://academic.oup.com/bjaed/article/13/3/98/278874
Ozempic: Preoperative Management of Patients on GLP-1 Receptor Agonists Saeid Safari
Preoperative Management of Patients on GLP-1 Receptor Agonists like Ozempic and Semiglutide
ASA GUIDELINE
NYSORA Guideline
2 Case Reports of Gastric Ultrasound
Ethanol (CH3CH2OH), or beverage alcohol, is a two-carbon alcohol
that is rapidly distributed in the body and brain. Ethanol alters many
neurochemical systems and has rewarding and addictive properties. It
is the oldest recreational drug and likely contributes to more morbidity,
mortality, and public health costs than all illicit drugs combined. The
5th edition of the Diagnostic and Statistical Manual of Mental Disorders
(DSM-5) integrates alcohol abuse and alcohol dependence into a single
disorder called alcohol use disorder (AUD), with mild, moderate,
and severe subclassifications (American Psychiatric Association, 2013).
In the DSM-5, all types of substance abuse and dependence have been
combined into a single substance use disorder (SUD) on a continuum
from mild to severe. A diagnosis of AUD requires that at least two of
the 11 DSM-5 behaviors be present within a 12-month period (mild
AUD: 2–3 criteria; moderate AUD: 4–5 criteria; severe AUD: 6–11 criteria).
The four main behavioral effects of AUD are impaired control over
drinking, negative social consequences, risky use, and altered physiological
effects (tolerance, withdrawal). This chapter presents an overview
of the prevalence and harmful consequences of AUD in the U.S.,
the systemic nature of the disease, neurocircuitry and stages of AUD,
comorbidities, fetal alcohol spectrum disorders, genetic risk factors, and
pharmacotherapies for AUD.
New Drug Discovery and Development .....NEHA GUPTA
The "New Drug Discovery and Development" process involves the identification, design, testing, and manufacturing of novel pharmaceutical compounds with the aim of introducing new and improved treatments for various medical conditions. This comprehensive endeavor encompasses various stages, including target identification, preclinical studies, clinical trials, regulatory approval, and post-market surveillance. It involves multidisciplinary collaboration among scientists, researchers, clinicians, regulatory experts, and pharmaceutical companies to bring innovative therapies to market and address unmet medical needs.
Triangles of Neck and Clinical Correlation by Dr. RIG.pptx
2015 indicator reference guide retained on art at 12 months
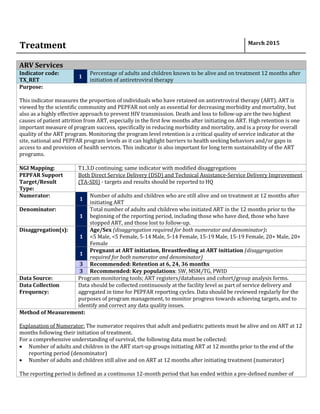
1. Treatment March 2015
ARV Services
Indicator code:
TX_RET
1
Percentage of adults and children known to be alive and on treatment 12 months after
initiation of antiretroviral therapy
Purpose:
This indicator measures the proportion of individuals who have retained on antiretroviral therapy (ART). ART is
viewed by the scientific community and PEPFAR not only as essential for decreasing morbidity and mortality, but
also as a highly effective approach to prevent HIV transmission. Death and loss to follow-up are the two highest
causes of patient attrition from ART, especially in the first few months after initiating on ART. High retention is one
important measure of program success, specifically in reducing morbidity and mortality, and is a proxy for overall
quality of the ART program. Monitoring the program level retention is a critical quality of service indicator at the
site, national and PEPFAR program levels as it can highlight barriers to health seeking behaviors and/or gaps in
access to and provision of health services. This indicator is also important for long term sustainability of the ART
programs.
NGI Mapping: T1.3.D continuing; same indicator with modified disaggregations
PEPFAR Support
Target/Result
Type:
Both Direct Service Delivery (DSD) and Technical Assistance-Service Delivery Improvement
(TA-SDI) - targets and results should be reported to HQ
Numerator:
1
Number of adults and children who are still alive and on treatment at 12 months after
initiating ART
Denominator:
1
Total number of adults and children who initiated ART in the 12 months prior to the
beginning of the reporting period, including those who have died, those who have
stopped ART, and those lost to follow-up.
Disaggregation(s):
1
Age/Sex (disaggregation required for both numerator and denominator):
<5 Male, <5 Female, 5-14 Male, 5-14 Female, 15-19 Male, 15-19 Female, 20+ Male, 20+
Female
1
Pregnant at ART initiation, Breastfeeding at ART initiation (disaggregation
required for both numerator and denominator)
3 Recommended: Retention at 6, 24, 36 months
3 Recommended: Key populations: SW, MSM/TG, PWID
Data Source: Program monitoring tools; ART registers/databases and cohort/group analysis forms.
Data Collection
Frequency:
Data should be collected continuously at the facility level as part of service delivery and
aggregated in time for PEPFAR reporting cycles. Data should be reviewed regularly for the
purposes of program management, to monitor progress towards achieving targets, and to
identify and correct any data quality issues.
Method of Measurement:
Explanation of Numerator: The numerator requires that adult and pediatric patients must be alive and on ART at 12
months following their initiation of treatment.
For a comprehensive understanding of survival, the following data must be collected:
Number of adults and children in the ART start-up groups initiating ART at 12 months prior to the end of the
reporting period (denominator)
Number of adults and children still alive and on ART at 12 months after initiating treatment (numerator)
The reporting period is defined as a continuous 12-month period that has ended within a pre-defined number of
2. months from the submission of the report. The pre-defined number of months can be determined by PEPFAR or
national reporting requirements. If the PEPFAR reporting period is 1 October 2014 to 30 September 2015,
countries will calculate this indicator by using all patients who started ART any time during the 12-month period
from 1 October 2013 to 30 September 2014. A 12-month outcome is defined as the outcome, i.e., whether the
patient is still alive and on ART, dead or lost to follow-up, 12 months after starting. For example, patients who
started ART during August 2014 will have reached their 12-month outcomes in August 2015 (e.g., August 4th 2014-
August 3rd 2015). Patients who started ART during January 2014 will have reached their 12-month outcomes in
January 2015.
The numerator does not require patients to have been on ART continuously for the 12-month period. Patients may
be included in the numerator (and denominator) if they have missed an appointment or drug pick-up or
temporarily stopped treatment during the 12 months since initiating treatment, as long as they are recorded as still
being on treatment at month 12.
For example, a patient who started ART in September 2014 would be considered “alive and on ART at 12 months”
(in September 2015) if:
The patient visited the facility and received ARVs in September 2015; OR
The patient had enough ARVs to last through the end of September 2015 (month 12) based on the last drug
pick-up (e.g., patient received 60 days of drug on August 15th, or patient received 30 days of drug on September
1st, etc.).
However, the patient would NOT be considered “alive and on ART at 12 months” if:
The patient did NOT have enough ARVs to last through the end of September 2015 (e.g., patient received 30
days of drug on August 1st); AND
The patient was dead, transferred out, stopped, or lost to follow-up at the end of September 2015.
At the facility level, patients who have transferred in with a known treatment initiation date that falls within the
reporting period should be counted. Conversely, patients who transferred out of the facility should not be counted
in that facility’s cohort. See “Explanation of Net Current Cohort” in the “Interpretation” section below for further
details.
For those patients who started ART in September 2014, if at any point during the period September 2014 to
September 2015 these patients die, are lost to follow-up (and do not return), or stop treatment (and do not restart),
then at month 12 (September 2015), they are NOT on ART, and NOT included in the retention numerator.
Conversely, a patient who started ART in September 2014 and who missed an appointment in December 2014, but
is recorded as on ART in September 2015 (at month 12) is on ART and will be included in the numerator. The
number of adults and children on ART at 12 months includes patients who have transferred in (and their initiation
date is known) at any point from initiation of treatment to the end of the 12-month period and excludes patients
who have transferred out during this same period to reflect the net current cohort at each facility. What is
important is that the patient who has started ART in September in 2014 is recorded as being alive and on ART 12
months after initiation, regardless of what happens after that initiation date within the reporting period of interest
(i.e., for this example, 1 October 2014 to 30 September 2015).
Explanation of Denominator: The denominator is the total number of adults and children in the (monthly) ART
start-up groups who initiated ART at a point 12 months prior to the beginning of the reporting period, regardless of
their 12-month outcome. (i.e., died, LTFU, stopped); this includes those “New” on ART as well as those who
“Transferred In” if they have a cohort-start date within the reporting period of interest. At the facility level, the
Transfers Out (TO) will be taken out of the denominator as well as the numerator. It is assumed that if a patient
3. transfers out from an ART facility, that patient will be a “transfer in” at a new ART facility. Logically, facilities and
programs may visualize this calculation of the denominator as the facility or program is no longer responsible for
an ART patient who has officially transferred out to another ART facility.
For example, for the reporting period October 1, 2014 to September 30, 2015, this will include all patients who
started ART during the 12-month period from October 1, 2013 to September 30, 2014. This includes all patients,
both those on ART as well as those who are dead, have stopped treatment or are lost to follow-up at month 12.
Again the denominator includes patients that have transferred in (and their initiation date is known) and excludes
patients that transferred out during the time period.
This indicator should NOT be estimated. This indicator should be calculated directly from information gathered in
standard cohort ART registers or tabular analysis from electronic patient level databases.
Country teams should ensure that all sites are reporting on the same 12 ART start-up groups. Only sites that have
been operational for at least 24 months prior to the end of the reporting period should report, so that all sites
report on the same 12 ART start-up groups. PEPFAR country teams may use the USG FY reporting period as the
timeframe for the 12 ART start-up groups. Teams may also wish to ‘lag’ by 1-3 months the cohort-months
comprising the annual cohort, in order to allow sufficient time for reporting from data sources (i.e., implementing
partners and/or national systems).
Country teams should record how many ART sites are reporting on this indicator and seek to ensure reporting
among all eligible ART sites (i.e., operational for 24 months) by the end of FY 2015.
Sites are encouraged to disaggregate retention by health status at initiation (e.g., CD4 count or WHO stage), to
review the retention of every ART start up group on a continuous basis, to summarize the data at regular intervals
(e.g., monthly), and to use this information to improve follow-up and retention of patients.
Explanation of Numerator:
The numerator requires that adult and pediatric patients must be alive and on ART at 12 months after their
initiation of treatment.
Explanation of Denominator:
The denominator is the total number of adults and children in the (monthly) ART start-up groups who initiated
ART at a point 12 months prior to the beginning of the reporting period, regardless of their 12-month outcome. (i.e.,
died, LTFU, stopped); this includes those “New” on ART as well as those who “Transferred In” if they have a cohort-
start date within the reporting period of interest.
Interpretation:
At the national level, the number of transferred-in patients should match the number of transferred-out patients.
Therefore, the net current cohort (the patients whose outcomes the facility is currently responsible for recording—
the number of patients in the start-up group plus any transfers in, minus any transfers out) at 12 months should
equal the number in the start-up cohort group 12 months prior.
Using this denominator may underestimate true “survival”, since a proportion of those lost to follow-up are alive.
The number of people alive and on ART (i.e., people retained on ART) in a treatment cohort is captured here. WHO
recommends a target of at least 75% of adults and children alive and on ART at 6 months of follow-up.
Priority reporting is for aggregate survival reporting. If comprehensive cohort patient registries are available then
4. it is encouraged for countries to track survival at 6, 24, and 36 months. If at 6 months of therapy, the retention rate
is lower than 75%, this information along with other data gleaned can be used to identify areas of adult and
pediatric care that require strengthening and increased attention. In addition, this will enable comparison over
time of survival on ART. As it stands, it is possible to identify whether survival at 12 months increases or decreases
over time. However, it is not possible to attribute cause to these changes. For example, if survival at 12 months
increases over time, this may reflect an improvement in care and treatment practices or earlier initiation of ART.
Therefore, collection and reporting of survival over longer durations of treatment outcomes may provide a better
picture of the long-term success of ART.
PEPFAR Support:
DSD: Individuals will be counted as receiving direct service delivery support from PEPFAR when BOTH of
the below conditions are met: Provision of key staff or commodities AND frequent, at least quarterly,
support to improve the quality of services.
TA-SDI: Individuals will be counted as supported through TA-SDI when the point of service delivery
receives support from PEPFAR that meets the second criterion only: Frequent, at least quarterly support to
improve the quality of services.
1. PEPFAR is directly interacting with the patient or beneficiary in response to their health (physical,
psychological, etc.) care needs by providing key staff and/or essential commodities for routine service
delivery. For PLHIV receiving ART, this can include ongoing procurement of critical commodities, such as
ARVs, or funding for salaries of HCW who deliver HIV treatment services. Staff who are responsible for the
completeness and quality of routine patient records (paper or electronic) can be counted here; however,
staff who exclusively fulfill MOH and donor reporting requirements cannot be counted.
AND/OR
2. PEPFAR provides an established presence at and/or routinized, frequent (at least quarterly) support to
those services at the point of service delivery. For ART services, this ongoing support for service delivery
improvement can include: clinical mentoring and supportive supervision of staff at HIV sites providing ART,
support for quality improvement activities, patient tracking system support, routine support of ART M&E
and reporting, commodities consumption forecasting and supply management.
Additional References:
Three interlinked patient monitoring systems for HIV care/ART, MCH/PMTCT (including malaria prevention
during pregnancy), and TB/HIV: standardized minimum data set and illustrative tools. World Health
Organization 2012 Revision. (http://www.who.int/hiv/pub/me/patient_monitoring_systems/en/)
4.2, Global AIDS Response Progress Reporting 2013. Construction of Core Indicators for monitoring the 2011
UN Political Declaration on HIV/AIDS. January 2013.
(http://data.unaids.org/pub/Manual/2007/20070411_ungass_core_indicators_manual_en.pdf)
HIV impact indicator (HIV-I6), The Global Fund to Fight AIDS, Tuberculosis and Malaria Monitoring and
Evaluation Toolkit: HIV, Tuberculosis and Malaria and Health Systems Strengthening Part 2: HIV, Fourth
Edition, November 2011.
(http://www.theglobalfund.org/documents/monitoring_evaluation/ME_Part2HIV_Toolkit_en/)
WHO updated HIV Drug Resistance Early Warning Indicators and targets – 2012.
(http://www.who.int/hiv/pub/meetingreports/ewi_meeting_report/en/index.html).
Refer to the PEPFAR Adult Treatment TWG with further inquiries