Downloaded 116 times


![EXECUTIVE SUMMARY 5
Since retailers are increasingly dependent
on technology for real-time visibility into
operations, they are gradually moving all of their
SODWIRUPEDVHGVROXWLRQVWRWKHFORXG7KHDUH
also using integrated technologies to improve
the omni-channel network. Respondents are
investing in warehouse management systems
(58%), enterprise resource planning software
(54%), transportation management systems
(54%), supply chain visibility (43%), warehouse
management system add-ons (33%) and RFID
(21%). Respondents also said they are investing
in technologies that allow them to personalize
DQGFXVWRPL]HWKHVKRSSLQJH[SHULHQFHVXFK
as mobile apps (33%).
By obtaining and transmitting information
PRUHHIÀFLHQWODQGLQQHZZDVUHWDLOHUVDUH
able to better meet customers’ needs and offer
PRUHIXOÀOOPHQWRSWLRQVIXUWKHULPSURYLQJ
their customer service, which is a priority.
About one-third of respondents—32%—listed
customer service as the top reason they are
LQYHVWLQJLQRPQLFKDQQHOIXOÀOOPHQW
FLWHGVHUYLFHOHYHOVOLVWHGIUHLJKWFRVWV
Strategic Workforce Management
Throughout the Supply Chain
Strategic workforce management will be
particularly important for the 3PL industry
DVLWLVH[SHFWHGWRIDFHDVKRUWDJHRIWDOHQW
Nearly 50% of respondents said they are already
KDYLQJGLIÀFXOWLQÀQGLQJRUDWWUDFWLQJWDOHQW
and the average hiring growth rate within the
VXSSOFKDLQLQGXVWULVH[SHFWHGWREHKLJKHU
than the average growth rate across other
occupations. Estimates show that 60 million
SHRSOHZLOOH[LWWKHLQGXVWUEEXWWKHUH
DUHRQOPLOOLRQSHRSOHWRÀOOWKHJDS
([LVWLQJSRVLWLRQVZLWKLQWKHVXSSOFKDLQ
industry are changing rapidly. By 2015,
three out of four jobs within the industry are
H[SHFWHGWRFKDQJH)XUWKHUPRUHWKHGQDPLFV
of supply chain professionals are changing.
In the future, only having hard skills in
RSHUDWLRQVPDQDJHPHQWZLOOQRWEHVXIÀFLHQW
,QVWHDGWKHUHZLOOEHDPL[RIERWKVRIWDQG
hard skills involving leadership qualities and
cross-functional competencies that will shape
the industry.
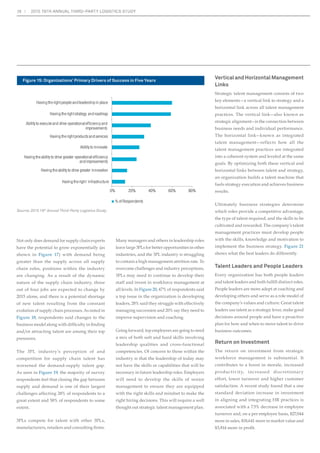
Logistics providers face competition for
employees. Not only do they compete with other
3PLs, they also compete with manufacturers,
UHWDLOHUVDQGFRQVXOWLQJÀUPV0DQPDQDJHUV
in leadership roles leave large 3PLs for better
opportunities in other industries.
Without strategic workforce planning,
FRPSDQLHVPDVWUXJJOHWRJURZ7KHUHWXUQ
on investment from strategic workforce
management is substantial, contributing to
a boost in morale, increased productivity,
increased discretionary effort, lower turnover
and higher customer satisfaction.
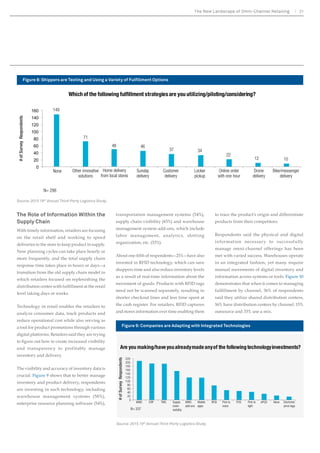
One study found that a one standard
deviation increase in investment in aligning
and integrating human resources practices is
associated with a 7.5% decrease in employee
turnover and, on a per employee basis, $27,044
more in sales, $18,641 more in market value and
PRUHLQSURÀW](https://image.slidesharecdn.com/20153plstudy-141112151357-conversion-gate01/85/2015-Third-Party-Logistics-Study-5-320.jpg)
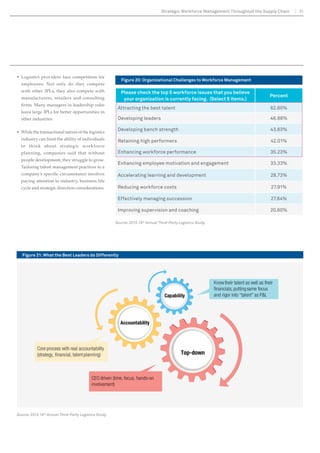
![DQG PRELOHFORXG WHFKQRORJLHV FDQ
significantly enhance and streamline the
SURGXFWLYHDFWLYLWLHVRI3/VDOHVH[HFXWLYHV
Although there are more generic sales-related
50WHFKQRORJLHVRIVKLSSHUVDQG
RISURYLGHUVDJUHHWKH3/VHFWRUFRXOGEHQHÀW
VLJQLÀFDQWOIURPWKHDYDLODELOLWRILQGXVWU
WDLORUHG50FDSDELOLWLHVFRPSDUHGZLWKZKDW
is currently available.
7KHUHDUHDQXPEHURIZDVLQZKLFKWKHXVHRI
50DQGPRELOHWHFKQRORJLHVFDQFUHDWHYDOXH
for the 3PLs and their customers. Overall, the
SULQFLSDOEHQHÀWVRIXVLQJWKHVHWHFKQRORJLHV
DUH WKH VWUHDPOLQH JOREDO ZRUNÁRZV DQG
SURFHVVHVSURYLGHH[HFXWLYHOHYHOYLVLELOLWWR
FRPPHUFLDOOHDGHUVDQGLGHQWLILQHIÀFLHQFLHV
and bottlenecks in commercial operations.
7KHUH DUH D QXPEHU RI ZDV FXVWRPHUV RI
WKHVH3/VFDQEHQHÀWGLUHFWOIURPWKHWSHV
of information available, particularly real-time
information regarding topics such as shipment
visibility, etc.
7KHXVHRI50DQGPRELOHWHFKQRORJLHVFDQ
DOVRSURYLGHDQDGYDQWDJHIRU3/V7KLVHDU·V
survey revealed that 40% of shippers indicated
that their bid processes place emphasis on 3PLs
XWLOL]LQJFDSDEOH50WHFKQRORJLHV
Although there are a number of opportunities
UHODWHG WR WKH XVH RI 50 DQG PRELOH
technologies in the 3PL sales process, getting
PRUHH[SHULHQFHGSURGXFWLYHVDOHVH[HFXWLYHV
to welcome these new technologies is sometimes
easier said than done.
Mexico Rising as Manufacturing
and Logistics Hub
7KH PDQXIDFWXULQJ LQGXVWU LQ 0H[LFR LV
improving, which is creating opportunities for
3PLs as logistics services play a crucial role in
UHQGHULQJ0H[LFR·VEXVLQHVVHVFRVWFRPSHWLWLYH
as compared with similar ventures globally.
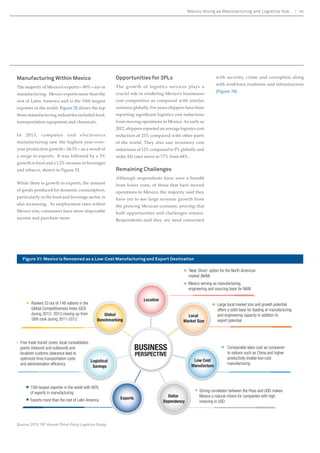
0H[LFRKDVPRUHIUHHWUDGHDJUHHPHQWVWKDQ
any other country, a strategic geographic
location, and is renowned as a low-cost
PDQXIDFWXULQJDQGH[SRUWGHVWLQDWLRQ
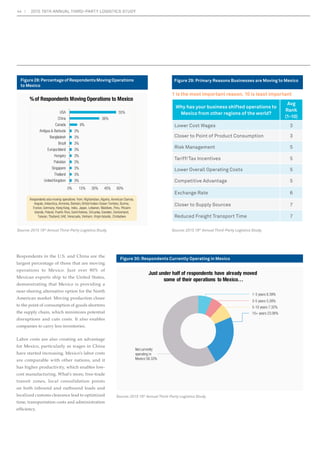
Just under half of study respondents—40%—
said they have already moved some of
WKHLURSHUDWLRQVWR0H[LFRFLWLQJUHGXFHG
IUHLJKWWUDQVSRUWWLPHDQGFORVHUSUR[LPLW
to sources as the most important factors
driving the change. Study respondents
said their businesses are primarily moving
RSHUDWLRQVWR0H[LFRIURPWKH86](https://image.slidesharecdn.com/20153plstudy-141112151357-conversion-gate01/85/2015-Third-Party-Logistics-Study-7-320.jpg)

![EXECUTIVE SUMMARY 7
Supply Chain Risk Management
7KH ULVNV DVVRFLDWHG ZLWK VXSSO FKDLQV
DUHHYROYLQJIURPDEDFNRIÀFHFRQFHUQWRD
prominent position on the boardroom agenda
at an increasing number of organizations.
Recognizing the importance of risk management
is significantly enhancing the effective
management of supply chains worldwide, and
the development of processes, metrics and tools
for supply chain risk management has become
one of the highest priorities for supply chain
H[HFXWLYHVDWPDQRUJDQL]DWLRQVWRGD
7KLUGSDUWORJLVWLFVSURYLGHUVDUHVKRZLQJ
a growing level of commitment to including
risk management services among those
they promote and provide clients. Given the
current interest in risk management and the
emphasis most 3PLs are placing on developing
new products and services to create value for
their customers, this appears to be a prime
area for collaboration between 3PLs and
their customers.
The Intensifying Truck Driver Shortage
New supply chain models and mobile
devices are making just-in-time ordering
and fulfillment all the more possible, but
professional truck drivers remain one of the
most critical links within the supply chain.
As the economic rebound continues, freight
demand is increasing as are concerns over
ZKRZLOOGHOLYHULW7KHLPSHGLQJWUXFNGULYHU
VKRUWDJH LQ WKH 8QLWHG 6WDWHV KDV EHHQ DQ
ongoing topic of conversation and academic
concern for many in the supply chain for
years, and the driver shortage is continuing
to intensify.
If freight demand grows as it is projected to,
the driver shortage could balloon to nearly
GULYHUVE7KHLPSDFWWKHWUXFN
driver shortage will have on the supply chain is
VLJQLÀFDQW0DQPDQXIDFWXUHUVGLVWULEXWRUV
and other intermediaries operating private
WUXFNÁHHWVDUHRXWVRXUFLQJWKHLUWUXFNLQJWR
3PL providers as a solution, but this may be
just kicking the can down the road. It is likely
companies will also begin making upstream
adjustments, such as shifting distribution
patterns, relying on intermodal transportation
and shipping larger quantities at one time.
Regardless, professional drivers remain vitally
important to provide the last-mile delivery of
goods.
Working Corporate Social Responsibility
Into the Supply Chain
RUSRUDWHVRFLDOUHVSRQVLELOLW65](https://image.slidesharecdn.com/20153plstudy-141112151357-conversion-gate01/85/2015-Third-Party-Logistics-Study-11-320.jpg)
![ZKLFK
comprises all facets of how companies should
do business in a sustainable manner, is
growing in importance. A growing number
of companies are concerned not just with
natural resources, but also human rights, labor
practices, environmental impact, business
HWKLFV DQG FRUSRUDWH JRYHUQDQFH 7KH QHZ
ZRUOGRI65XWLOL]HVDSURDFWLYHDSSURDFK
and includes a stronger emphasis on issue
resolution, risk reduction and nimble reaction
to problems, accompanied by innovation (e.g.,
green materials, carbon footprint optimization),
capacity building, stakeholder engagement
LQWHUQDODQGH[WHUQDO](https://image.slidesharecdn.com/20153plstudy-141112151357-conversion-gate01/85/2015-Third-Party-Logistics-Study-12-320.jpg)
![Shipper Experiences with 3PLs:
Measures of Success
Once again, a distinct majority (92%) of shippers
report that their relationships with 3PLs
generally have been successful. Interestingly,
but predictably, an even higher percentage
of 3PLs (98%) say their relationships with
shippers have generally been successful.
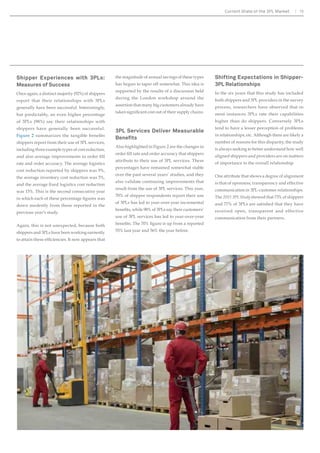
Figure 2 VXPPDUL]HV WKH WDQJLEOH EHQHÀWV
shippers report from their use of 3PL services,
LQFOXGLQJWKUHHH[DPSOHWSHVRIFRVWUHGXFWLRQ
DQGDOVRDYHUDJHLPSURYHPHQWVLQRUGHUÀOO
UDWHDQGRUGHUDFFXUDF7KHDYHUDJHORJLVWLFV
cost reduction reported by shippers was 9%,
the average inventory cost reduction was 5%,
DQGWKHDYHUDJHÀ[HGORJLVWLFVFRVWUHGXFWLRQ
ZDV7KLVLVWKHVHFRQGFRQVHFXWLYHHDU
LQZKLFKHDFKRIWKHVHSHUFHQWDJHÀJXUHVZDV
down modestly from those reported in the
previous year’s study.
$JDLQWKLVLVQRWXQH[SHFWHGEHFDXVHERWK
shippers and 3PLs have been working earnestly
WRDWWDLQWKHVHHIÀFLHQFLHV,WQRZDSSHDUVWKDW
the magnitude of annual savings of these types
KDVEHJXQWRWDSHURIIVRPHZKDW7KLVLGHDLV
supported by the results of a discussion held
during the London workshop around the
assertion that many big customers already have
WDNHQVLJQLÀFDQWFRVWRXWRIWKHLUVXSSOFKDLQV
3PL Services Deliver Measurable
Benefits
Also highlighted in Figure 2 are the changes in
RUGHUÀOOUDWHDQGRUGHUDFFXUDFWKDWVKLSSHUV
DWWULEXWHWRWKHLUXVHRI3/VHUYLFHV7KHVH
percentages have remained somewhat stable
over the past several years’ studies, and they
also validate continuing improvements that
UHVXOWIURPWKHXVHRI3/VHUYLFHV7KLVHDU
70% of shipper respondents report their use
of 3PLs has led to year-over-year incremental
EHQHÀWVZKLOHRI3/VVDWKHLUFXVWRPHUV·
use of 3PL services has led to year-over-year
EHQHÀWV7KHÀJXUHLVXSIURPDUHSRUWHG
55% last year and 56% the year before.
Current State of the 3PL Market 13
Shifting Expectations in Shipper-
3PL Relationships
,QWKHVL[HDUVWKDWWKLVVWXGKDVLQFOXGHG
both shippers and 3PL providers in the survey
process, researchers have observed that in
most instances 3PLs rate their capabilities
KLJKHU WKDQ GR VKLSSHUV RQYHUVHO 3/V
tend to have a lesser perception of problems
in relationships, etc. Although there are likely a
number of reasons for this disparity, the study
is always seeking to better understand how well
aligned shippers and providers are on matters
of importance to the overall relationship.
One attribute that shows a degree of alignment
is that of openness, transparency and effective
communication in 3PL-customer relationships.
7KH2015 3PL Study showed that 73% of shippers
DQGRI3/VDUHVDWLVÀHGWKDWWKHKDYH
received open, transparent and effective
communication from their partners.](https://image.slidesharecdn.com/20153plstudy-141112151357-conversion-gate01/85/2015-Third-Party-Logistics-Study-20-320.jpg)
![modest declines in the percentages of shippers
indicating they outsource certain activities and
processes. Also, one perspective that received
attention in this year’s workshops was that
there is continuing evidence that, in many
instances, shippers will choose not to outsource
operations where they feel they can serve their
customers better.
Again with this year’s study, the most
frequently outsourced activities tend to be
those that are more transactional, operational
DQGUHSHWLWLYH7KHVHLQFOXGHGRPHVWLFDQG
international transportation (80% and 70%,
respectively), warehousing (67%), customs
brokerage (53%) and freight forwarding (51%).
:LWKWKHH[FHSWLRQRIGRPHVWLFWUDQVSRUWDWLRQ
these percentages are several points lower than
those reported in the previous study.
7KH OHVV IUHTXHQWO RXWVRXUFHG DFWLYLWLHV
indicated in Figure 3 continue to be those that
DUH PRUH VWUDWHJLF FXVWRPHU IDFLQJ DQG ,7
LQWHQVLYH([DPSOHVLQFOXGHRUGHUPDQDJHPHQW
DQGIXOÀOOPHQWLQYHQWRUPDQDJHPHQWVXSSO
FKDLQFRQVXOWDQFVHUYLFHV,7VHUYLFHV//33/
services and customer service. Generally, these
percentages also are lower than those reported
in the previous study.
Among the many topics of interest during
workshops was that there appears to be
an evolution of demand for and increasing
acceptance of the concept of 4PL services
(broadly defined). Although there are a
growing number of companies (or divisions
of companies) that are viewed as commercial
providers of 4PL services, the types of services
that would be offered by a 4PL are also the same
types of services that should be evident in any
well-run customer supply chain organization.
Although it is not fair to draw conclusions
based on one year’s supply of new survey
results, the analysis looks carefully at the
reasons why shippers generally reported lesser
percentages in terms of utilizing many of the
logistics services and processes than they did
in the previous year’s study. Among the reasons
that may bear some relevance are: impacts of
ODJJLQJJOREDOHFRQRPLHVGHFLVLRQVPDGHE
providers of logistics services that have impacts
RQSULFLQJDQGDYDLODELOLWRIWKRVHVHUYLFHV
responses to shippers feeling pressure to reduce
Current State of the 3PL Market 15
FRVWVZKHUHYHUDQGZKHQHYHUSRVVLEOHDQG
changing purchasing patterns among shippers.
Also, the composition of this year’s survey
respondents may also have some impact on
the results included in Figure 3.
3PL’s IT Capabilities: What are the
Front-Running Types of Information
Technologies?
It has been clear for some time that the
SURYLVLRQRIFDSDEOH,7VHUYLFHVKDVEHHQDNH
element of the value proposition in shipper-3PL
relationships. As shown in Figure 4, shippers
indicate a greater need for activities such as
transportation management, warehouse/
distribution center management, EDI, visibility,
HWFZKLFKDUHPRVWOH[HFXWLRQDQGWUDQVDFWLRQ
oriented. In fact, there is a relatively discernable
relationship between the propensity of shippers
WRXWLOL]HVSHFLÀF,7EDVHGVHUYLFHVDQGWKH
types of logistics services that are outsourced
to 3PLs (as summarized in Figure 3). Looking
DWWKH,7EDVHGVHUYLFHVLQ)LJXUHWKDWDUH
of a somewhat lesser priority at present, it
is apparent that these are generally related](https://image.slidesharecdn.com/20153plstudy-141112151357-conversion-gate01/85/2015-Third-Party-Logistics-Study-22-320.jpg)
![JDSDSSHDUVWRKDYHODUJHOVWDELOL]HGµ
this year’s study continues to look for reasons
WKDWPDH[SODLQZKWKLVJDSFRQWLQXHVWR
QDUURZ$VH[SODLQHGODWHULQWKLVUHSRUWD
VSHFLDOWRSLFZLWKLQWKLVHDU·VVWXGLV50
XVWRPHU5HODWLRQVKLS0DQDJHPHQW](https://image.slidesharecdn.com/20153plstudy-141112151357-conversion-gate01/85/2015-Third-Party-Logistics-Study-24-320.jpg)

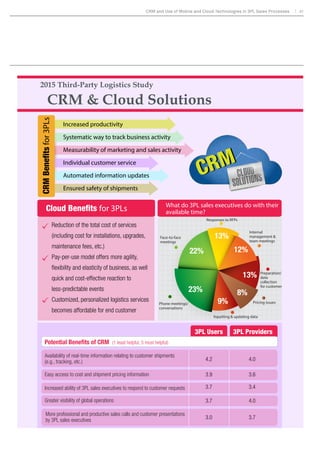
![7RGD·VUHWDLOODQGVFDSHLVHYROYLQJUDSLGO
adjusting to changes in consumer demand as
well as technological innovations. Now more
WKDQ HYHU FRQVXPHUV H[SHFW DQ DOZDVRQ
DOZDVRSHQVKRSSLQJH[SHULHQFHDQGWKHDUH
looking for seamless interaction across retail
VDOHVFKDQQHOV7RPHHWWKRVHH[SHFWDWLRQV
UHWDLOHUV QHHG WR KDYH D UREXVW IXOÀOOPHQW
strategy and a highly detailed, integrated
approach.
And there are more consumers than ever as
changing economics are affecting the face of
UHWDLOLQJ:LWKLQWKH8QLWHG6WDWHVKRXVHKROG
net worth has been improving, increasing 13.4%
in 2013 after a 9.5% rise in 2012. Globally, the
middle class is growing and is on track to more
than double in size to 4.9 billion by 2030 from
2 billion today.
7KH JURZWK RI WKH PLGGOH FODVV PHDQV
consumers have more discretionary income.
7RFDSWXUHWKHVHQHZDQGJURZLQJVSHQGHUV
retailers are gradually transitioning their
RIIHULQJVWRPDWFKWKHH[SHFWDWLRQVRIZKDW
ZKHQDQGZKHUHFXVWRPHUVZDQWWRVKRS7R
succeed in this changing landscape, retailers
are enhancing the consumer-facing side of
their operations, requiring a redesign of their
supply chain and testing new fulfillment
options to keep up with rapidly evolving
FRQVXPHUH[SHFWDWLRQV
7KHFXVWRPHUIDFLQJRSHUDWLRQVRIUHWDLOHUV
are emphasizing consumer engagement and
turning to tailored marketing and promotions,
such as customized messages pushed to
shoppers’ mobile devices based on their
ORFDWLRQDQGSURGXFWVXJJHVWLRQVLQÁXHQFHG
by their previous shopping history. As a
result, retailers are trying to be more dynamic
The New Landscape of Omni-Channel Retailing 19
than their competition and creating a unique
FXVWRPHUH[SHULHQFH
But respondents said they have found
FXVWRPHUV·H[SHFWDWLRQVGLIIHUEDVHGRQWKHLU
geography. What meets customers’ needs in
one area may not in another, so the ability to
differentiate offerings by geographic location
can improve customer service while also
UHTXLULQJ JUHDWHU IOH[LELOLW DFURVV JOREDO
operations..
So while retailers’ sales and marketing
departments are promoting the tailored,
FXVWRPL]HGFRQWHQWWKHIXOÀOOPHQWDQGORJLVWLFV
GLYLVLRQVKDYHWRHQVXUHDVHDPOHVVH[SHULHQFH
for the customer. As consumers become more
H[SRVHGWRLPSURYHGRIIHULQJVIURPUHWDLOHUV
WKHEHJLQWRH[SHFWPRUHLQWHUPVRIZKHQ
and how they can get their products delivered.
And while several companies are blazing a trail
ZLWKQHZIXOÀOOPHQWPRGHOVRWKHUVDUHWULQJ
WRGHWHUPLQHDFXVWRPHUH[SHFWDWLRQYHUVXVD
customer requirement.
7RVXFFHHGLQWKLVFKDQJLQJODQGVFDSHUHWDLOHUV
are enhancing the consumer-facing side of their
operations, redesigning their supply chain,
WHVWLQJQHZIXOÀOOPHQWRSWLRQVDQGIRFXVLQJ
RQDVSHFLDOL]HGPRGHOZLWKDVSHFLÀFSXUSRVH
in mind.
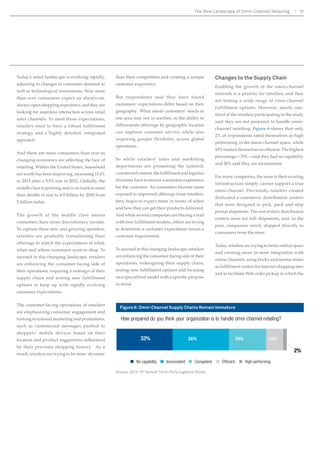
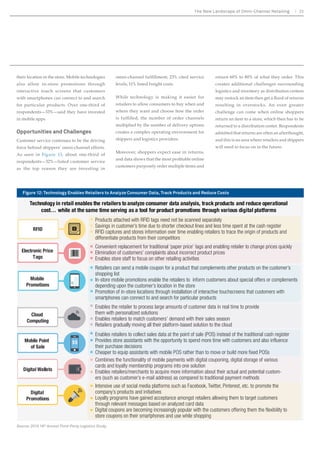
Changes to the Supply Chain
Enabling the growth of the omni-channel
network is a priority for retailers, and they
are testing a wide range of cross-channel
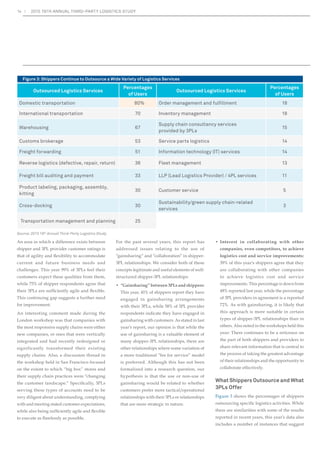
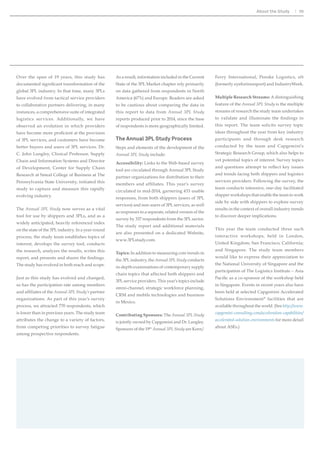
fulfillment options. However, nearly one-third
of the retailers participating in the study
said they are not prepared to handle omni-channel
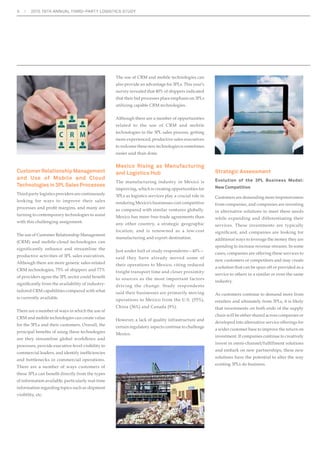
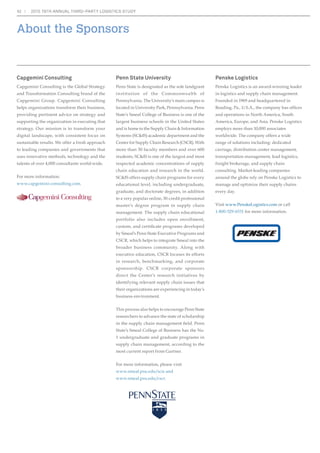
retailing. Figure 6 shows that only
2% of respondents rated themselves as high
performing in the omni-channel space, while
UDQNHGWKHPVHOYHVDVHIÀFLHQW7KHKLJKHVW
percentage—33%—said they had no capability
and 26% said they are inconsistent.
)RUPDQFRPSDQLHVWKHLVVXHLVWKHLUH[LVWLQJ
infrastructure simply cannot support a true
omni-channel. Previously, retailers created
dedicated e-commerce distribution centers
that were designed to pick, pack and ship
SDUWLDOVKLSPHQWV7KHUHVWRIWKHLUGLVWULEXWLRQ
centers were for full shipments, and, in the
past, companies rarely shipped directly to
consumers from the store.
7RGDUHWDLOHUVDUHWULQJWREHWWHUXWLOL]HVSDFH
and creating more in-store integration with
online channels, using bricks-and-mortar stores
DVIXOÀOOPHQWFHQWHUVIRULQWHUQHWVKRSSLQJVLWHV
and to facilitate Web order pickup in which the
Figure 6: Omni-Channel Supply Chains Remain Immature
How prepared do you think your organization is to handle omni-channel retailing?
26% 29% 10%
Source: 2015 19th Annual Third-Party Logistics Study.
2%
33%
No capability Inconsistent Competent Efficient High performing](https://image.slidesharecdn.com/20153plstudy-141112151357-conversion-gate01/85/2015-Third-Party-Logistics-Study-29-320.jpg)
![SDFNDJHVWRVKRSSHUVQHDUELQH[FKDQJHIRU
a discount on their bill.
Amazon has made headlines by testing drones
IRUIDVWHUGHOLYHURIJRRGV7KHGURQHVFDQ
FDUUSDFNDJHVZHLJKLQJDERXWÀYHSRXQGV
to locations within a one-mile radius of an
$PD]RQIXOÀOOPHQWFHQWHU7KHRQOLQHUHWDLOHU
has also installed delivery lockers in grocery,
convenience and drugstore outlets at several
ORFDWLRQVLQWKH86DQGWKH8QLWHG.LQJGRP
7KHORFNHUVKROGSDFNDJHVZHLJKLQJOHVVWKDQ
10 pounds and customers can pick up their
deliveries at their convenience, eliminating the
chance of missing a delivery or theft from their
doorsteps. In the Los Angeles and New York
metropolitan areas, Amazon is collaborating
ZLWKWKH863RVWDO6HUYLFHWRSURYLGH6XQGD
package delivery.
Yet with new opportunities come new
challenges. Retailers have the opportunity to
provide customers with more options than ever
EHIRUHEXWWKHDOVRKDYHWRHQVXUHÁDZOHVV
H[HFXWLRQ7RVXSSRUWWKHUROORXWRIWKHRPQL
FKDQQHOFRQVXPHUH[SHULHQFHUHWDLOHUVDUH
investing in new technologies, allowing them to
make decisions based on real-time information
from stores.
20 2015 19TH ANNUAL THIRD-PARTY LOGISTICS STUDY
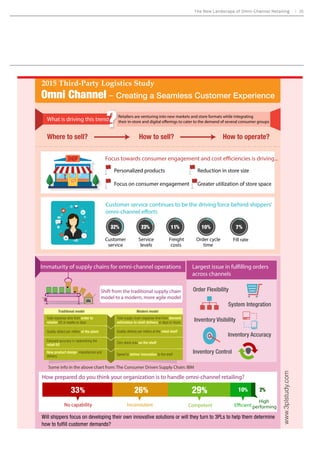
Varied Fulfillment Options
While respondents are still developing
their omni-channel supply chains, they are
DWWHPSWLQJ WR SURYLGH IOH[LEOH IXOILOOPHQW
options and testing new approaches, including
in-vehicle pickup, warehouse pickup and
buy-online-and-pick-up-in-an-hour options.
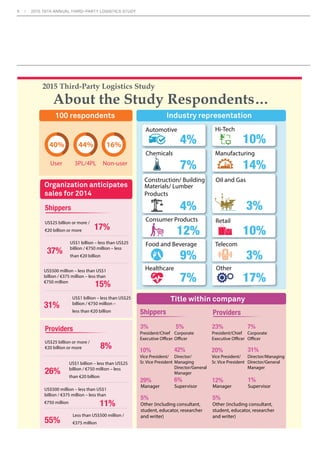
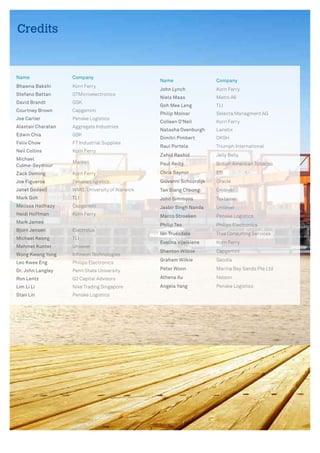
Figure 7 shows that among respondents, 36%
currently offer order-online-and-pickup-at-the-warehouse,
29% allow consumers order in store
for home delivery, 22% allow mobile orders to
be picked up at the warehouse and 20% offer
warehouse pickup of orders placed in the store.
Nearly half of respondents, as shown in
Figure 8, said they are not testing new
fulfillment strategies, but 16% are either
utilizing or considering home delivery from
local stores, 15% either do or plan to offer
Sunday delivery, 12% are either using or
investigating customer delivery in which an
in-store shopper delivers goods, and 11% are
using or interested in locker pickup. A smaller
number—4%—are considering drone delivery
and bike/messenger delivery.
:DO0DUWLVDPRQJWKRVHORRNLQJWRWDSLQWR
shoppers who are already in the store to deliver
products to customers who ordered online.
In-store shoppers would inform the retailer
of their destination and volunteer to deliver
customer shops online then picks the package
XSDWWKHVWRUH2IÀFH'HSRWIRUH[DPSOHKDV
introduced an updated Web order, in-store
SLFNXSSURJUDPFDOOHG´%X2QOLQH3LFN8SLQ
DQ+RXUµZKHUHERQOLQHRUGHUVDW2IÀFH'HSRW
com are ready for pickup in about 60 minutes.
Ship-to-store options have the potential to
reduce the retailer’s transportation costs and
possibly spur additional in-store sales made
when shoppers pickup an online purchase.
HWLQVSLWHRIWKHEHQHÀWVUHVSRQGHQWVVDLG
most companies don’t have the space to run a
SLFNDQGSDFNRSHUDWLRQIURPWKHVWRUH7KH
said to get to a true omni-channel, they would
have to dismantle their current network, which
would be costly.
RPSDQLHVKDYHWRGHWHUPLQHKRZPXFKRI
their current infrastructure they are willing
to take apart to build new delivery channels.
0DQDUHWDNLQJD´ZDLWDQGVHHµDSSURDFK
to determine which customer requirements
VWLFNDQGZKLFKDUHDIDGRQVXPHUJRRGV
companies are also questioning whether or
not it makes sense for them to create their
RZQIXOÀOOPHQWVROXWLRQVRULIWKHVKRXOG
partner with another type of service provider
ZKRFDQKDQGOHWKHVHUYLFHVIRUWKHP7KLV
may create additional opportunities for 3PLs
going forward.
Figure 7: Respondents Offer a Variety of Cross-Channel Fulfillment Options
Do you offer/enable cross-channel fulfillment?
Mobile Order – Pickup at warehouse
Order InStore – Pickup at warehouse
Order Online – Pickup In store
Mobile Order – Pickup In store
Order Online – In-vehicle pickup
0 20 40 60 80 100 120 140
# of Respondents
Order Online – Pickup at warehouse
Order InStore – Deliver to home
Source: 2015 19th Annual Third-Party Logistics Study.
N=365](https://image.slidesharecdn.com/20153plstudy-141112151357-conversion-gate01/85/2015-Third-Party-Logistics-Study-30-320.jpg)
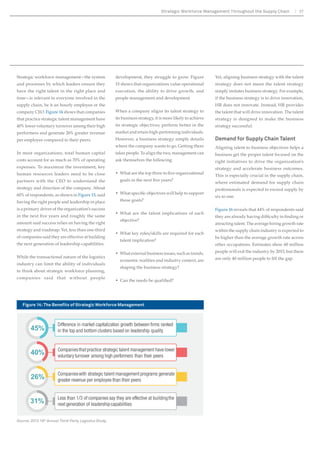
![Shared
DCs
+RZHYHU IXOÀOOLQJ RUGHUV DFURVV PXOWLSOH
channels can create issues. Respondents were
PRVWFRQFHUQHGZLWKRUGHUÁH[LELOLWODVW
minute changes to either the quantity, shipping
address or shipping speed), system integration
and inventory visibility, accuracy and control
(Figure 11).
As online shopping continues to grow,
VKLSSHUVDUHOHIWWULQJWRÀJXUHRXWKRZWR
merge information to consolidate shipments
DQGLQFUHDVHHIÀFLHQF'XULQJWKH/RQGRQ
workshop, a respondent shared the story of one
DHL truck showing up at a business to deliver
business-to-business orders while another
arrived to deliver packages to employees from
WKHLUSHUVRQDORUGHUV7HFKQRORJWKDWFUHDWHV
additional visibility is a likely solution.
7KH ULVH RI QHZ WHFKQRORJLHV LV DIIHFWLQJ
retailers’ perspectives. Digital promotions,
mobile promotions and digital wallets are
LPSDFWLQJUHWDLOHUVWKHPRVW7KHVHWHFKQRORJLHV
give retailers greater insight, and therefore the
DELOLWWRFXVWRPL]HVROXWLRQV)RUH[DPSOH
digital wallets combine the functionality of
mobile payments with digital couponing, and
digital storage of various cards and loyalty
Figure 11: Fulfilling Orders Across Multiple Channels Creates Certain Issues
80
80
58
28
30
30
membership programs into one solution,
enabling retailers to acquire more information
about their actual and potential customers
compared to traditional payment methods.
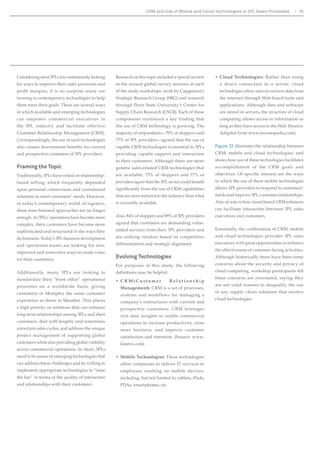
Because retailers are increasingly dependent
on technology for real-time visibility into
operations to track products when they leave
the manufacturing facility, throughout the
VXSSOFKDLQDQGXQWLOWKHDUULYHDWWKHÀQDO
point of sale, retailers are gradually moving
all of their platform-based solutions to the
FORXG7KLVHQDEOHVUHWDLOHUVWRSURFHVVODUJH
amounts of customer data faster, better match
customers’ demands with a sales season and
provide personalized solutions, not only in
what customers buy and how they buy it, but
also in how they receive it.
By obtaining and transmitting information
PRUHHIÀFLHQWODQGLQQHZZDVUHWDLOHUV
DQGVKLSSHUVDUHDEOHWRRIIHUPRUHIXOÀOOPHQW
options, giving customers the option of picking
products up in the store or the warehouse or
KDYLQJWKHPGHOLYHUHGWRWKHLUVWRUH7KHVH
technologies, along with others, enable the
concept of mass customization, which has been
of growing interest to both manufacturers and
retailers.
Personalized Products and
Experiences
Retailers are focusing more on consumer
engagement in response to customers’ targeted,
WLPHHIÀFLHQWQHHGVEDVHGWULSVZKLOHDOVR
VHHNLQJWRGHYHORSPRUHSURÀWDEOHFRPSOH[
solutions offering real value to shoppers.
XVWRPVROXWLRQVDUHEHFRPLQJSUHYDOHQWLQD
ZLGHYDULHWRIUHWDLORSHUDWLRQV)RUH[DPSOH
retailers are now offering home décor product
selection and installation services ordered in
a single touch. In apparel, shoe manufacturer
New Balance allows customers to create custom
VKRHVHLWKHURQOLQHRULQLWVÁDJVKLS0DQKDWWDQ
store. Once the shopper designs his or her shoe,
LWLVPDQXIDFWXUHGDWD86IDFLOLWZLWKLQVL[WR
10 business days and shipped to the customer.
With mobile technologies, retailers can send a
mobile coupon for a product that complements
other items on the customer’s shopping list or
inform customers about special offers based on
22 2015 19TH ANNUAL THIRD-PARTY LOGISTICS STUDY
Figure 10: Respondents Use a Mix of
Solutions to Manage Fulfillment
How do you manage fulfillment by channel?
N=320
36%
15% 16%
Mix
33%
Outsourced DCs by channel
What is your largest issue in fulfilling orders across multiple channels? (select top 3)
116
95
81
61
41
31
11
0 50 100 150
Issues in Omni Channel by # of Respondents
Picking waving logic
Long-term DC leases
Expedited delivery
Return management
Pick/Pack ef f iciency
Ef f iciency
Technology
Order management
Inventory control
Inventory accuracy
Inventory visibility
System integration
Order felxibility
N=304
Source: 2015 19th Annual Third-Party Logistics Study.](https://image.slidesharecdn.com/20153plstudy-141112151357-conversion-gate01/85/2015-Third-Party-Logistics-Study-32-320.jpg)


![development, they struggle to grow. Figure
15 shows that organizations value operational
H[HFXWLRQWKHDELOLWWRGULYHJURZWKDQG
people management and development.
When a company aligns its talent strategy to
its business strategy, it is more likely to achieve
its strategic objectives, perform better in the
market and retain high-performing individuals.
However, a business strategy simply details
where the company wants to go. Getting there
WDNHVSHRSOH7RDOLJQWKHWZRPDQDJHPHQWFDQ
ask themselves the following:
‡ :KDWDUHWKHWRSWKUHHWRÀYHRUJDQL]DWLRQDO
JRDOVLQWKHQH[WÀYHHDUV
‡ :KDWVSHFLÀFREMHFWLYHVZLOOKHOSWRVXSSRUW
those goals?
‡What are the talent implications of each
objective?
‡What key roles/skills are required for each
talent implication?
‡ :KDWH[WHUQDOEXVLQHVVLVVXHVVXFKDVWUHQGV
HFRQRPLFUHDOLWLHVDQGLQGXVWUFRQWH[WDUH
shaping the business strategy?
‡ DQWKHQHHGVEHTXDOLÀHG
Yet, aligning business strategy with the talent
strategy does not mean the talent strategy
VLPSOLPLWDWHVEXVLQHVVVWUDWHJ)RUH[DPSOH
if the business strategy is to drive innovation,
HR does not innovate. Instead, HR provides
WKHWDOHQWWKDWZLOOGULYHLQQRYDWLRQ7KHWDOHQW
strategy is designed to make the business
strategy successful.
Demand for Supply Chain Talent
Aligning talent to business objectives helps a
business get the proper talent focused on the
right initiatives to drive the organization’s
strategy and accelerate business outcomes.
7KLVLVHVSHFLDOOFUXFLDOLQWKHVXSSOFKDLQ
where estimated demand for supply chain
SURIHVVLRQDOVLVH[SHFWHGWRH[FHHGVXSSOE
VL[WRRQH
Figure 16 reveals that 44% of respondents said
WKHDUHDOUHDGKDYLQJGLIÀFXOWLQÀQGLQJRU
DWWUDFWLQJWDOHQW7KHDYHUDJHKLULQJJURZWKUDWH
ZLWKLQWKHVXSSOFKDLQLQGXVWULVH[SHFWHGWR
be higher than the average growth rate across
other occupations. Estimates show 60 million
SHRSOHZLOOH[LWWKHLQGXVWUEEXWWKHUH
DUHRQOPLOOLRQSHRSOHWRÀOOWKHJDS
Strategic workforce management—the system
and processes by which leaders ensure they
have the right talent in the right place and
time—is relevant to everyone involved in the
supply chain, be it an hourly employee or the
FRPSDQ(2Figure 14 shows that companies
that practice strategic talent management have
40% lower voluntary turnover among their high
performers and generate 26% greater revenue
per employee compared to their peers.
In most organizations, total human capital
costs account for as much as 70% of operating
H[SHQVHV7RPD[LPL]HWKHLQYHVWPHQWNH
human resources leaders need to be close
SDUWQHUV ZLWK WKH (2 WR XQGHUVWDQG WKH
strategy and direction of the company. About
60% of respondents, as shown in Figure 15, said
having the right people and leadership in place
is a primary driver of the organization’s success
LQWKHQH[WÀYHHDUVDQGURXJKOWKHVDPH
amount said success relies on having the right
strategy and roadmap. Yet, less than one-third
of companies said they are effective at building
WKHQH[WJHQHUDWLRQRIOHDGHUVKLSFDSDELOLWLHV
While the transactional nature of the logistics
industry can limit the ability of individuals
to think about strategic workforce planning,
companies said that without people
Figure 14: The Benefits of Strategic Workforce Management
Strategic Workforce Management Throughout the Supply Chain 27
Difference in market capitalization growth between firms ranked
45% in the top and bottom clusters based on leadership quality
Companies that practice strategic talent management have lower
voluntary turnover among high performers than their peers
Companies with strategic talent management programs generate
greater revenue per employee than their peers
Less than 1/3 of companies say they are effective at building the
next generation of leadership capabilities
40%
26%
31%
Source: 2015 19th Annual Third-Party Logistics Study.](https://image.slidesharecdn.com/20153plstudy-141112151357-conversion-gate01/85/2015-Third-Party-Logistics-Study-37-320.jpg)
![1RWRQOGRHVGHPDQGIRUVXSSOFKDLQH[SHUWV
KDYHWKHSRWHQWLDOWRJURZH[SRQHQWLDOODV
shown in Figure 17) with demand being
greater than the supply across all supply
chain roles, positions within the industry
are changing. As a result of the dynamic
nature of the supply chain industry, three
RXW RI IRXU MREV DUH H[SHFWHG WR FKDQJH E
2015 alone, and there is a potential shortage
of new talent resulting from the constant
evolution of supply chain processes. As noted in
Figure 18, respondents said changes to the
EXVLQHVVPRGHODORQJZLWKGLIÀFXOWLQÀQGLQJ
and/or attracting talent are among their top
pressures.
7KH 3/ LQGXVWU·V SHUFHSWLRQ RI DQG
competition for supply chain talent has
worsened the demand-supply talent gap.
As seen in Figure 19, the majority of survey
respondents feel that closing the gap between
supply and demand is one of their largest
challenges affecting 28% of respondents to a
JUHDWH[WHQWDQGRIUHVSRQGHQWVWRVRPH
H[WHQW
3PLs compete for talent with other 3PLs,
PDQXIDFWXUHUVUHWDLOHUVDQGFRQVXOWLQJÀUPV
0DQPDQDJHUVDQGRWKHUVLQOHDGHUVKLSUROHV
leave large 3PLs for better opportunities in other
industries, and the 3PL industry is struggling
WRFRQWDLQDKLJKPDQDJHPHQWDWWULWLRQUDWH7R
overcome challenges and industry perceptions,
3PLs may need to continue to develop their
staff and invest in workforce management at
all levels. In Figure 20, 47% of respondents said
a top issue in the organization is developing
leaders, 28% said they struggle with effectively
managing succession and 20% say they need to
improve supervision and coaching.
Going forward, top employees are going to need
DPL[RIERWKVRIWDQGKDUGVNLOOVLQYROYLQJ
leadership qualities and cross-functional
competencies. Of concern to those within the
industry is that the leadership of today may
not have the skills or capabilities that will be
necessary in future leadership roles. Employers
will need to develop the skills of senior
management to ensure they are equipped
with the right skills and mindset to make the
ULJKWKLULQJGHFLVLRQV7KLVZLOOUHTXLUHDZHOO
thought out strategic talent management plan.
Vertical and Horizontal Management
Links
Strategic talent management consists of two
key elements—a vertical link to strategy and a
horizontal link across all talent management
SUDFWLFHV7KHYHUWLFDOOLQN³DOVRNQRZQDV
strategic alignment—is the connection between
business needs and individual performance.
7KH KRUL]RQWDO OLQN³NQRZQ DV LQWHJUDWHG
talent management—reflects how all the
talent management practices are integrated
into a coherent system and leveled at the same
goals. By optimizing both these vertical and
horizontal links between talent and strategy,
an organization builds a talent machine that
IXHOVVWUDWHJH[HFXWLRQDQGDFKLHYHVEXVLQHVV
results.
8OWLPDWHO EXVLQHVV VWUDWHJLHV GHWHUPLQH
which roles provide a competitive advantage,
the type of talent required, and the skills to be
FXOWLYDWHGDQGUHZDUGHG7KHFRPSDQ·VWDOHQW
management practices must develop people
with the skills, knowledge and motivation to
implement the business strategy. Figure 21
shows what the best leaders do differently.
Talent Leaders and People Leaders
Every organization has both people leaders
DQGWDOHQWOHDGHUVDQGERWKIXOÀOOGLVWLQFWUROHV
People leaders are more adept at coaching and
developing others and serve as a role model of
the company’s values and culture. Great talent
leaders use talent as a strategic lever, make good
decisions around people and have a proactive
plan for how and when to move talent to drive
business outcomes.
Return on Investment
7KH UHWXUQ RQ LQYHVWPHQW IURP VWUDWHJLF
workforce management is substantial. It
contributes to a boost in morale, increased
productivity, increased discretionary
effort, lower turnover and higher customer
satisfaction. A recent study found that a one
standard deviation increase in investment
in aligning and integrating HR practices is
associated with a 7.5% decrease in employee
turnover and, on a per employee basis, $27,044
more in sales, $18,641 more in market value and
PRUHLQSURÀW
28 2015 19TH ANNUAL THIRD-PARTY LOGISTICS STUDY
Figure 15: Organizations’ Primary Drivers of Success in Five Years
Source: 2015 19th Annual Third-Party Logistics Study.
0% 20% 40% 60% 80%
Having the right people and leadership in place
Having the right strategy and roadmap
Ability to execute and drive operational efficiency and
improvements
Having the right products and services
Ability to innovate
Having the ability to drive greater operational efficiency
and improvements
Having the ability to drive greater innovation
Having the right infrastructure
% of Respondents](https://image.slidesharecdn.com/20153plstudy-141112151357-conversion-gate01/85/2015-Third-Party-Logistics-Study-38-320.jpg)

![RUUHVSRQGLQJOWKHXVHRIVXFKWHFKQRORJLHV
DOVRFUHDWHVGRZQVWUHDPEHQHÀWVIRUFXUUHQW
and prospective customers of 3PL providers.
Framing the Topic
7UDGLWLRQDOO3/VKDYHUHOLHGRQUHODWLRQVKLS
based selling, which frequently depended
upon personal connections and customized
solutions to meet customers’ needs. However,
in today’s contemporary world of logistics,
these time-honored approaches are no longer
enough. As 3PLs’ operations have become more
FRPSOH[WKHLUFXVWRPHUVKDYHEHFRPHPRUH
sophisticated and structured in the ways they
GREXVLQHVV7RGD·V3/EXVLQHVVGHYHORSPHQW
and operations teams are looking for new,
improved and innovative ways to create value
for their customers.
Additionally, many 3PLs are looking to
VWDQGDUGL]HWKHLU´IURQWRIÀFHµRSHUDWLRQDO
processes on a worldwide basis, giving
FXVWRPHUV LQ 0HPSKLV WKH VDPH FXVWRPHU
H[SHULHQFHDVWKRVHLQ0XPEDL7KLVSODFHV
a high priority on solutions that can enhance
long-term relationships among 3PLs and their
customers, deal with lengthy and sometimes
uncertain sales cycles, and address the unique
project management of supporting global
customers while also providing global visibility
across commercial operations. In short, 3PLs
need to be aware of emerging technologies that
can address these challenges and be willing to
implement appropriate technologies to “raise
the bar” in terms of the quality of interaction
and relationships with their customers.
CRM and Use of Mobile and Cloud Technologies in 3PL Sales Processes 35
Research on this topic included a special section
in the annual global survey sessions at each
RIWKHVWXGZRUNVKRSVZRUNEDSJHPLQL·V
Strategic Research Group (SRG) and research
WKURXJK 3HQQ 6WDWH 8QLYHUVLW·V HQWHU IRU
6XSSOKDLQ5HVHDUFK65](https://image.slidesharecdn.com/20153plstudy-141112151357-conversion-gate01/85/2015-Third-Party-Logistics-Study-46-320.jpg)
![7KHUHDUHVHYHUDONHUROHVIRUWKHXVHRI50
LQWKH3/LQGXVWUDFFRUGLQJWR/DQHWL[DQG
50Buyer:
‡ 506WUDWHJ(IIHFWLYH50FDSDELOLWLHV
DUH VLJQLÀFDQW DVVHWV WR 3/V VHHNLQJ WR
improve customer relationships, support
sales and marketing services, and integrate
customer-facing technologies with back-end
VVWHPVVXFKDVRUGHUIXOÀOOPHQWHWF
‡ 6WDQGDUGL]DWLRQRI*OREDO:RUNÁRZVDQG
3URFHVVHV(IIHFWLYH50VROXWLRQVDOORZ
business users (without involvement of
WKH,QIRUPDWLRQ7HFKQRORJGHSDUWPHQW](https://image.slidesharecdn.com/20153plstudy-141112151357-conversion-gate01/85/2015-Third-Party-Logistics-Study-50-320.jpg)
![WREUHDNFRPSOH[SURFHVVHVLQWRHDVWR
XQGHUVWDQGZRUNÁRZVVRWDVNVDUHDVVLJQHG
WRWHDPPHPEHUVEDVHGRQWKHLUH[SHUWLVH
7KLV JLYHV FRPPHUFLDO OHDGHUV JOREDO
visibility across sales, operations, solutions
and customer service departments.
‡ *OREDODQGRPSHWLWLYH(QYLURQPHQW50
mobile and cloud technologies are particularly
useful when business circumstances require
real-time connectivity in geographically
separated locations.
‡ ,PSURYHG2UJDQL]DWLRQDO3URGXFWLYLW
50 VWUDWHJLHV FDQ OHDG WR VLJQLILFDQW
improvements in overall organizational and
sales productivity, and they can facilitate
innovative approaches to customer service,
account management, prospect management,
and campaign and order management.
‡ .3,6FRUHFDUGV50VROXWLRQVDOVRLQFOXGH
integrated KPI (key performance indicator)
scorecards, so commercial leaders can
measure and manage the performance of
their workforce, from customized solutions
to customer success.
7RHVWDEOLVKVRPHEDVHOLQHPHWULFVUHJDUGLQJ
FXUUHQWXVDJHRI50RUPRELOHWHFKQRORJLHVLQ
support of customers, the survey asked shippers
LIWKH´FXUUHQWOVHHDQ3/VDOHVH[HFXWLYHV
ZKRDUHXVLQJ50RUPRELOHWHFKQRORJLHV
(e.g., tablets, smartphones) as part of their
VDOHVUHVSRQVLELOLWµ7KHVXUYHDOVRDVNHG
Use by 3PLs of mobile technologies provide better, more timely information
and better service to customers
These solutions provide real-time visibility into the extended supply chain and
enable operational efficiency
Mobile solutions help 3PL players with value-added services such as
shipment track and trace and other shipment-specific information
Integration with TMS and WMS solutions
Cloud-based CRM solutions enable 3PLs to launch new services, target new
industries and address global supply chain issues
Cloud solutions enhance information flow between 3PLs and customers that
helps to reduce costs, improve operational capabilities, sourcing activities, etc.
Cloud solutions provide end-to-end solutions for the entire supply chain and 3PL
players are actively investing in these technologies
Leveraging
Mobile
Technologies
Leveraging
Cloud-based
Solutions
3PL
Customer
Relationship
Management
Customers
3/SURYLGHUVLIWKHLUVDOHVH[HFXWLYHVXVHWKHVH
technologies in support of their customers.
Although 48% of shippers indicated they see
3/VDOHVH[HFXWLYHVXVLQJWKHVHWHFKQRORJLHV
(smartphones, in particular), and 73% of 3PL
respondents indicate using these technologies,
ZHIHHOWKHUHVXOWVWRVRPHH[WHQWPDRYHUVWDWH
the current use of the robust and fully capable
50DQGPRELOHWHFKQRORJLHVWKDWDUHEHLQJ
GHYHORSHG DQG UHÀQHG IRU XVH LQ UHDOWLPH
environments. We look forward to greater
clarity on this issue.
3PL Sales Processes – Purposes
and Realities
In a perfect world, 3PL sales and business
development staff would spend 100% of
their time in customer-facing activities and
situations. However, this is actually far from
the truth. A recent article suggested that “most
sales reps spend less than half of their time
actually selling.” Additionally, the article
suggested that some “inside” sales reps at a
global manufacturer spent 75% of their time
away from their phones, and that highly paid
ÀHOGUHSVVSHQWRIWKHLUWLPHSURYLGLQJ
internal sales support and tracking the progress
of deals. Developing a standard proposal
sometimes required meetings with as many
DVVHYHQSHRSOHDQGÀHOGUHSVKDGWRVSHQG
up to three weeks of constant effort to get a
special price approved. Given that the greatest
YDOXHRIFDSDEOHVDOHVH[HFXWLYHVRFFXUVZKHQ
they are in contact with current and prospective
customers, the prevailing situation leaves a lot
to be desired.
7R SURYLGH JUHDWHU LQVLJKW RQ WKLV WRSLF DV
LWDSSOLHVWR3/VDOHVH[HFXWLYHVWKLVHDU·V
survey asked 3PL providers “What do 3PL
VDOHVH[HFXWLYHVGRZLWKWKHLUDYDLODEOHWLPHµ
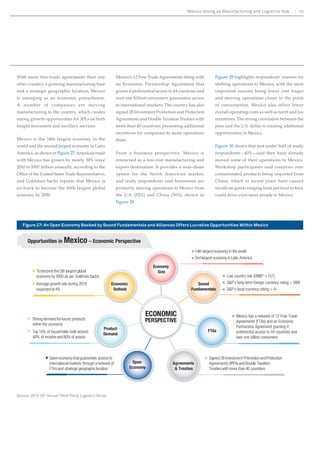
Looking at the content of Figure 23, survey
UHVXOWVUHSRUWWKDW3/VDOHVH[HFXWLYHVVSHQG
an average of 45% of their time engaged in
customer-facing activities, such as phone
meetings/conversations (23%) and face-to-face
meetings (22%).
A look at the remaining portions of Figure
VXJJHVWVWKDW3/VDOHVH[HFXWLYHVVSHQG
the other 55% of their time on other topics,
including navigating pricing issues, inputting
and updating data, preparing and collecting
data for customers, managing internal issues
and team meetings and responding to RFPs.
7KHVH DUH DOO LPSRUWDQW DFWLYLWLHV DQG IRU
some the direct involvement of the 3PL sales
H[HFXWLYHVLVKHOSIXODQGSRVVLEOHVVHQWLDO
+RZHYHULIWKHVHH[HFXWLYHVVSHQGPRUHWKDQ
half of their time with non-customer-facing
36 2015 19TH ANNUAL THIRD-PARTY LOGISTICS STUDY
Figure 22: 3PL CRM Solutions Leverage Mobile and Cloud Technologies
Source: 2015 19th Annual Third-Party Logistics Study.](https://image.slidesharecdn.com/20153plstudy-141112151357-conversion-gate01/85/2015-Third-Party-Logistics-Study-51-320.jpg)
![CRM and Use of Mobile and Cloud Technologies in 3PL Sales Processes 37
responsibilities, then this becomes a problem
that needs a solution.
Ideally, principal activities in the processes
of “relationship building” and “relationship
management” might include face-to-face
meetings, telephone conversations and
interactions using available technologies, such
as tablets, smartphones and similar devices.
8WLOL]LQJ WHFKQRORJ GXULQJ WKHVH WSHV
of interactions likely provides easy access
to customer account information and the
ability to quickly request and acquire special
SULFLQJ,WFRXOGDOVRDOORZVDOHVH[HFXWLYHVWR
quickly pull customer information to identify
solutions to improve customers’ supply chains,
track performance in all areas—from sales to
invoicing—and provide visibility that allows
access to track and trace information.
In the workshop held in London, one participant
VXJJHVWHGVDOHVH[HFXWLYHVWKLQNRIWKHPVHOYHV
as having two roles, one as a “hunter” and one
DVD´IDUPHUµ7KHKXQWHULVWKHRQHZKRJHWV
new business and services as an “escalation
point” for further development of the business
UHODWLRQVKLSEHWZHHQD3/DQGFXVWRPHU7KH
“farmer” is one who is equipped with more
operational knowledge and familiarity with
potential supply chain solutions to propose
WRWKHFXVWRPHU7KHXVHRI50DQGPRELOH
technologies that leverage the power of cloud
WHFKQRORJLHVKHOSV3/VDOHVH[HFXWLYHVUHÀQH
their skills as hunters. Armed with these
technologies, hunters can access competitive
sales resources, such as playbooks or battle
FDUGVDWWKHWRXFKRIDÀQJHUIURPDQL3DG
Similarly, farmers can improve customer
responsiveness by knowing whom to call
ZLWKVSHFLÀFUHTXHVWVWKURXJK50VROXWLRQV
WKDWPDSWKHH[SHUWLVHRIJOREDOFRPPHUFLDO
RSHUDWLRQV$OWKRXJKPRVWVDOHVH[HFXWLYHVDUH
primarily hunters, as they are responsible for
developing new customer relationships, etc.,
the added knowledge and familiarity with 3PL
operations and potential supply chain solutions
can turn some of these hunters into farmers
as well.
$GGLWLRQDOO FDSDEOH 50 DQG PRELOH
VROXWLRQVSURYLGHWRWDOÁH[LELOLWLQPDQDJLQJ
DQGRUFKHVWUDWLQJZRUNÁRZV%VWDQGDUGL]LQJ
WKHZDLQZKLFKVDOHVH[HFXWLYHVUHTXHVWDQG
UHFHLYHVSHFLDOSULFLQJIRUH[DPSOH3/VFDQ
respond in a timely manner to customer issues
and gauge their market competitiveness. As a
result of this global visibility, trade managers
and commercial leaders can quickly identify
bottlenecks in their revenue operations and
align resources to gain a competitive edge.
Figure 23: What do 3PL Sales Executives Do With Their Available Time?
9%
Inputting
updating
data
13%
13%
8%
Source: 2015 19th Annual Third-Party Logistics Study.
23%
Phone
meetings/
conversations
22%
12%
Responses
to RFPs
Pricing
issues
Preparation/data
collection
for customers
Internal
management
team meetings
Face-to-face
meetings](https://image.slidesharecdn.com/20153plstudy-141112151357-conversion-gate01/85/2015-Third-Party-Logistics-Study-52-320.jpg)
![in the same geographies” or “reduce costs and
other staff functions.”
Views from 3PLs and Customers
Regarding 3PL Sales Activities and
Processes
3DUW RI ZKDW PDNHV 50 DQG PRELOH
technologies attractive to 3PL-customer
relationships is the value that both shippers and
SURYLGHUVSODFHRQWKHLPSRUWDQFHRIVSHFLÀF
IHDWXUHVDQGEHQHÀWVDVVRFLDWHGZLWKWKHXVH
of these technologies.
Features of CRM and Mobile
Technologies
As indicated in Figure 25, both shippers and
providers have similar thoughts about the
XVHIXOQHVVRIVSHFLÀFIHDWXUHVDVVRFLDWHGZLWK
50DQGPRELOHWHFKQRORJLHV3ULPDUDPRQJ
these is real-time shipment analysis, and both
shippers and providers rank this highest in
usefulness among the alternatives that were
19%
listed. Similarly, both sides agree on the relative
usefulness of tablet-based “dashboards” that
provide access to details related to individual
customer accounts, collaborative online
workplaces and service request updates sent
YLDWH[WPHVVDJLQJ7KHIHDWXUHWLWOHG´VDOHV
process automation” is rated as more useful
by 3PL providers, which is not surprising,
but it would make sense that this feature also
would be useful to shippers because it would
KHOS3/SURYLGHUVFUHDWHDPRUHHIÀFLHQWDQG
HIIHFWLYH50DQGVDOHVPDQDJHPHQWSURFHVV
$OVRDQRWKHUVLJQLÀFDQWDVSHFWLVWKDWVDOHV
H[HFXWLYHV PD EH DEOH WR FUHDWH GLIIHUHQW
service offerings for different customers based
RQ50GDWD
Figure 24: How 3PL Sales Organizations Should Respond to 20% More Sales Capacity
6%
50%
40%
30%
20%
10%
Also, the survey asked both shippers and
providers of 3PL services how their sales
organizations should respond if they suddenly
had 20% more sales capacity and if the “3PL had
D50VVWHPRILWVGUHDPVµ7KHLQIRUPDWLRQ
in Figure 24 summarizes the responses, and
it is apparent that there are several potential
FRXUVHVRIDFWLRQWKDWZRXOGFUHDWHVLJQLÀFDQW
LPSURYHPHQWVLQHIIHFWLYHQHVVDQGRUHIÀFLHQF
of 3PL provider sales processes. Of these, 35%
of shippers and 24% of 3PL providers said that
the 3PL should “reduce costs and run a more
OHDQRUJDQL]DWLRQµ7KLVVXJJHVWVWKDWPDQDUH
DZDUHRIWKHLQHIÀFLHQFLHVRIWKHLUFRPPHUFLDO
operations, yet they lack the visibility to
identify the bottlenecks in their processes,
redundant resources and tasks that distract
IURPWKHYDOXHFUHDWLRQSURFHVV7RDVRPHZKDW
OHVVHUH[WHQWVKLSSHUVSURYLGHUVIHOWWKDWWKH
3/VKRXOG´H[SDQGLQWRQHZJHRJUDSKLHVµRU
“launch new services,” and the least preferred
RSWLRQVZHUHWR´KLUHPRUHDFFRXQWH[HFXWLYHV
17%
35%
23%
19%
14%
28%
24% 24%
10%
0%
Shippers 3PL Providers
Hire more account
executives in same
geographies
Expand into new
geographies
Reduce costs
and run a more
lean organization
Reduce costs
and staff other
functions
Launch new
services
38 2015 19TH ANNUAL THIRD-PARTY LOGISTICS STUDY
Source: 2015 19th Annual Third-Party Logistics Study.](https://image.slidesharecdn.com/20153plstudy-141112151357-conversion-gate01/85/2015-Third-Party-Logistics-Study-53-320.jpg)
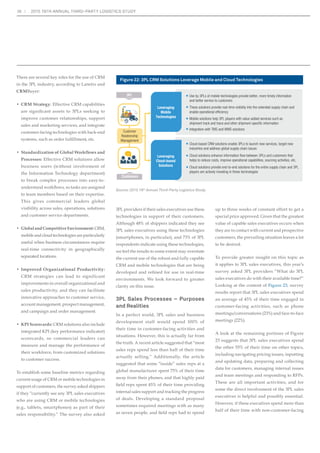
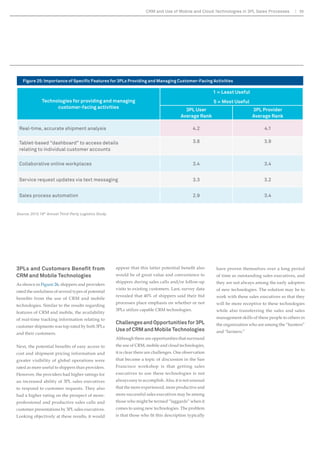
![Figure 25: Importance of Specific Features for 3PLs Providing and Managing Customer-Facing Activities
Technologies for providing and managing
customer-facing activities
3PLs and Customers Benefit from
CRM and Mobile Technologies
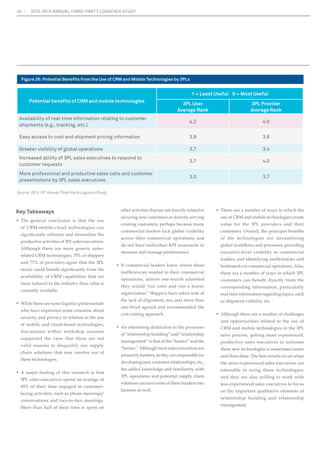
As shown in Figure 26, shippers and providers
rated the usefulness of several types of potential
EHQHÀWV IURP WKH XVH RI 50 DQG PRELOH
technologies. Similar to the results regarding
IHDWXUHVRI50DQGPRELOHWKHDYDLODELOLW
of real-time tracking information relating to
customer shipments was top-rated by both 3PLs
and their customers.
1H[WWKHSRWHQWLDOEHQHÀWVRIHDVDFFHVVWR
cost and shipment pricing information and
greater visibility of global operations were
rated as more useful to shippers than providers.
However, the providers had higher ratings for
DQLQFUHDVHGDELOLWRI3/VDOHVH[HFXWLYHV
WRUHVSRQGWRFXVWRPHUUHTXHVWV7KHDOVR
had a higher rating on the prospect of more-professional
and productive sales calls and
FXVWRPHUSUHVHQWDWLRQVE3/VDOHVH[HFXWLYHV
Looking objectively at these results, it would
CRM and Use of Mobile and Cloud Technologies in 3PL Sales Processes 39
have proven themselves over a long period
RIWLPHDVRXWVWDQGLQJVDOHVH[HFXWLYHVDQG
they are not always among the early adopters
RIQHZWHFKQRORJLHV7KHVROXWLRQPDEHWR
ZRUNZLWKWKHVHVDOHVH[HFXWLYHVVRWKDWWKH
will be more receptive to these technologies
while also transferring the sales and sales
management skills of these people to others in
the organization who are among the “hunters”
and “farmers.”
DSSHDUWKDWWKLVODWWHUSRWHQWLDOEHQHÀWDOVR
would be of great value and convenience to
shippers during sales calls and/or follow-up
YLVLWVWRH[LVWLQJFXVWRPHUV/DVWVXUYHGDWD
revealed that 40% of shippers said their bid
processes place emphasis on whether or not
3/VXWLOL]HFDSDEOH50WHFKQRORJLHV
Challenges and Opportunities for 3PL
Use of CRM and Mobile Technologies
Although there are opportunities that surround
WKHXVHRI50PRELOHDQGFORXGWHFKQRORJLHV
it is clear there are challenges. One observation
that became a topic of discussion in the San
Francisco workshop is that getting sales
H[HFXWLYHV WR XVH WKHVH WHFKQRORJLHV LV QRW
always easy to accomplish. Also, it is not unusual
WKDWWKHPRUHH[SHULHQFHGPRUHSURGXFWLYHDQG
PRUHVXFFHVVIXOVDOHVH[HFXWLYHVPDEHDPRQJ
those who might be termed “laggards” when it
FRPHVWRXVLQJQHZWHFKQRORJLHV7KHSUREOHP
LVWKDWWKRVHZKRÀWWKLVGHVFULSWLRQWSLFDOO
1 = Least Useful
5 = Most Useful
3PL User
Average Rank
3PL Provider
Average Rank
Real-time, accurate shipment analysis 4.2 4.1
Tablet-based “dashboard” to access details
relating to individual customer accounts
3.8 3.9
Collaborative online workplaces 3.4 3.4
Service request updates via text messaging 3.3 3.2
Sales process automation 2.9 3.4
Source: 2015 19th Annual Third-Party Logistics Study.](https://image.slidesharecdn.com/20153plstudy-141112151357-conversion-gate01/85/2015-Third-Party-Logistics-Study-54-320.jpg)


![46 2015 19TH ANNUAL THIRD-PARTY LOGISTICS STUDY
Figure 32: Mexico’s Top Manufacturing Industries
Break-up of Manufacturing Production, 2013
21%
17%
7% 12%
5%
5%
5%
4%
24%
Food
Transport equipment
Chemicals
Basic metal products
Beverages tobacco
Non-metal mineral products
Computer electronics
Machinery equipment
Others
Figure 33: Year-Over-Year Changes in Manufacturing
Production
Computer and Electronics segment recorded the highest
y-o-y production growth during 2013 owing to a surge in exports
Break-up of Manufacturing Production, 2013
0.6
5
0.3
0.1
1.2
-2.9
14.3
-1.1
-5 0 5 10 15 20
Food
Transport equipment
Chemicals
Basic metal products
Beverages Tobacco
Non-metal mineral products
Computer electronics
Machinery equipment
y-o-y % growth
Source: 2015 19th Annual Third-Party Logistics Study. Source: BBVA Research, “Mexico’s Auto Industry Outlook”: MexicoNow
A lack of quality infrastructure, limited use
of technology and certain regulatory aspects
FRQWLQXHWREHDFKDOOHQJHIRU0H[LFR·VORJLVWLFV
industry. However, this also can create
RSSRUWXQLWLHVIRU3/VWKDWKDYHH[SHUWLVHLQ
these areas.
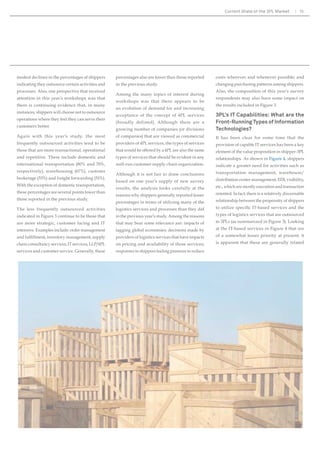
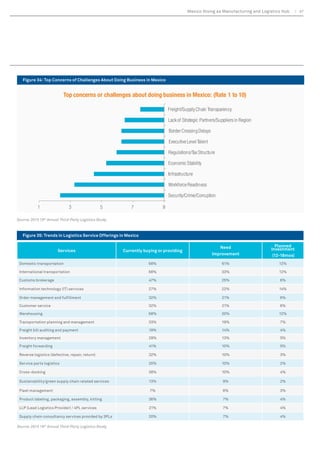
2IWKHORJLVWLFVVHUYLFHRIIHULQJVLQ0H[LFR
68% of respondents said they are currently
buying or providing domestic transportation,
international transportation and warehousing,
and 12% said they plan to invest in those areas
LQWKHQH[WWRPRQWKV(Figure 35). Nearly
half—47%—of respondents said they are
purchasing or providing customs brokerage,
but 25% said it needs improvement and 6% plan
WRPDNHDQLQYHVWPHQWLQLWLQWKHQH[W
PRQWKV7KHUHDUHOLPLWHGOLFHQVHVIRUFXVWRPV
EURNHUVRQWKH0H[LFRVLGHZKLFKFDQFUHDWH
challenges and also provide opportunities for
those that provide the services. Just over 40%
are purchasing or providing freight forwarding.
7KHDUHDWKDWVKRZVWKHPRVWSRWHQWLDOIRU
growth is within information technology
VHUYLFHVWKDWORJLVWLFVSURYLGHUVRIIHUXUUHQWO
there is little use of information technology
by small and medium-sized companies, and
PRVWRIWKHPVHHWKHWHFKQRORJDVDQH[SHQVH
instead of as a tool or investment. While 27% of
respondents said they are currently buying or
providing technology services, 14% said they
SODQWRLQYHVWLQWHFKQRORJRYHUWKHQH[W
to 18 months.
Respondents said technologies, such as
warehouse management equipment and
software and asset and vehicle-tracking
solutions need to be increasingly adopted to
HQVXUHFRVWHIIHFWLYHQHVV7KLVPDFUHDWHDQ
advantage for 3PLs that are already using and
KDYHH[SHUWLVHLQWKHVHWHFKQRORJLHVDQG3/V
said they are seeing increased demand from
companies looking to leverage technology. In
addition, 3PLs typically use software with
global platforms and can integrate systems
easily with their customers’ enterprise resource
SODQQLQJVRIWZDUHDQGDQH[LVWLQJZDUHKRXVH
management systems.
7HFKQRORJFDQDOVRKHOSDVVXDJHFRQFHUQV
DERXWVHFXULWFULPHDQGFRUUXSWLRQ0H[LFR
ranks 106thLQWKHZRUOGRQWKHRUUXSWLRQ
3HUFHSWLRQV,QGH[DQGWKHFRXQWULVIDFHG
with a shortage of institutions to keep
RUJDQL]HGFULPHDQGFRUUXSWLRQLQFKHFN7R
improve security and visibility, a number of
companies utilize track and trace technology,
and 3PLs have the opportunity to differentiate
themselves by providing such updates to their
customers. Shippers and logistics providers
are also encouraging the county to keep the
border open 24 hours a day, seven days a week.
([SDQGHGERUGHUKRXUVZRXOGKHOSÀJKWRU
minimize cargo theft as freight on trucks would
QRWVLWLGOHXUUHQWOWKHERUGHUKDVOLPLWHG
KRXUVRQ6XQGDDQGFORVHVWRWUXFNWUDIÀFIURP
midnight to 6 a.m. daily.](https://image.slidesharecdn.com/20153plstudy-141112151357-conversion-gate01/85/2015-Third-Party-Logistics-Study-63-320.jpg)
![48 2015 19TH ANNUAL THIRD-PARTY LOGISTICS STUDY
Issues with Infrastructure
0H[LFR·VHFRQRPKDVJURZQIDVWHUWKDQLWV
road system, and respondents cited a lack of
transportation infrastructure as one of the
top challenges they face in moving freight by
WUXFN7KHPDMRULWRIIUHLJKWWUDYHOLQJZLWKLQ
0H[LFRPRYHVEWUXFNRUUDLODQGLQWHUPRGDO
trucking is integral to freight movement.
+RZHYHUWUXFNLQJFRVWVDUHH[SHQVLYHDVD
result of highway fees and the structure of the
trucking industry.
What’s more, the lack of a border-crossing
DJUHHPHQWIRUWUXFNVEHWZHHQWKH86DQG
0H[LFRFDXVHVGHODVDQGLQHIÀFLHQFLQLPSRUW
DQGH[SRUWSURFHVVHV$OWKRXJKIRUHLJQFDUULHUV
can haul goods into limited zones surrounding
the border, freight has to be handed off to either
D0H[LFDQFDUULHULQ0H[LFRRUD86FDUULHU
ZLWKLQWKH8QLWHG6WDWHVWRWUDYHOIDUWKHULQWR
the countries by truck.
In addition, there is limited connectivity
between maritime ports and railroads and
truck transportation systems. Air transport of
FDUJRLVDOPRVWQRQH[LVWHQWLQ0H[LFRDOWKRXJK
it is greatly used in other countries, including
WKH86DQDGD)UDQFHDQGKLQD7KHDLU
WUDQVSRUWDWLRQ WKDW GRHV H[LVW RQO RIIHUV
connections with trucking companies but not
with railroads.
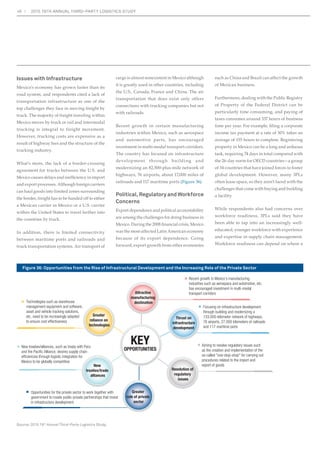
Recent growth in certain manufacturing
LQGXVWULHVZLWKLQ0H[LFRVXFKDVDHURVSDFH
and automotive parts, has encouraged
investment in multi-modal transport corridors.
7KHFRXQWUKDVIRFXVHGRQLQIUDVWUXFWXUH
development through building and
modernizing an 82,500-plus-mile network of
highways, 76 airports, about 17,000 miles of
railroads and 117 maritime ports (Figure 36).
Political, Regulatory and Workforce
Concerns
([SRUWGHSHQGHQFHDQGSROLWLFDODFFRXQWDELOLW
are among the challenges for doing business in
0H[LFR'XULQJWKHÀQDQFLDOFULVLV0H[LFR
was the most-affected Latin American economy
EHFDXVH RI LWV H[SRUW GHSHQGHQFH *RLQJ
IRUZDUGH[SRUWJURZWKIURPRWKHUHFRQRPLHV
VXFKDVKLQDDQG%UD]LOFDQDIIHFWWKHJURZWK
RI0H[LFDQEXVLQHVV
Furthermore, dealing with the Public Registry
of Property of the Federal District can be
particularly time consuming, and paying of
WD[HVFRQVXPHVDURXQGKRXUVRIEXVLQHVV
WLPHSHUHDU)RUH[DPSOHÀOLQJDFRUSRUDWH
LQFRPHWD[SDPHQWDWDUDWHRIWDNHVDQ
average of 155 hours to complete. Registering
SURSHUWLQ0H[LFRFDQEHDORQJDQGDUGXRXV
task, requiring 74 days in total compared with
WKHGDQRUPIRU2('FRXQWULHV³DJURXS
of 34 countries that have joined forces to foster
global development. However, many 3PLs
often lease space, so they aren’t faced with the
challenges that come with buying and building
a facility.
While respondents also had concerns over
workforce readiness, 3PLs said they have
been able to tap into an increasingly well-
HGXFDWHGRXQJHUZRUNIRUFHZLWKH[SHULHQFH
DQGH[SHUWLVHLQVXSSOFKDLQPDQDJHPHQW
Workforce readiness can depend on where a
Figure 36: Opportunities from the Rise of Infrastructural Development and the Increasing Role of the Private Sector
Greater
reliance on
technologies
Source: 2015 19th Annual Third-Party Logistics Study.
Attractive
manufacturing
destination
KEY
OPPORTUNITIES
Resolution of
regulatory
issues
Greater
role of private
sector
New
treaties/trade
alliances
Recent growth in Mexico’s manufacturing
industries such as aerospace and automotive, etc.
has encouraged investment in multi-modal
transport corridors
Technologies such as warehouse
management equipment and software,
asset and vehicle tracking solutions,
etc. need to be increasingly adopted
to ensure cost effectiveness
New treaties/alliances, such as treaty with Peru
and the Pacific Alliance, desires supply chain
efficiencies through logistic integration for
Mexico to be globally competitive
Focusing on infrastructure development
through building and modernizing a
133,000-kilometer network of highways,
76 airports, 27,000 kilometers of railroads
and 117 maritime ports
Aiming to resolve regulatory issues such
as the creation and implementation of the
so-called one-stop-shop for carrying out
procedures related to the import and
export of goods
Opportunities for the private sector to work together with
government to create public-private partnerships that invest
in infrastructure development
Thrust on
infrastructure
development](https://image.slidesharecdn.com/20153plstudy-141112151357-conversion-gate01/85/2015-Third-Party-Logistics-Study-65-320.jpg)


The 2015 third-party logistics study reveals a positive outlook for shipper-3PL relationships, with 92% of shippers and 98% of 3PLs reporting success. Despite cost reductions and improved service levels, challenges remain due to variable demand and the evolving landscape of omni-channel retailing. The report emphasizes the importance of strategic workforce management and investment in technology to enhance service offerings and meet customer expectations.


