Downloaded 136 times
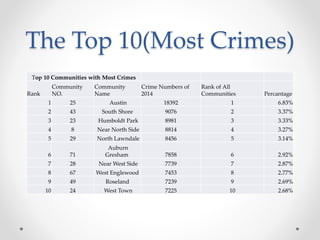
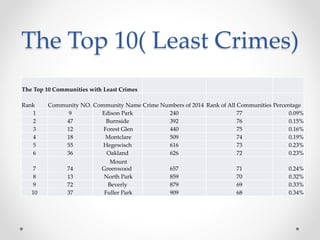
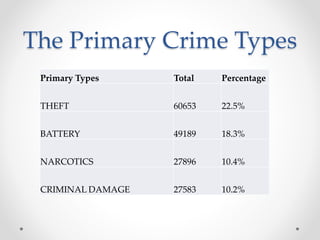
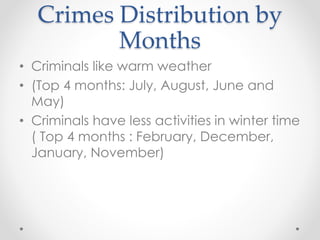
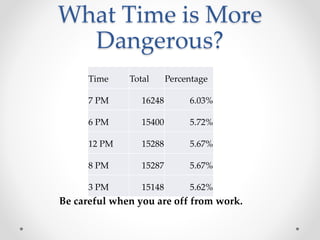


The document analyzes 2014 Chicago crime data, identifying Austin as the community with the highest crime rate and Edison Park with the lowest. Theft is the most prevalent crime type, while crime activity peaks during warmer months and in the evening hours. It concludes that personal safety measures are essential as complete reliance on police is unfeasible.


![제 23회 보아즈(BOAZ) 빅데이터 컨퍼런스 - [MBOAX] : ABSA를 활용한 소비자 반응 분석 기반 운영 효율화 대시보드 설계](https://cdn.slidesharecdn.com/ss_thumbnails/3-1boaz23rdconferencemboax-260203102709-9d519923-thumbnail.jpg?width=640&height=640&fit=bounds)