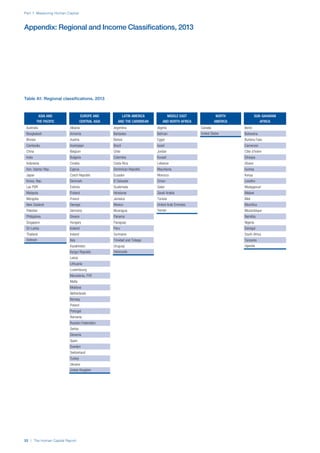
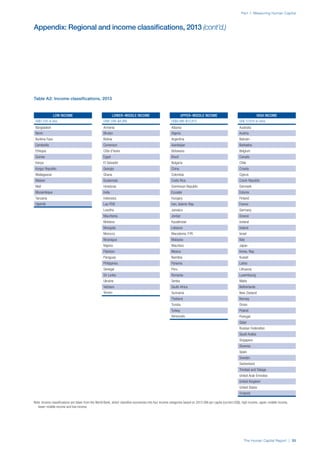
This document provides an overview of the Human Capital Index, which measures human capital development around the world. The index covers four pillars: health and wellness, education, workforce and employment, and an enabling environment. It uses 51 indicators to measure these pillars, capturing factors like education levels, health, employment rates, and the context in which human capital operates. The document explains the methodology and indicators used in the index and aims to provide a framework for benchmarking and discussing human capital across countries. It also introduces the country profiles included in Part 2 which provide more detailed analysis of human capital for each country.


![Part 1: Measuring Human Capital
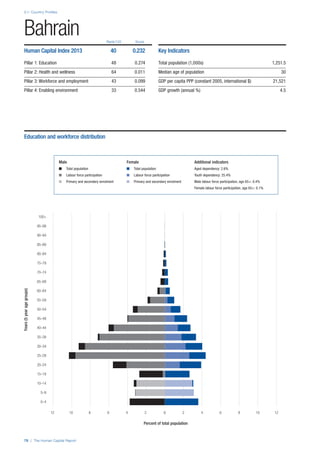
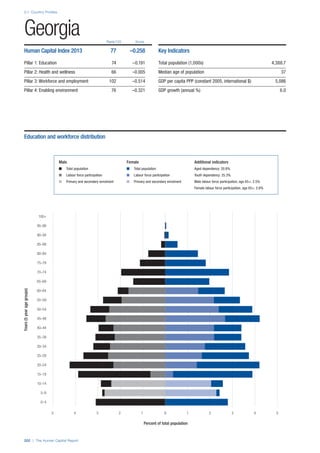
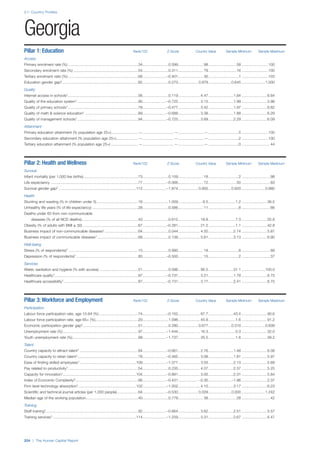
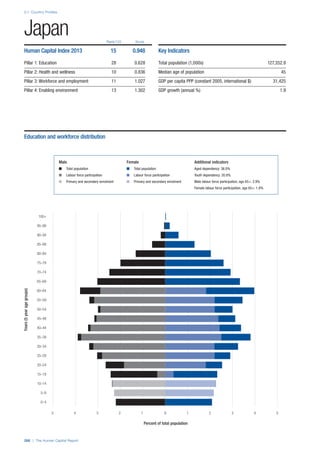
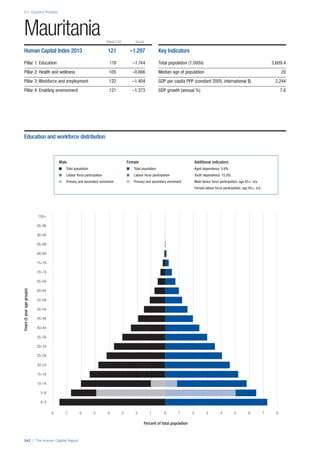
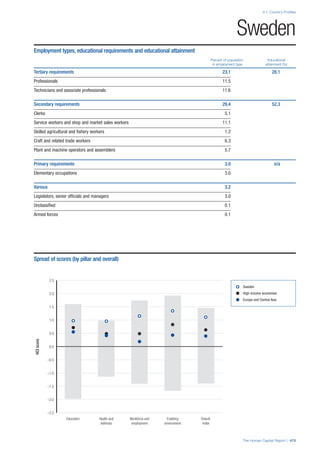
8 | The Human Capital Report
globally and with young people more than three times
more likely to be unemployed than adults, the ILO warns
of a “scarred generation” and that “youth unemployment
and underemployment impose heavy social and economic
costs, resulting in the loss of opportunities for economic
growth [...] and unutilized investment in education and
training.”8
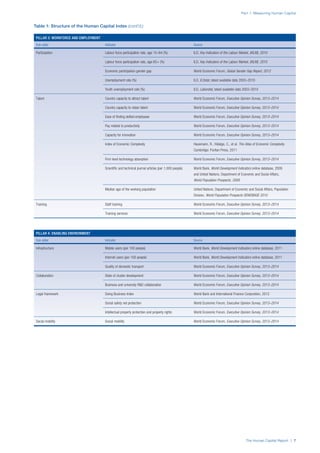
Talent
This sub–pillar contains several concepts to capture a
broad, aggregate measure of talent. First, it contains a
high–level measure of the average level of experience in
an economy in the form of the median age of the working
age population (15–64). Second, it integrates business
leaders’ assessment of their countries ability to attract
and retain talent, of their companies’ ability to find skilled
employees and of the existence of merit–based rewards for
employees. Third, it assesses whether the talent available
in a country leads to economic results in the form of
production, learning within firms, innovation and knowledge
generation, captured through the Index of Economic
Complexity—countries that make sophisticated products
must possess the skills and expertise to do so—two
survey variables on firm level technology absorption and
capacity for innovation, and the prevalence of scientific and
technical journal articles.
Training
Two quantitative indicators serve as a proxy for continued
training and learning. The extent of staff training indicator
measures the extent to which companies invest in training
and employee development and the training services
indicator measures the extent to which high–quality
specialized training services are available.
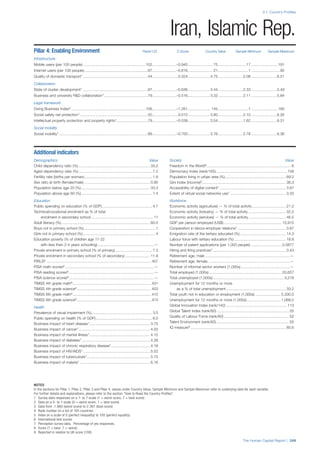
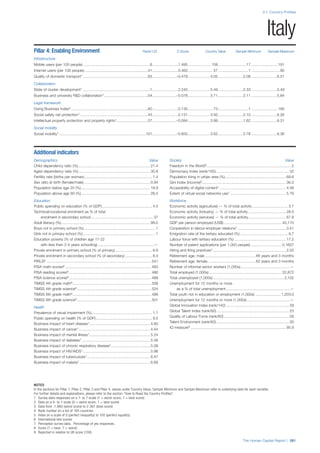
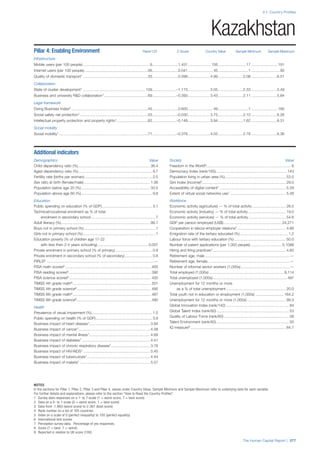
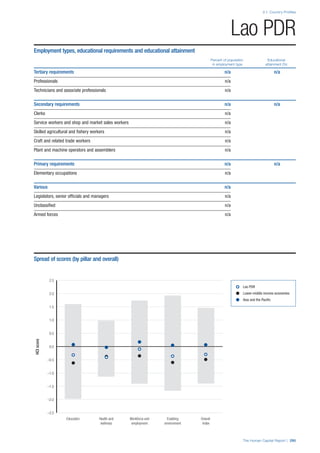
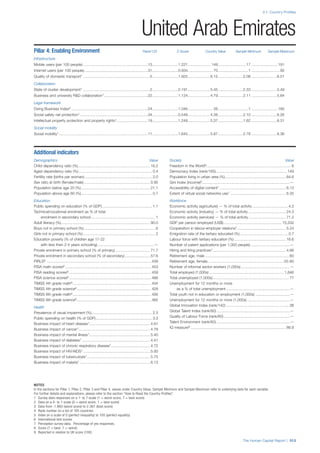
Enabling Environment
The indicators included in this pillar capture whether
human capital is deployed effectively or whether barriers in
the environment are preventing the effective use of human
capital, thereby negating the investments made in human
capital development.
Infrastructure
This sub–pillar looks at three basic aspects of physical
and communication infrastructure as facilitators of human
capital. Physical transport, which facilitates access to
workplaces and is critical to connecting industry and
communities together, is measured through a survey
indicator on the quality of domestic transport. The use
of ICT, such as mobile phones and the Internet, can also
accelerate communication and exchange across the
complex networks that underpin human capital growth.
These are captured through prevalence indicators for
mobile phones and Internet use, respectively.
Collaboration
Cross–industry and cross–sector learning facilitate
innovation, information exchange and the development of
human capital. These concepts are captured through two
survey indicators from the Executive Opinion Survey. We
include a measure of the extent to which universities and
industry collaborate on R&D. We also include a measure of
how prevalent are well–developed and deep clusters.
Legal framework
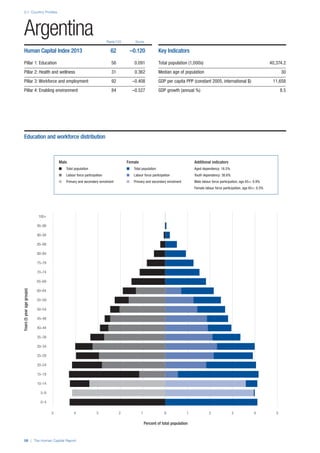
This sub–pillar looks at the legal environment within which
people are employed self–employed. In particular, we
include the ease of doing business in a country, using
the World Bank’s Doing Business Index, which looks at
how conducive the legal and regulatory environment is to
starting and operating a local business. The protection
of both physical property and intellectual property is
important from a human capital perspective as it protects
the knowledge—the intangible assets—of an individual
as well as the assets connected with that knowledge.
This is measured through a combination of two survey
variables. We also include in this sub–pillar social safety
net protection for its role in preserving skills and knowledge
and reducing the attrition on human capital.
Social mobility
Finally, we include a measure of rigid socio–cultural
practices that may thwart progress in human capital
development despite investments through policy
instruments. The opportunity for an individual to transcend
social strata may be a significant motivational factor for
investment in their own and their offspring’s human capital
development. Therefore in countries where status is
ascribed rather than achieved, the incentive for investing in
human capital is reduced.
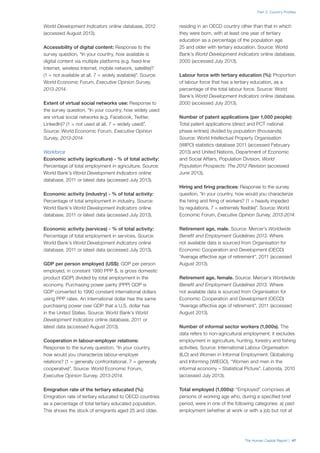
CONSTRUCTION OF THE INDEX
Standardizing data
The indicators used in the Index are measured on different
scales. To standardize the data, we used the z–score
statistic as it preserves the distribution of the data, a
feature most relevant for a comparative international
composite index.
Z–scores are expressed as standard deviations
from the mean. The mean is zero and has a standard
deviation of one. This means that all data points above
the mean are expressed as positive scores and all data
below the mean are expressed as negative scores. The
z–scores methodology is based on an assumption of the
normal distribution. A standard deviation of plus (minus) 1
represents the area 34.13% above (below) the mean (zero)
and a standard deviation of plus (minus) 2 represents the
area 47.72% above (below) the mean. The z–score of a
data point indicates the number of standard deviations
above or below the mean. So a z–score of –2 is exactly
two standard deviations, or 47.72%, below the mean.](https://image.slidesharecdn.com/201312wefhumancapitalreport2013-140702120247-phpapp02/85/201312-WEF-Human-Capital-Report-2013-16-320.jpg)


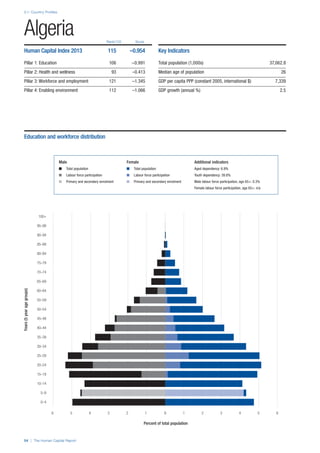
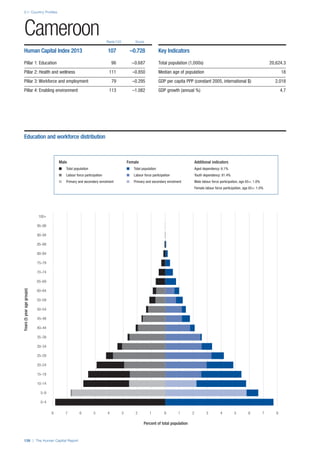
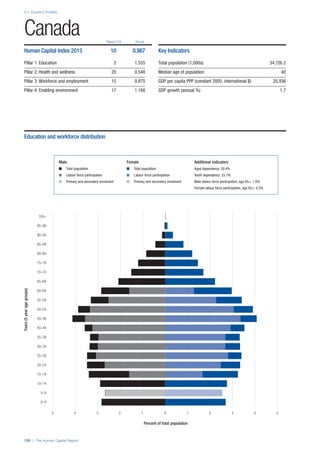
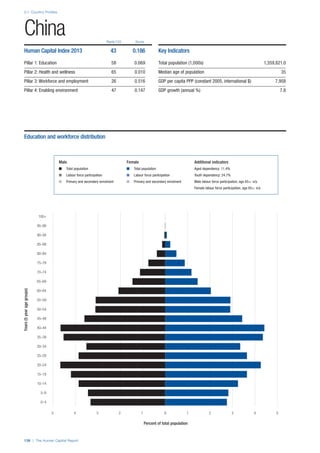
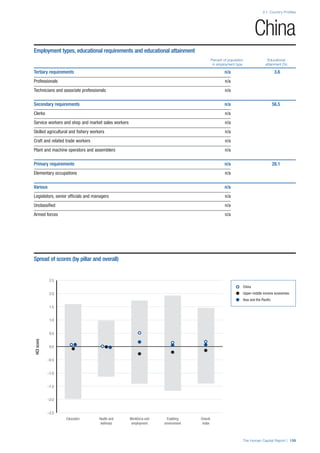
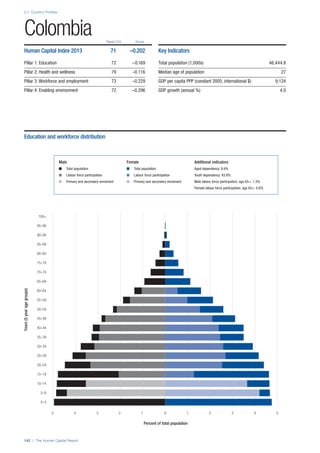
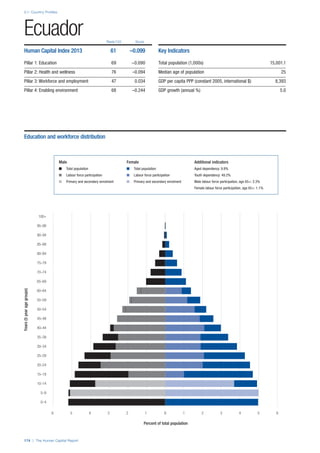
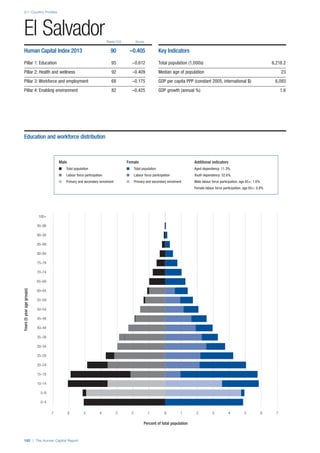
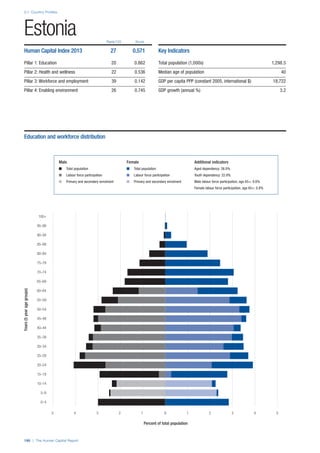
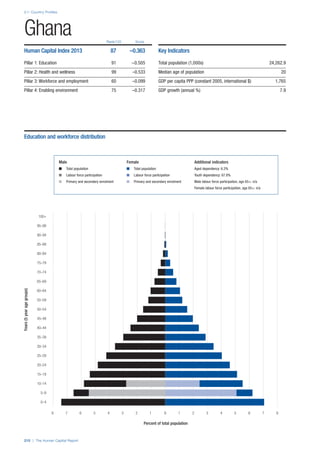
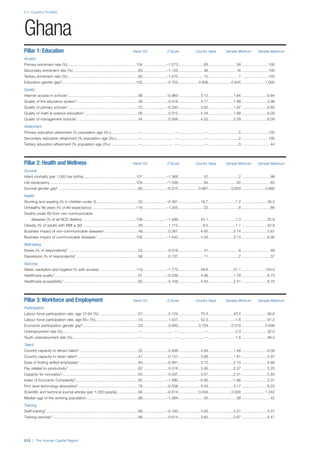
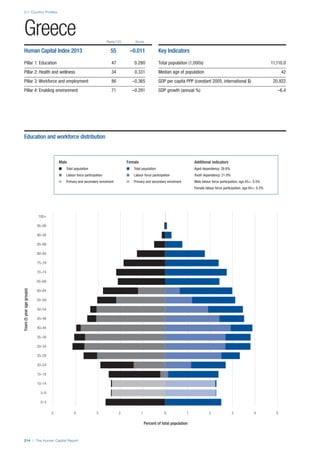
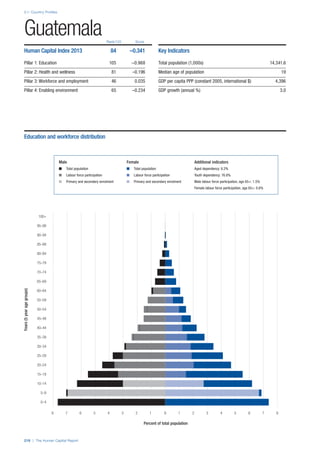
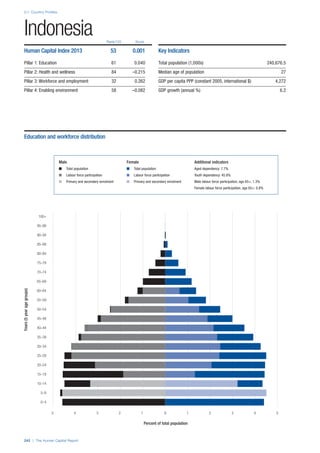
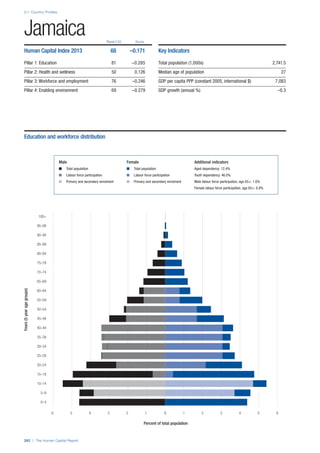
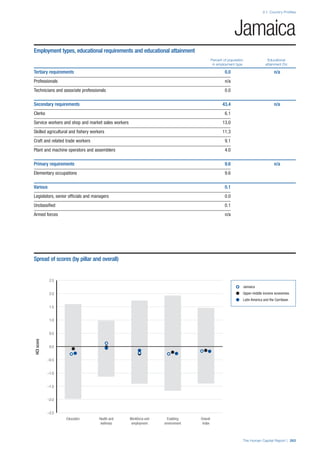
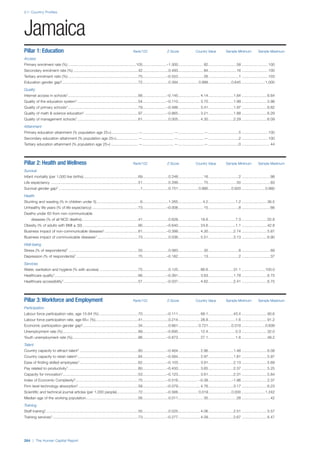
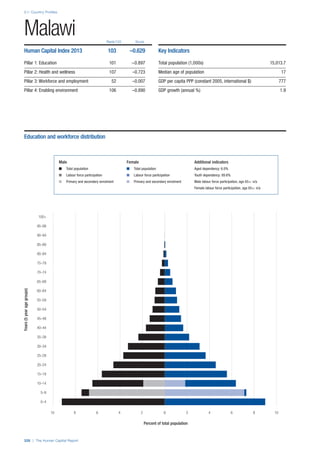
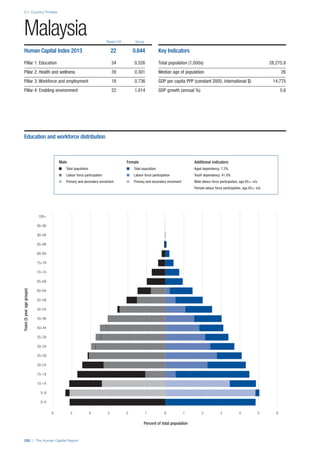
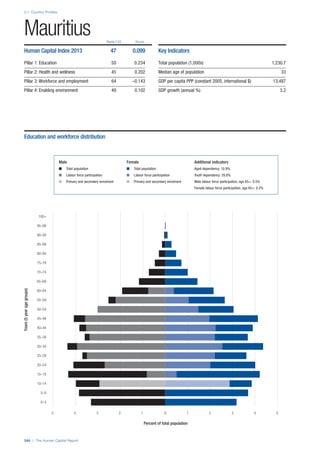
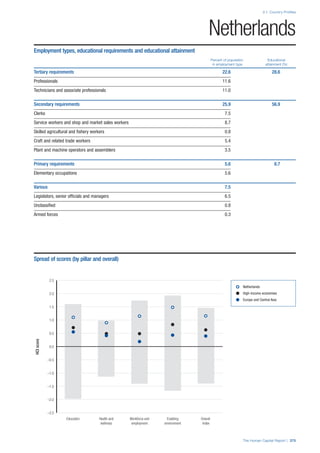
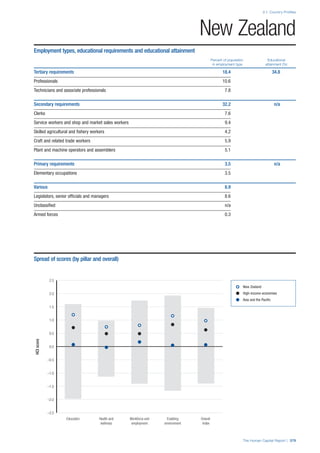
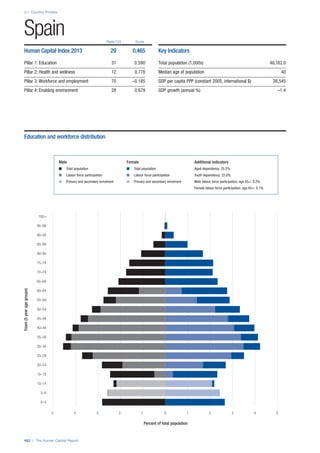
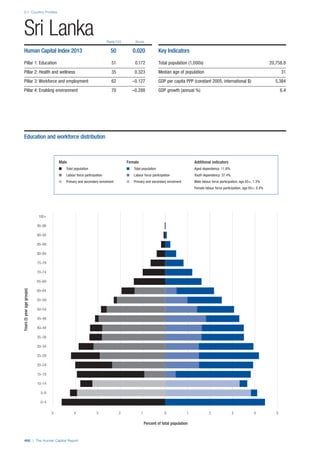
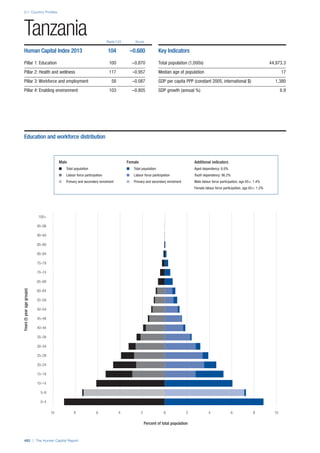
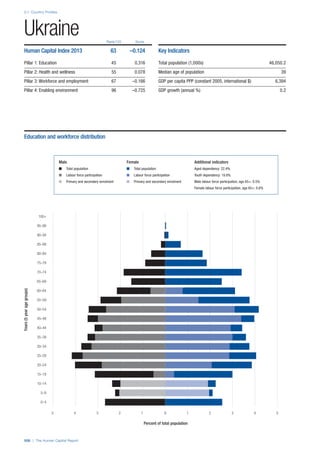
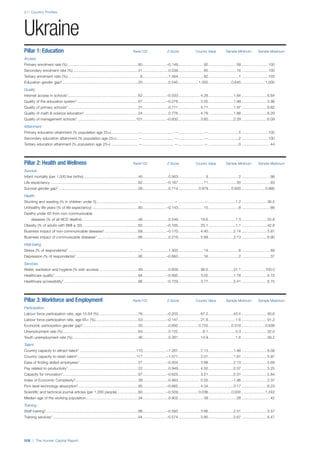
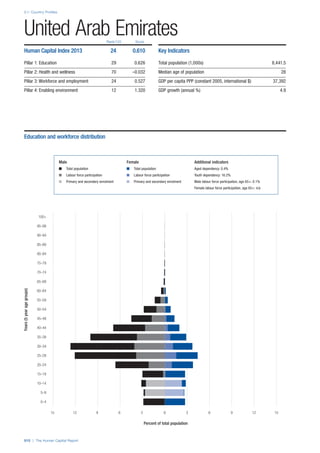
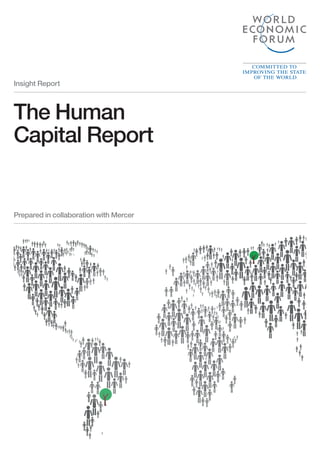
![Part 2: Country Profiles
The Human Capital Report | 39
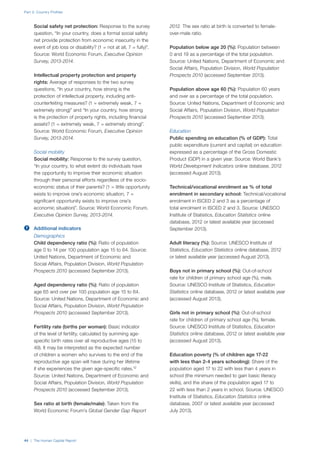
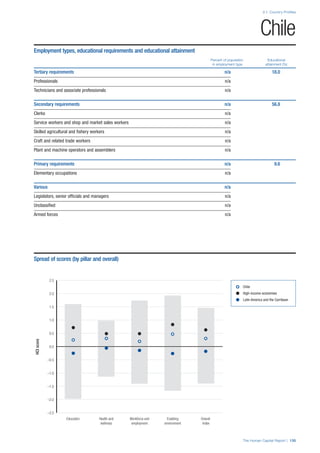
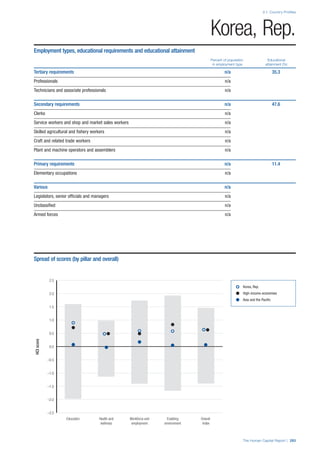
• For the purpose of inclusion in the County Profiles, we
have grouped together skills groups 3 and 4. The ILO
presents skills categories 3 and 4 separately, aligning
with ISCED levels 5 and 6 & 7 respectively. Note
that for ISCO-88, level 4 is not aligned with any skills
category.
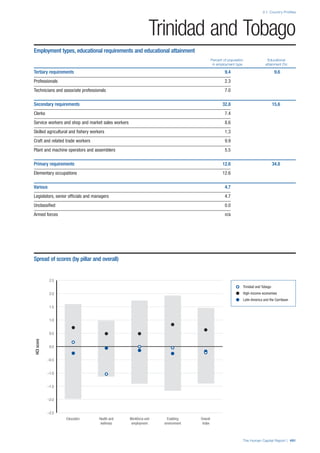
• Each employment type is listed under the relevant
education level, which is aligned with the skills
required to perform this type of job competently. Both
the Legislators, senior officials and managers and
the Armed forces groups, which cannot be aligned
with a specific education level, are reported under the
heading “Various”. Unclassified occupations, which
consist of those jobs that cannot be assigned to any
of the ten listed employment types, are also listed
under “Various”.
• Employment data is provided in thousands of jobs
and divided by the total population age 15 and over
(Source: United Nations, Department of Economic and
Social Affairs, Population Division, World Population
Prospects, 2010 [accessed September 2013] to
provide occupations held as a percentage of this
population. Numbers will not add up to 100 as the
data does not report the non-working population
and there are omissions in the data where the figures
straddle more than one category. Due to rounding,
some subtotals may not be the sum of the display.
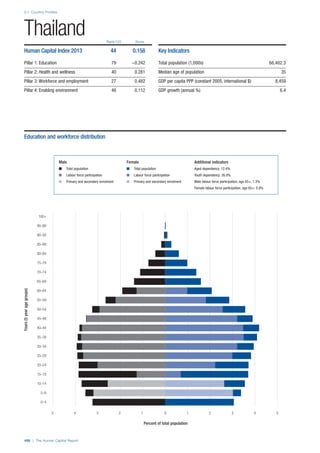
• Data in the “Educational attainment (%)” column
is sourced from UNESCO, Institute for Statistics,
Education Statistics online database, latest year
available (accessed August 2013). The data states the
maximum level of education that has been reached
among the population aged 25 and over and provides
this as a percentage of the total population aged
25 and over. This data and the data in the “Percent
of population in employment type” column are not
completely aligned with the data on employment
types, which is predominantly concerning the
population aged 15 and over. Some countries report
data for age groups other than 15 and over.
• In some instances, a country has reported data that is
split across several occupational groups. For example
data for the Legislators, senior officials and managers
employment type may be provided as a single figure
combined with data for the Professionals employment
type. As only the Professionals type is aligned with
a recognised skills-education classification, and we
cannot estimate the number to be attributed to either
grouping, then the data has been omitted. Therefore
a number of countries may have reported data that is
not included in the table.
• N/A is listed when a country does not report data for
occupation or for educational attainment.
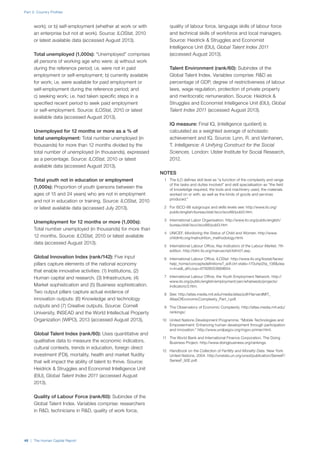
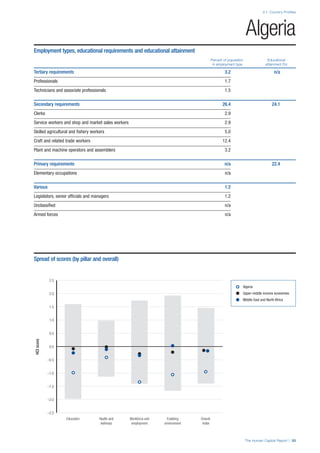
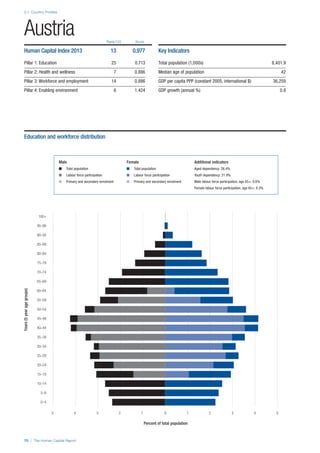
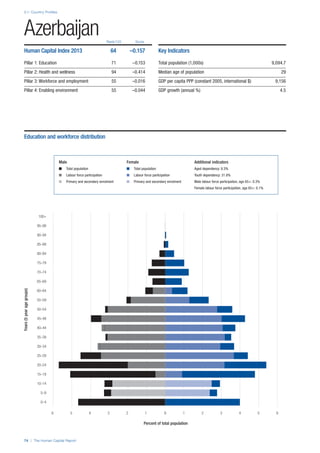
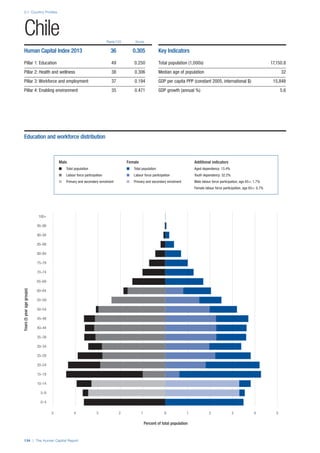
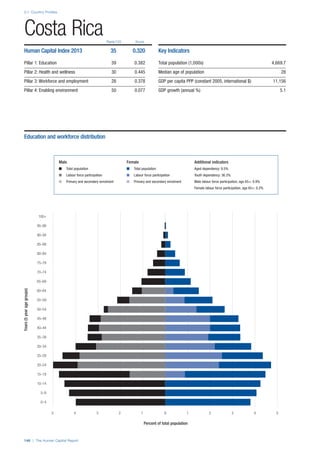
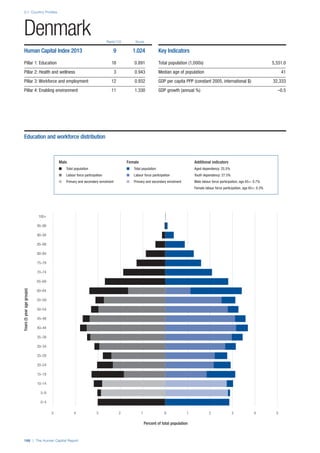
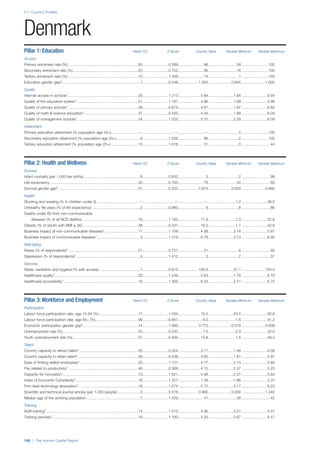
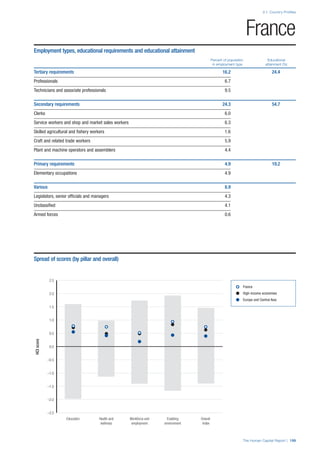
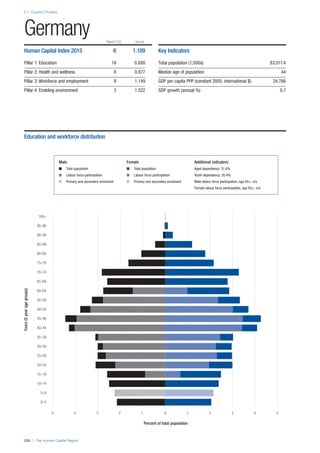
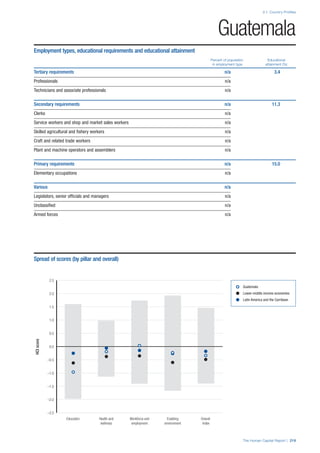
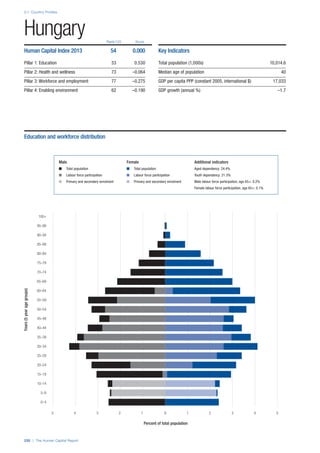
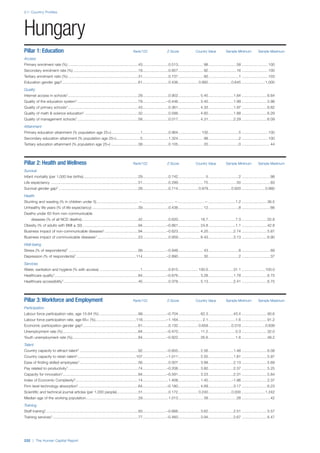
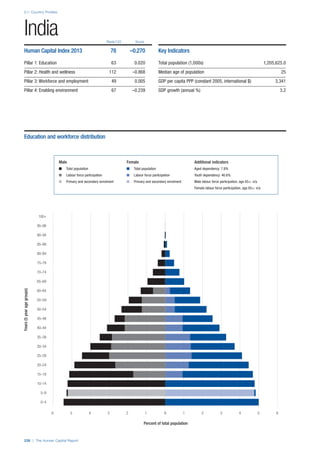
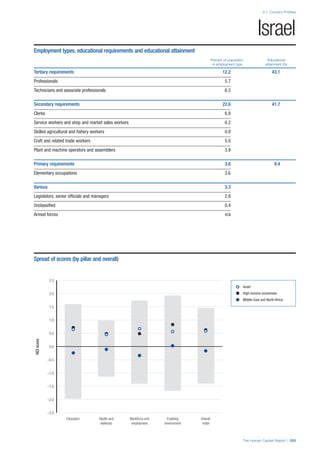
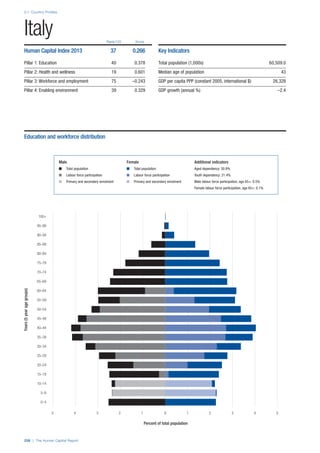
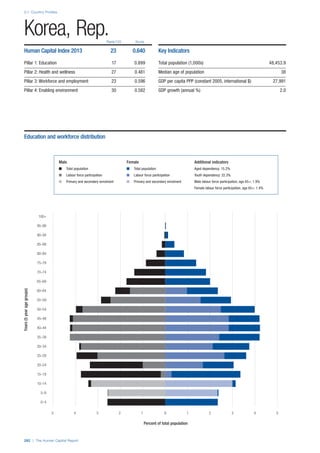
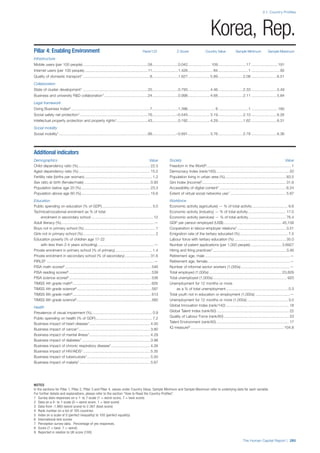
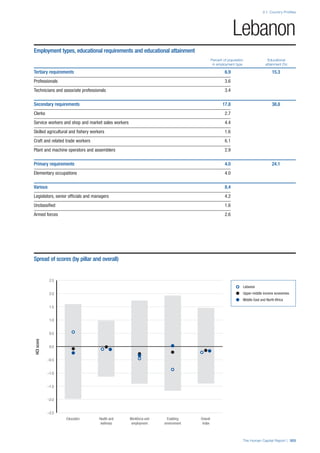
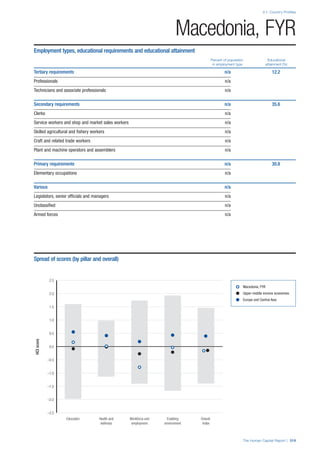
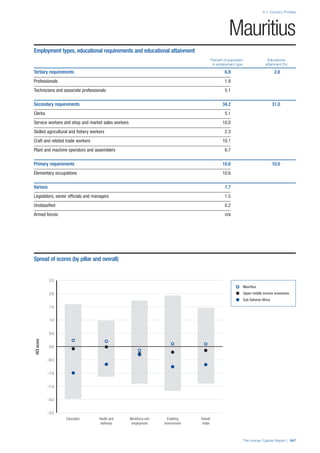
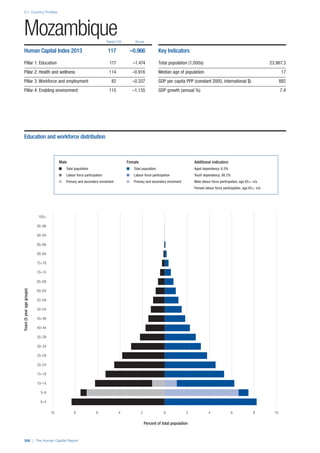
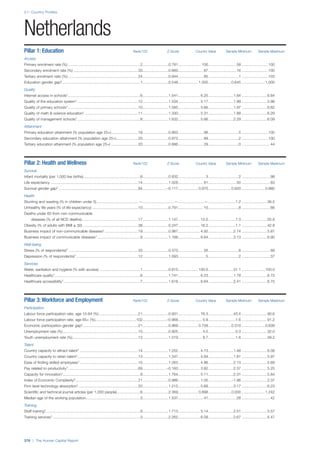
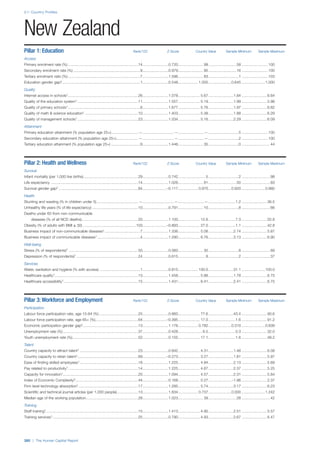
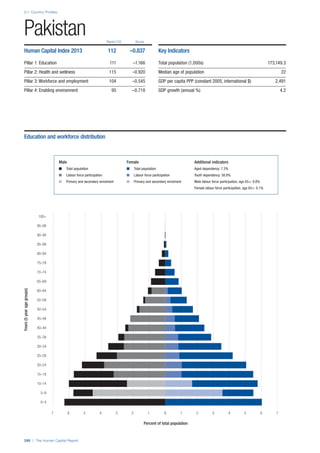
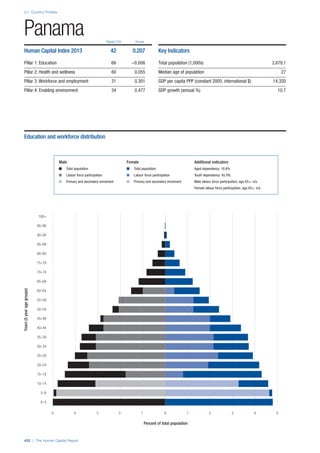
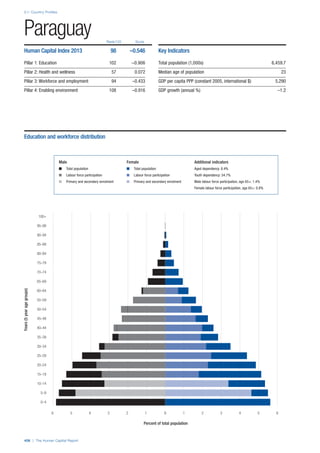
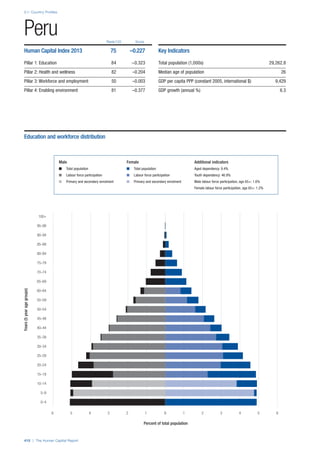
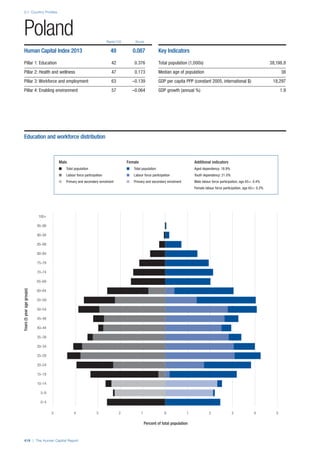
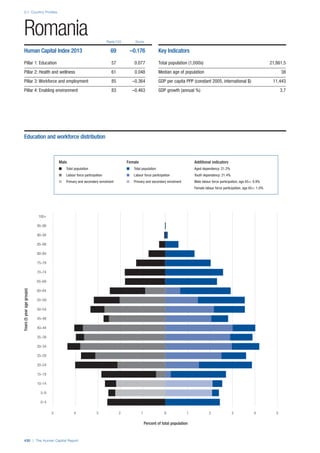
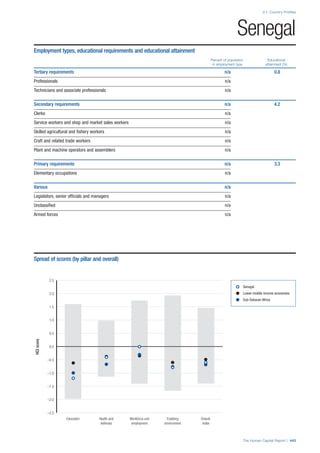
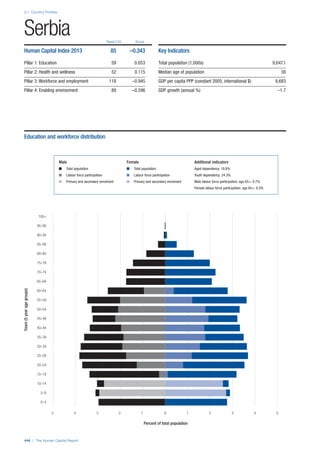
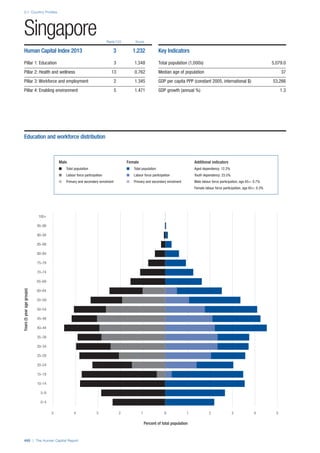
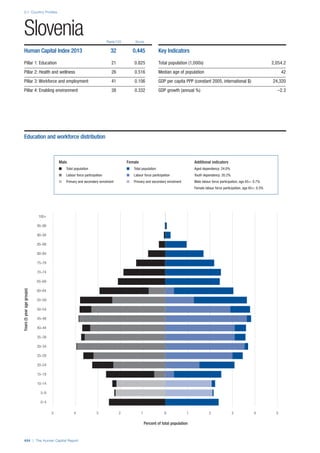
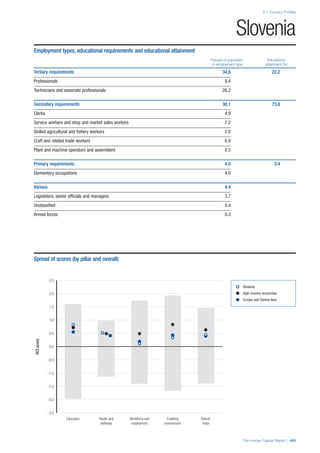
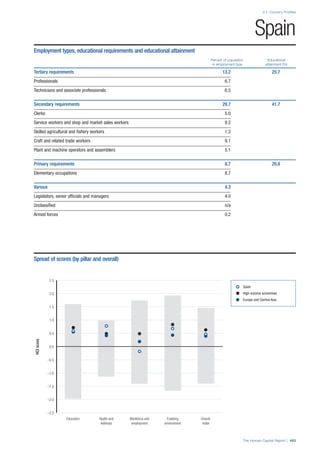
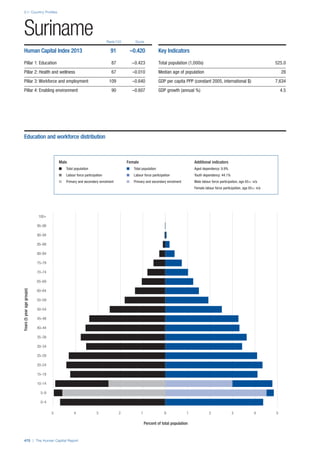
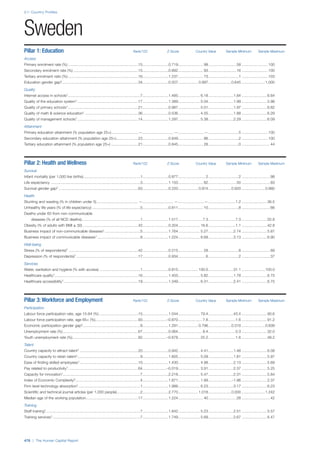
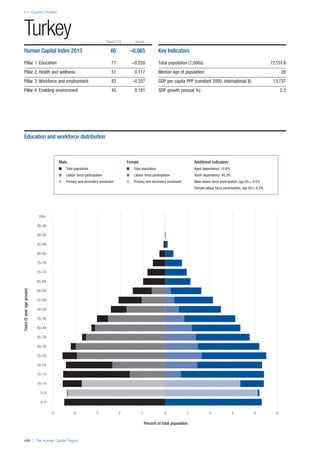
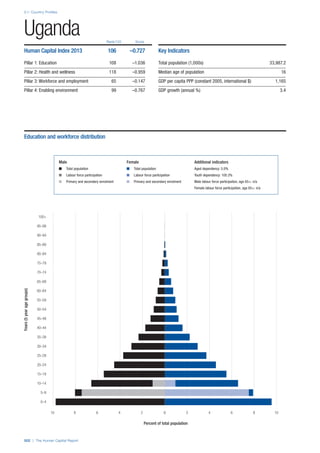
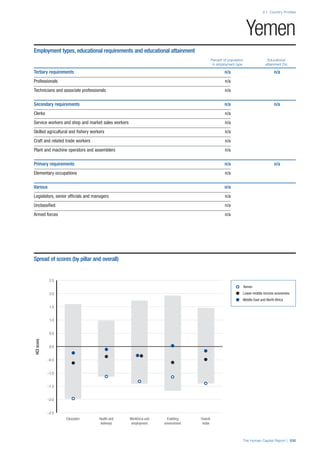
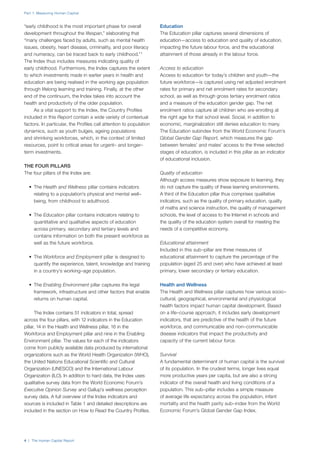
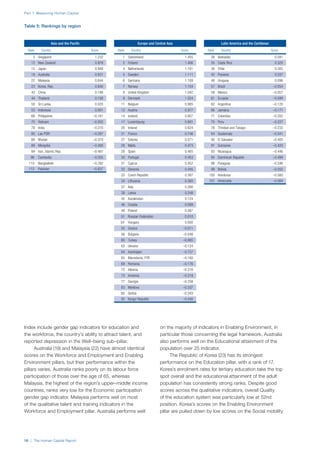
SPREAD OF SCORES BY PILLAR AND OVERALL
This section gives an overview of each country’s scores
for each of the four pillars and the overall Human Capital
Index, in relation to the scores of all other countries as well
as the geographic region and income sub-groups to which
the country belongs.
• The light grey bars represent the total spread of scores
across all 122 countries in the index. The top of the
grey bar indicates the pillar score of the top performing
country in that pillar from the entire sample. The
bottom limit of the grey bar indicates the pillar score of
the bottom performing country in that pillar.
• The vertical position of the white circle indicates where
the country lies in relation to all other countries in the
index. The higher the vertical position the better the
country’s performance in relation to other countries.
• The black circle represents the position of the average
of the country’s specific income group. Income
group classifications are detailed in Table A2 of the
Appendix.
• The blue circle represents the position of the average
of the country’s geographical group. Geographical
groups are detailed in Table A1 of the Appendix.
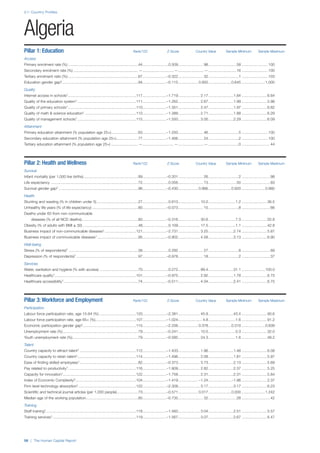
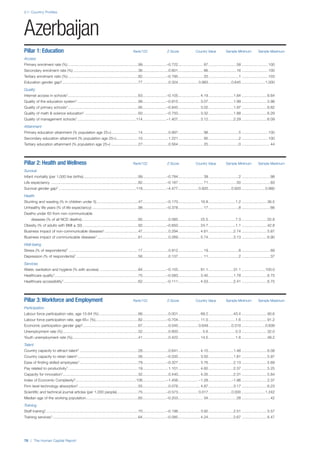
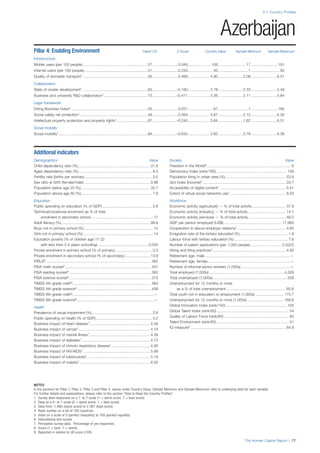
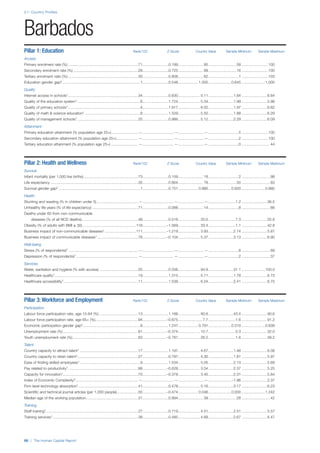
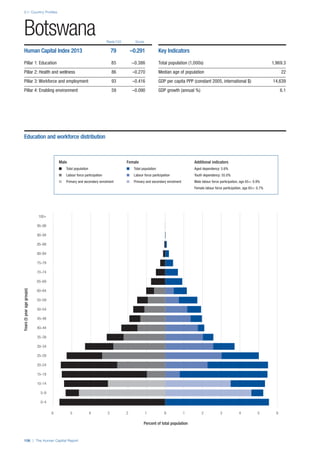
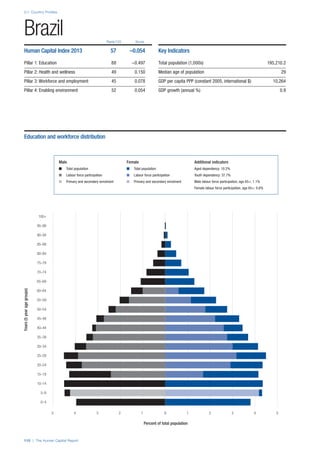
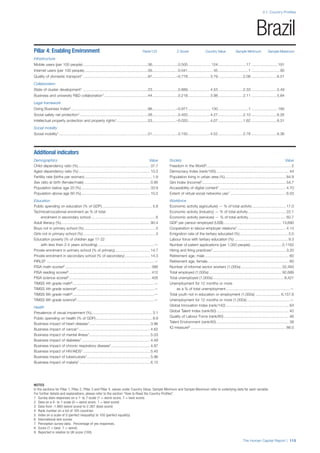
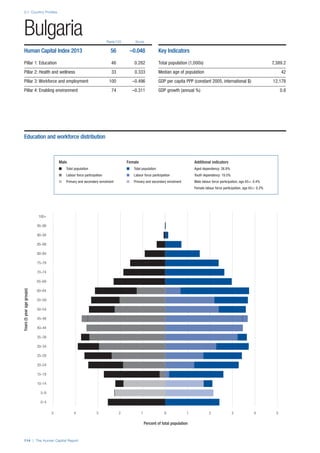
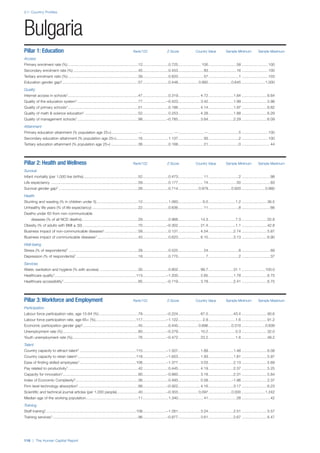
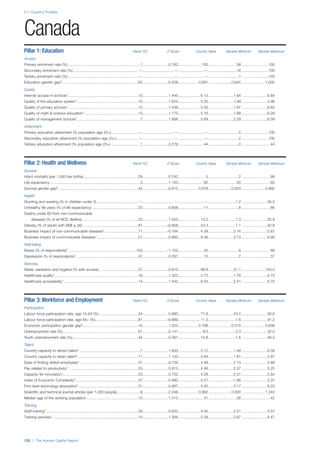
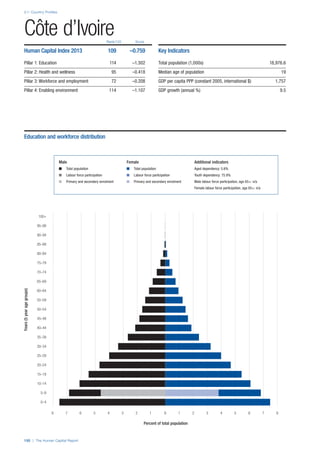
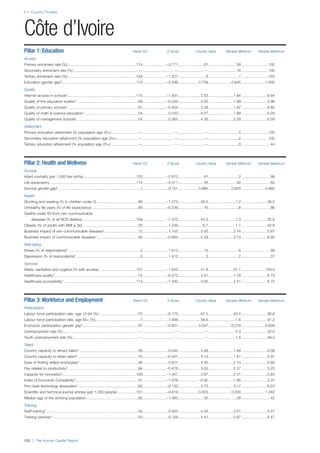
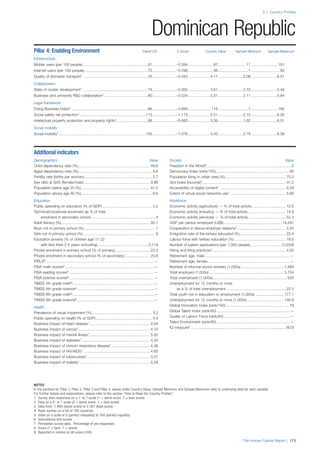
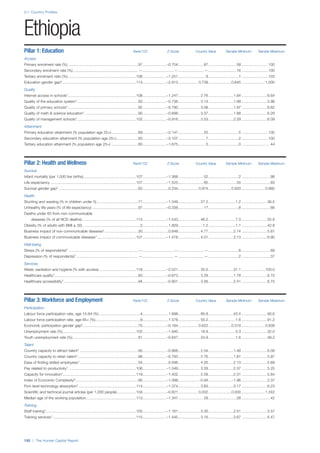
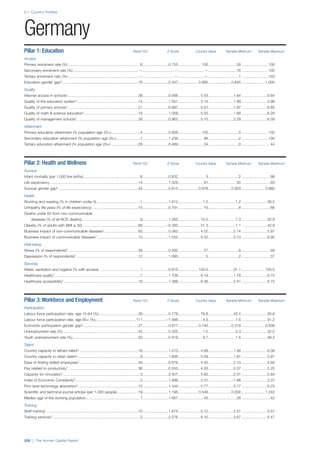
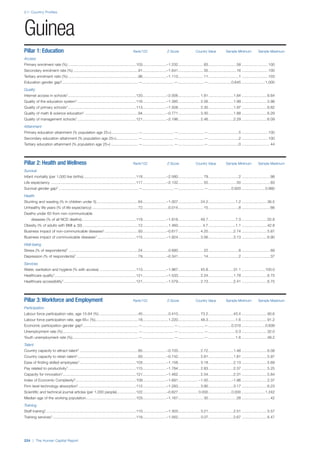
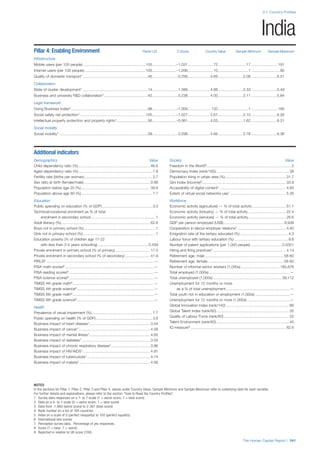
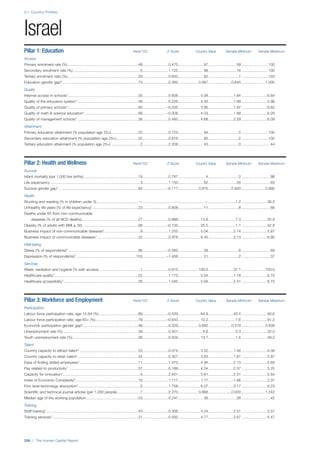
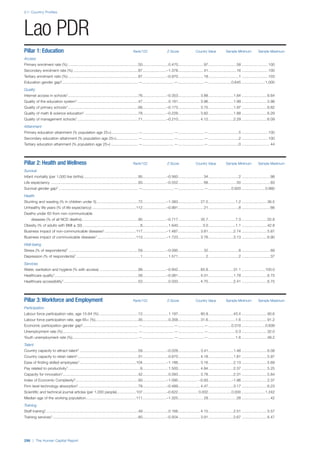
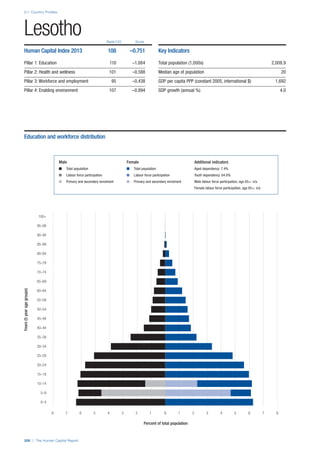
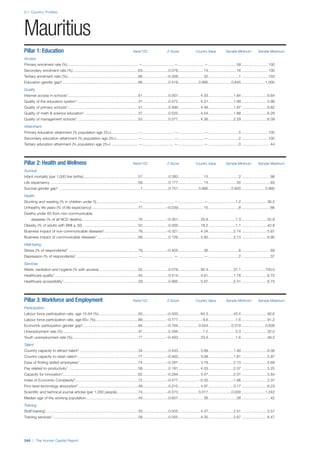
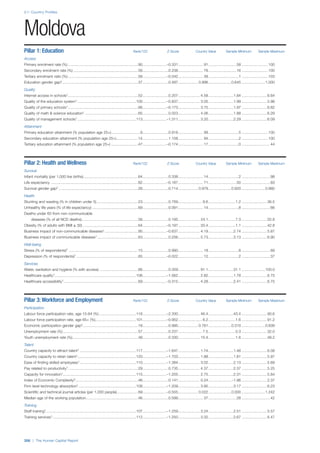
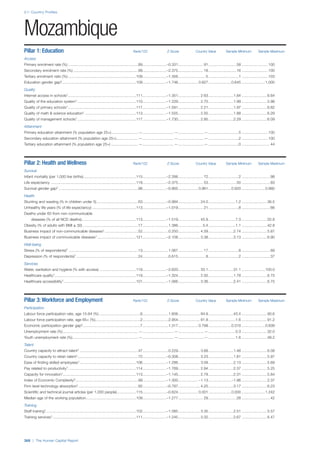
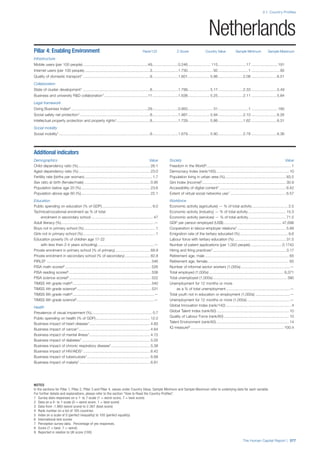
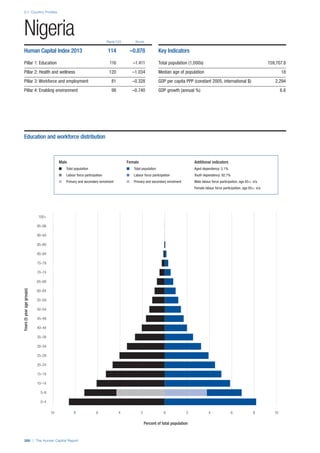
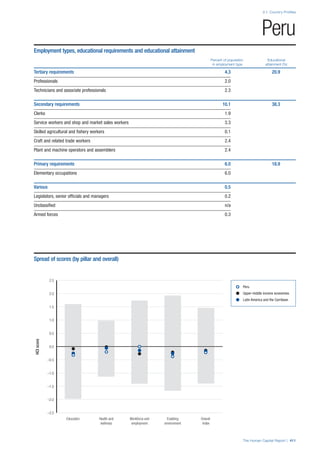
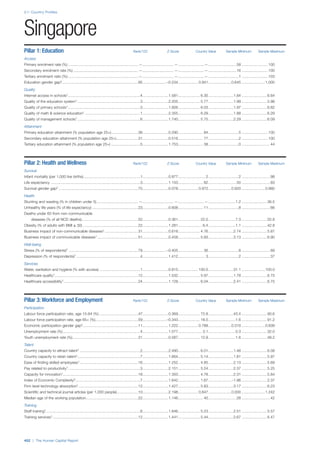
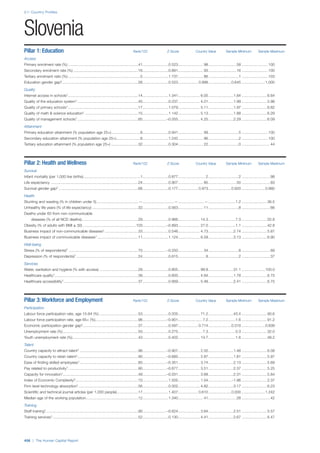
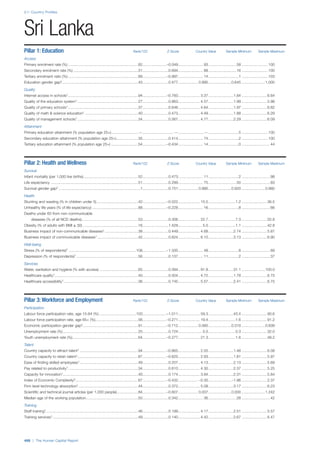
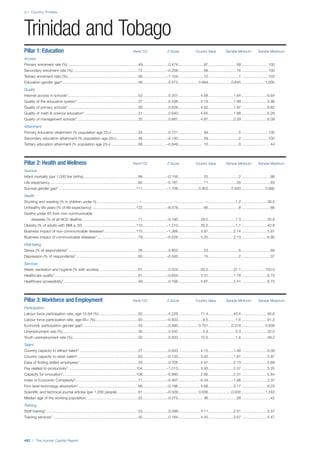
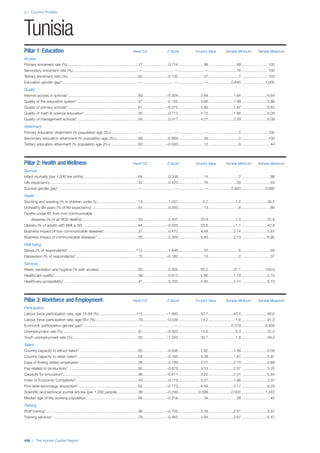
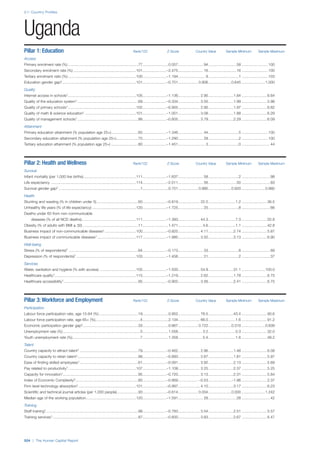
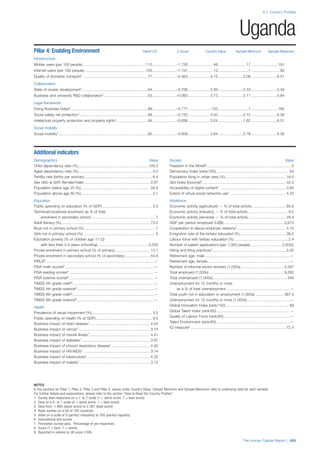
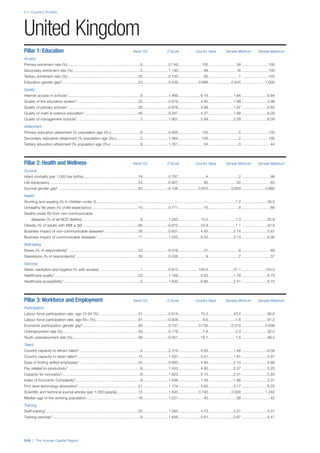
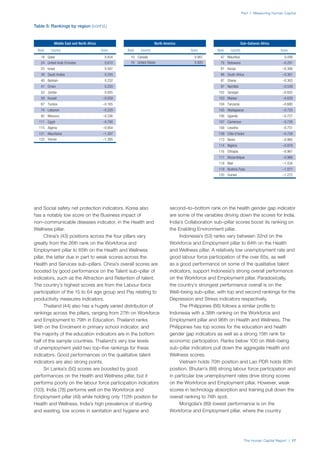
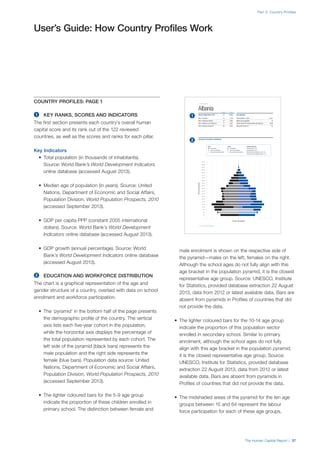
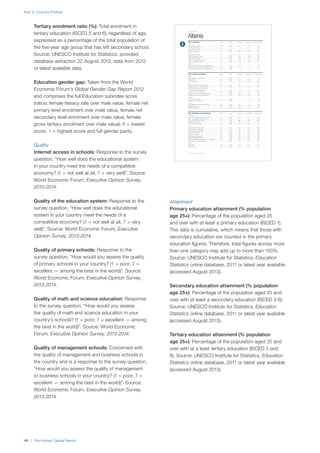
COUNTRY PROFILES: PAGE 3
The first three of the four pillars’ indicators are listed in
detail on this page. Each indicator lists the country’s rank
(out of 122 countries), the z-score, the original data for the
indicator, and the minimum and maximum values from the
entire sample of 122 countries.
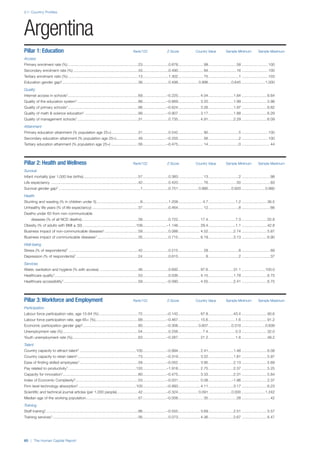
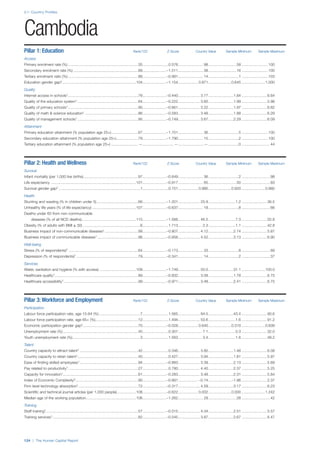
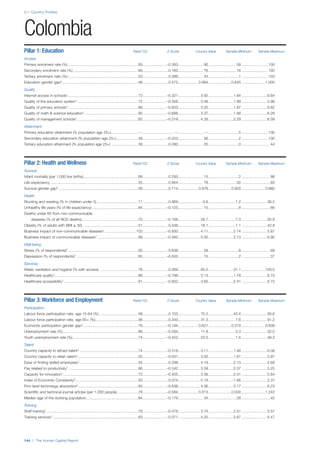
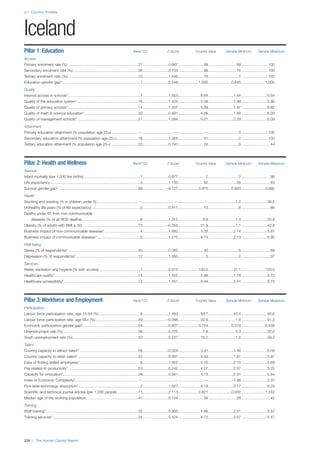
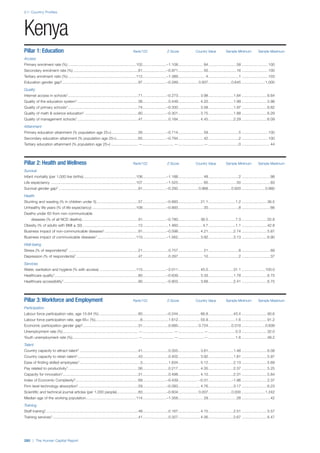
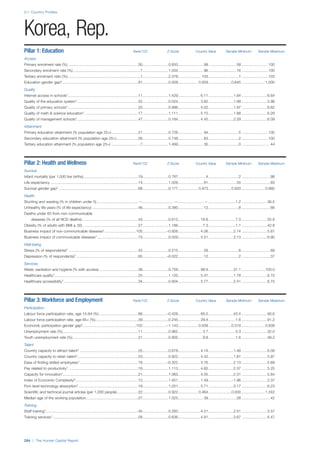
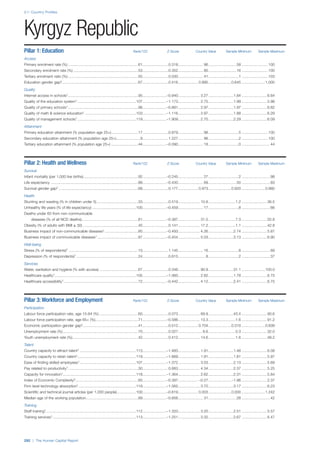
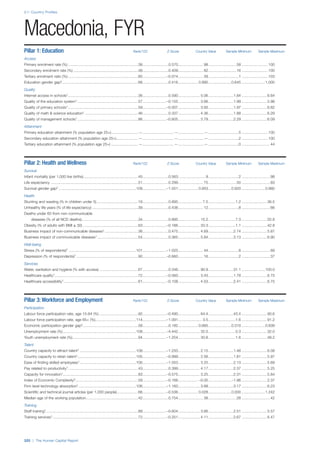
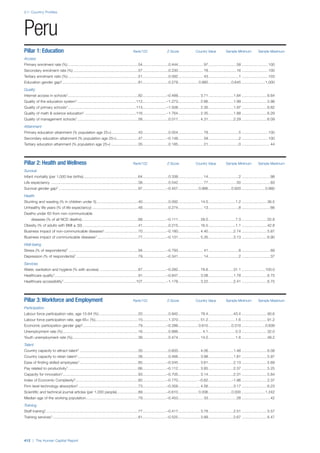
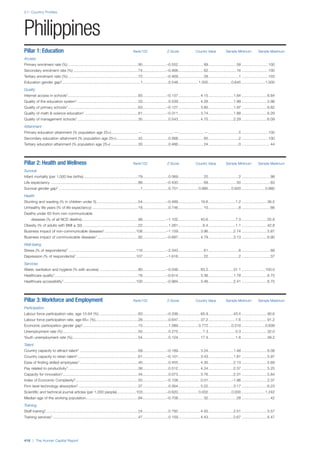
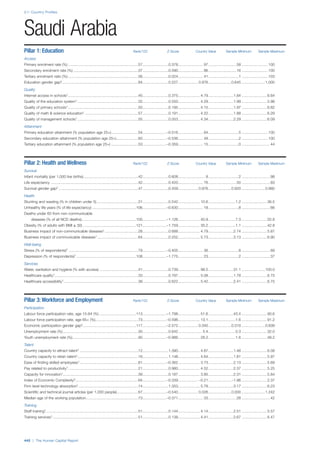
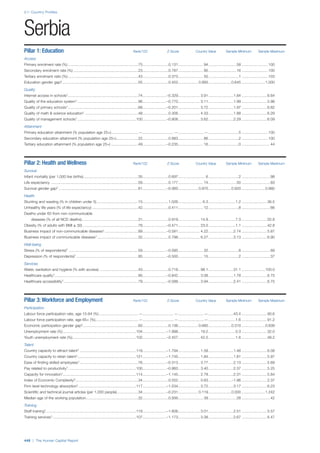
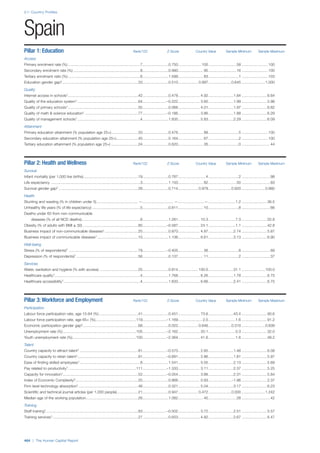
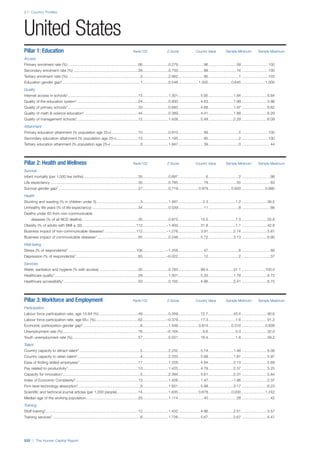
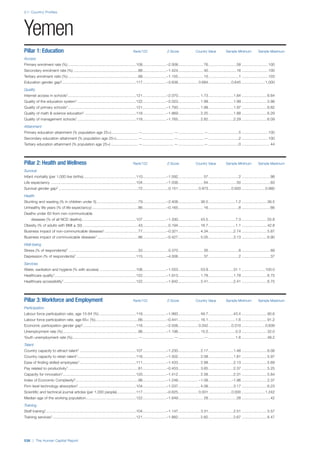
PILLARS 1–3
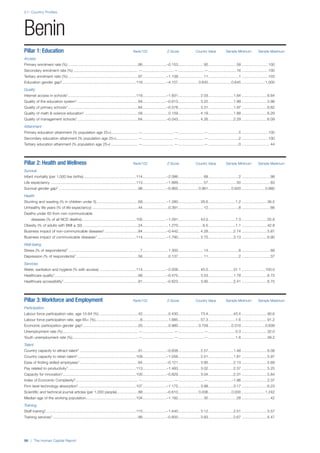
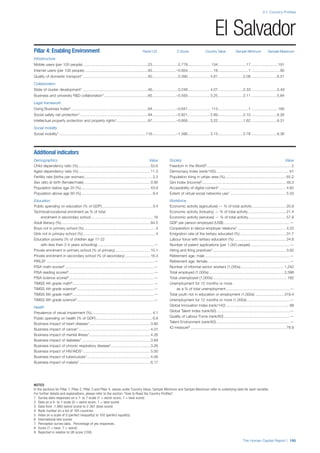
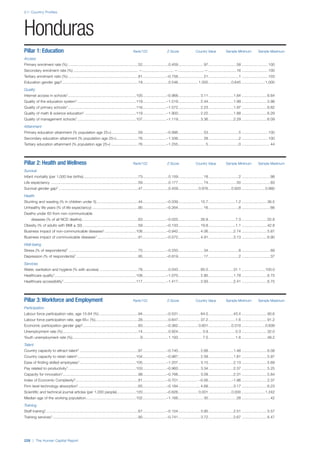
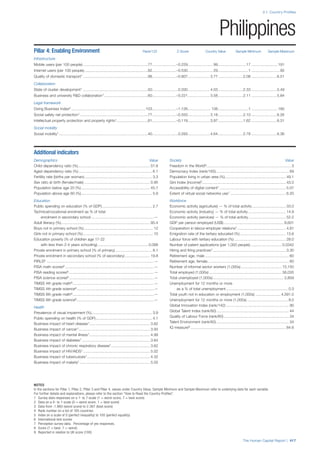
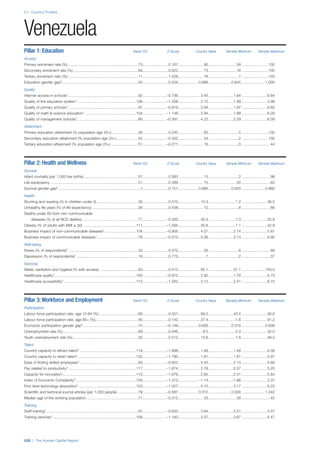
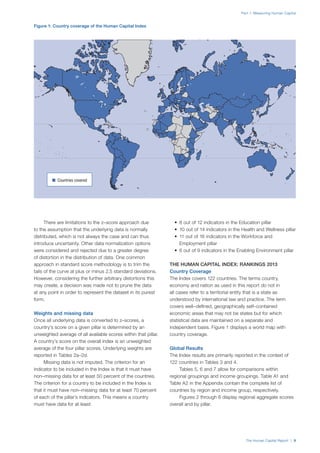
Pillar 1: Education
Access
Primary enrolment rate (%): Net adjusted enrolment
rate, which refers to the percentage of children in the
official primary school age range who are enrolled
in either primary or secondary education. Source:
UNESCO, Institute for Statistics, provided database
extraction 22 August 2013, data from 2012 or latest
available data.
Secondary enrolment rate (%): Percentage of
children in the official age range for secondary school
who are enrolled in secondary education. Source:
UNESCO Institute for Statistics, provided database
extraction 22 August 2013, data from 2012 or latest
available data.](https://image.slidesharecdn.com/201312wefhumancapitalreport2013-140702120247-phpapp02/85/201312-WEF-Human-Capital-Report-2013-47-320.jpg)
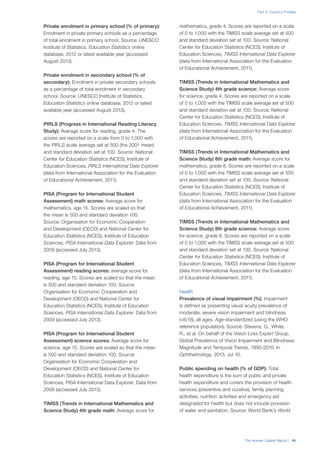
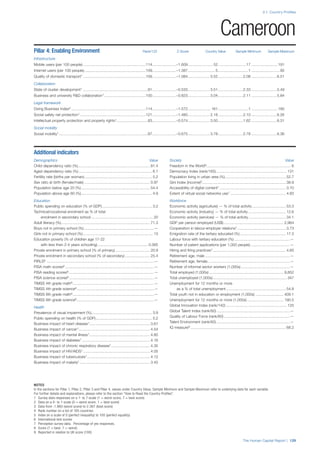
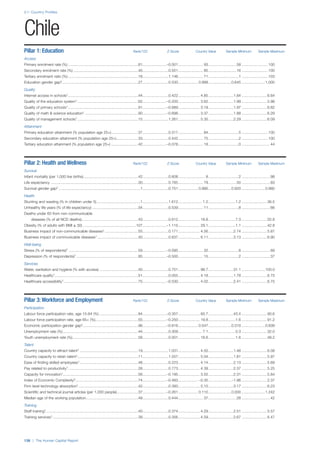
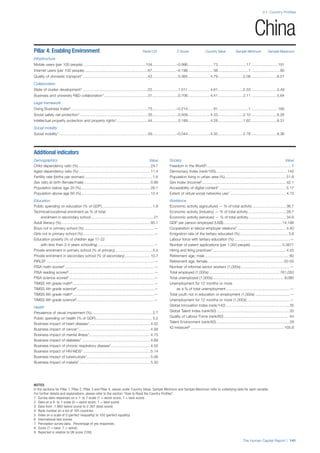
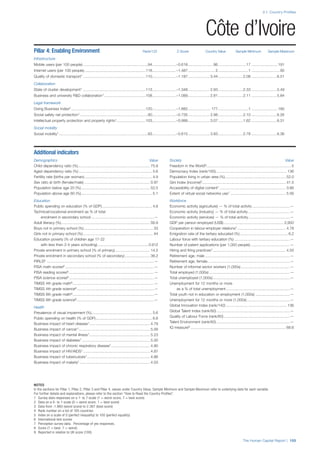
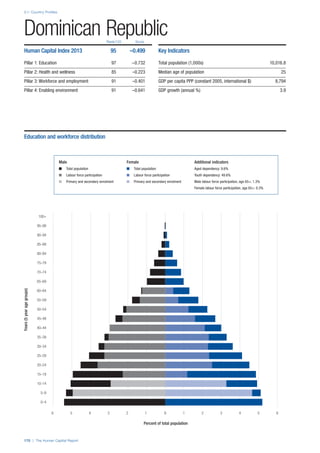
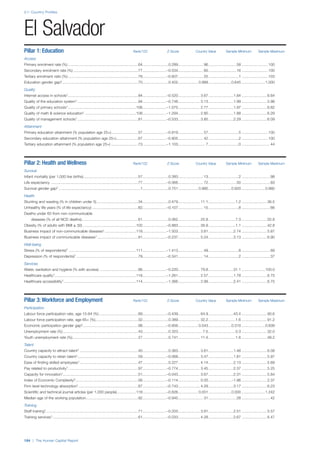
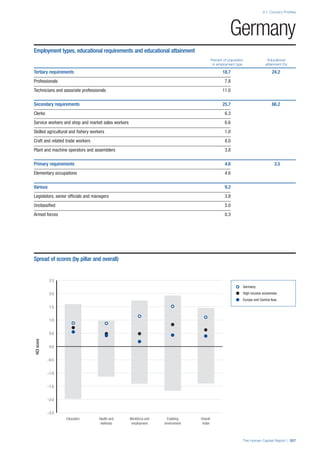
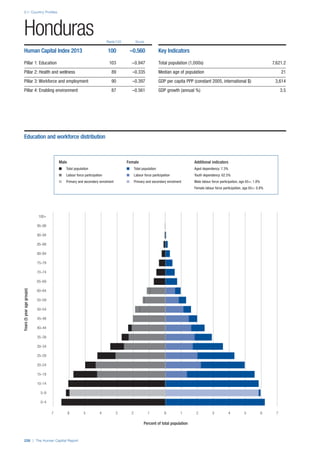
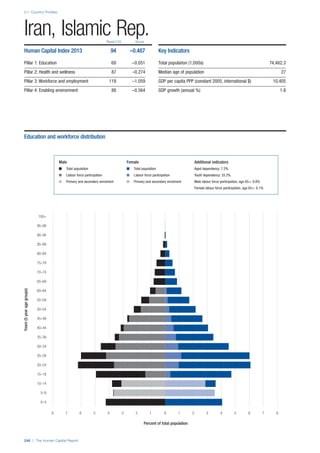
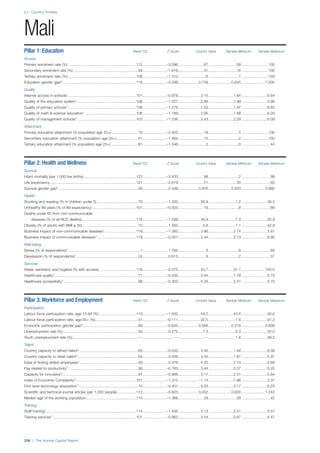
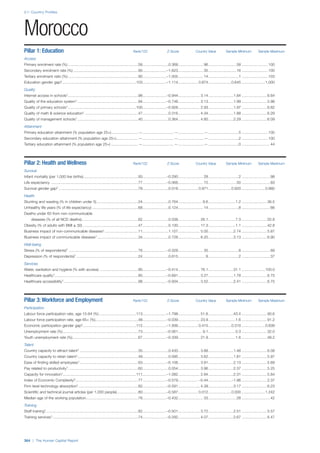
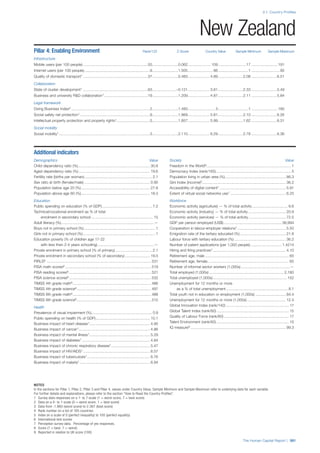
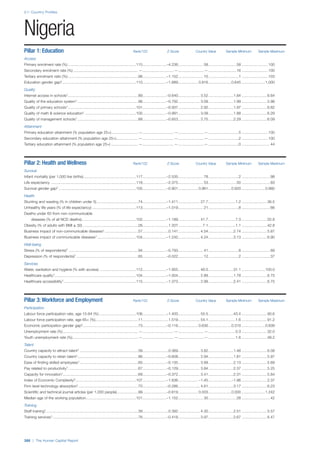
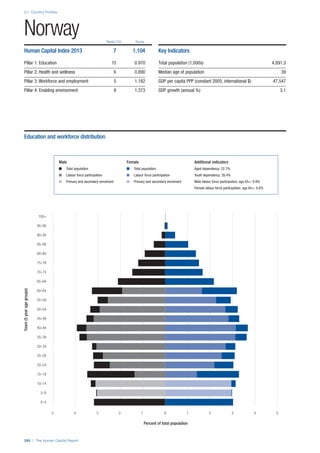
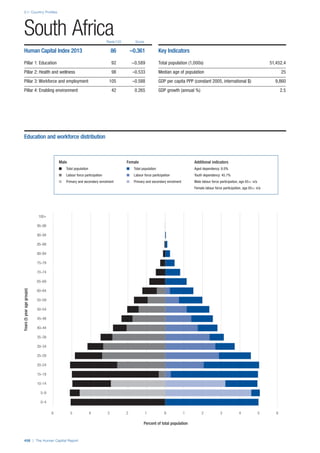
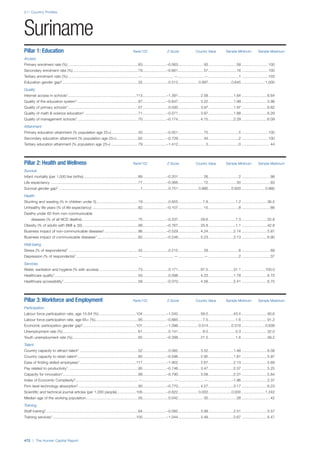
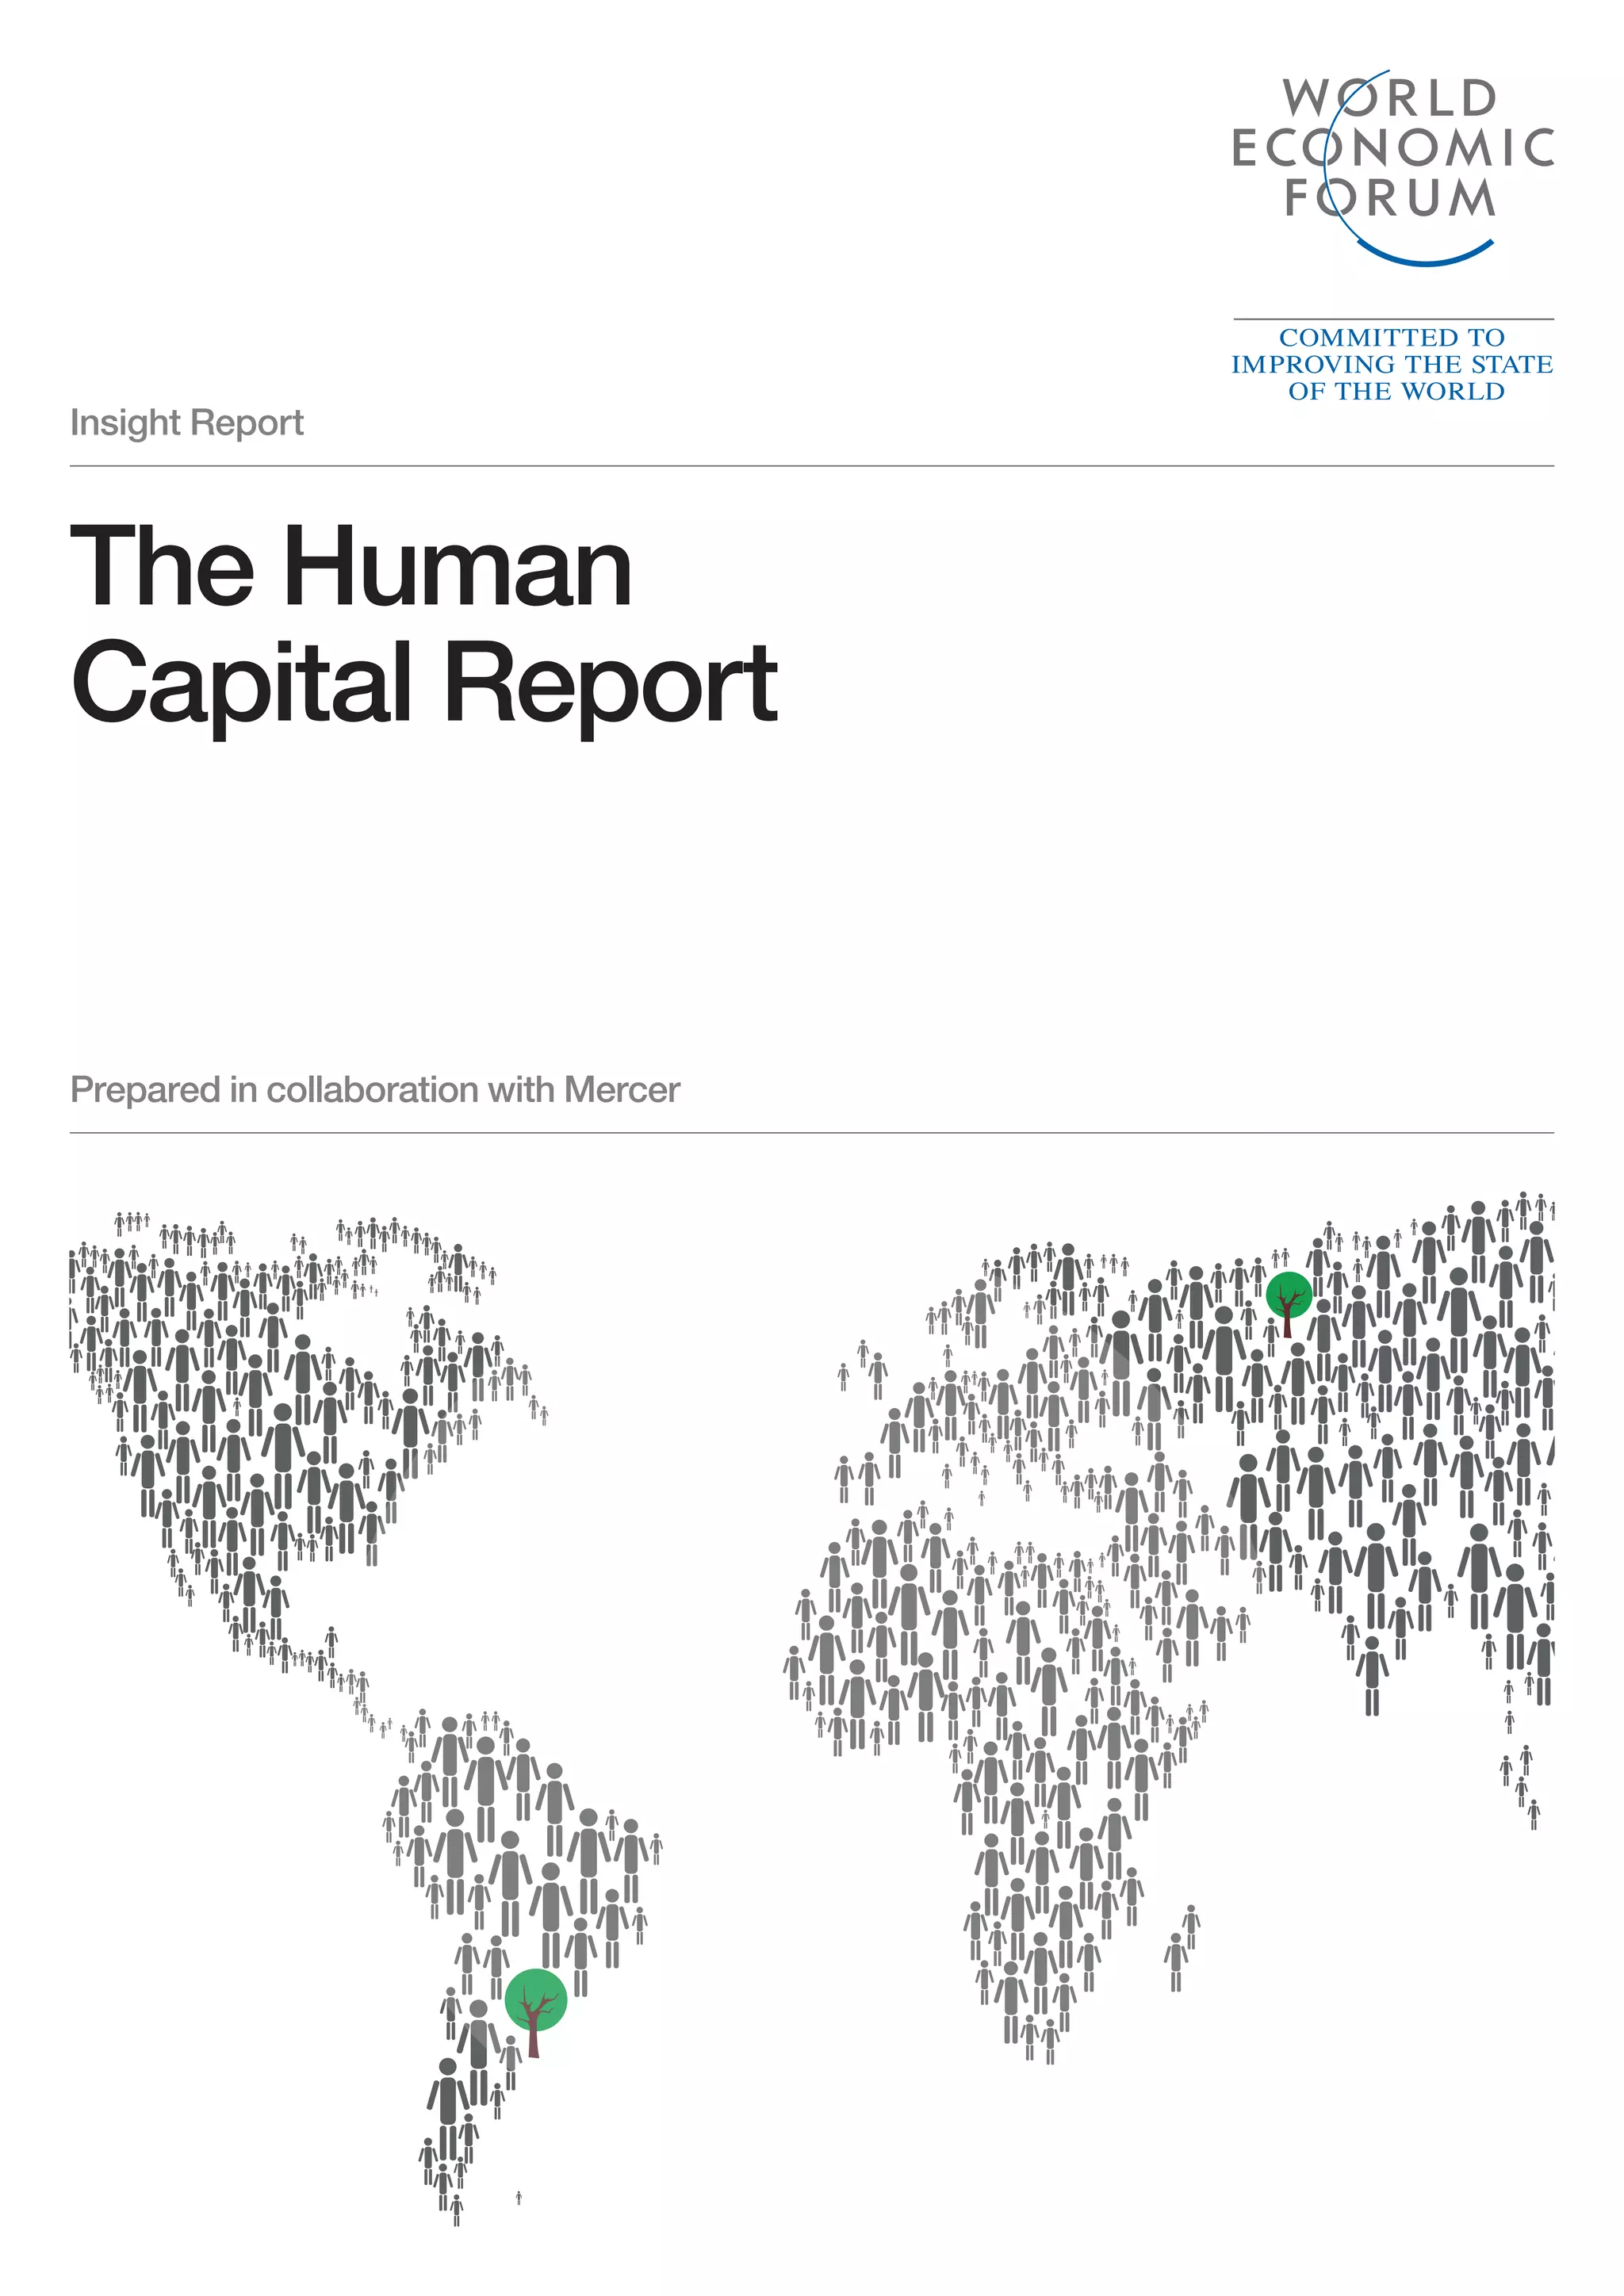
![Part 2: Country Profiles
The Human Capital Report | 41
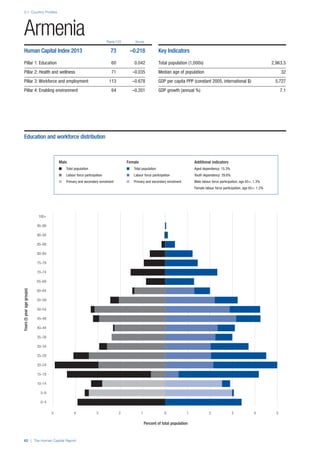
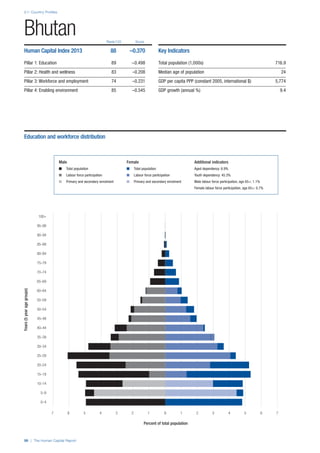
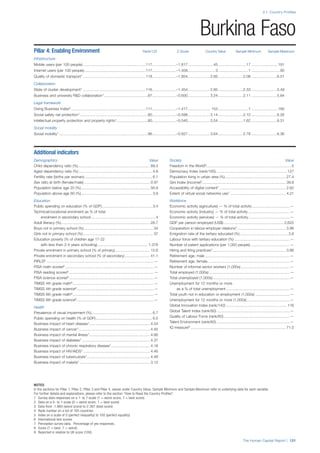
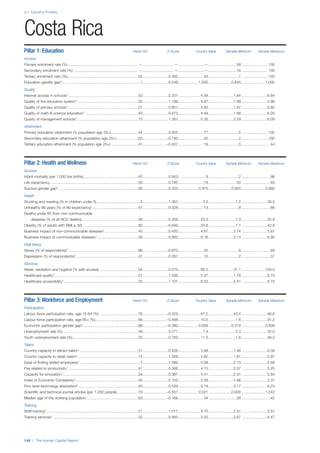
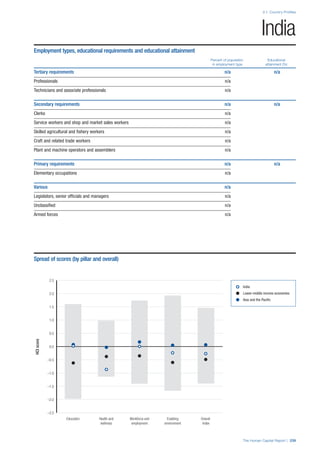
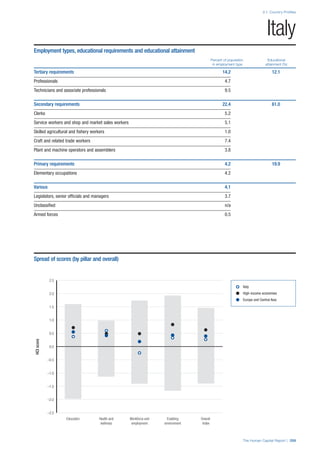
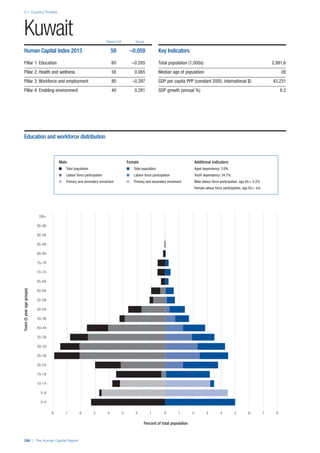
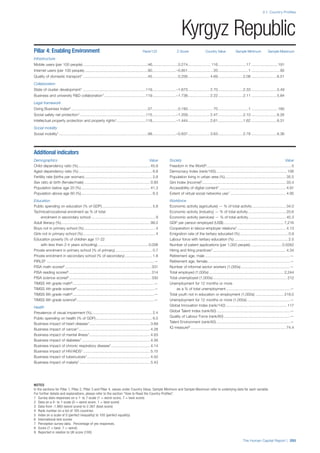
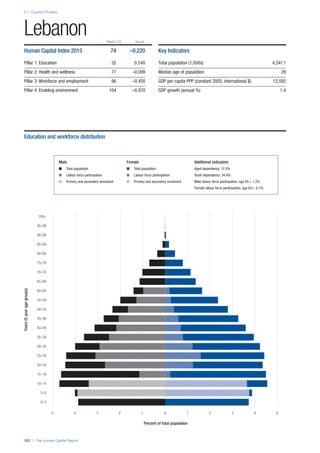
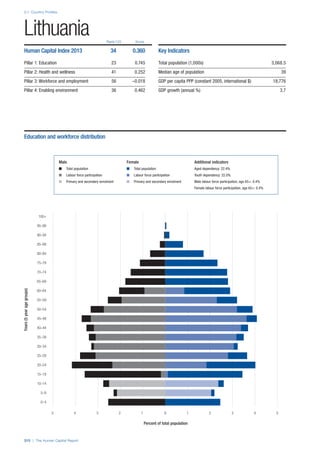
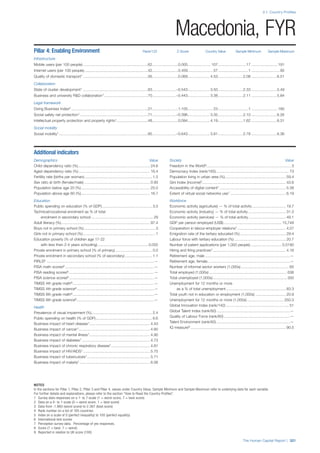
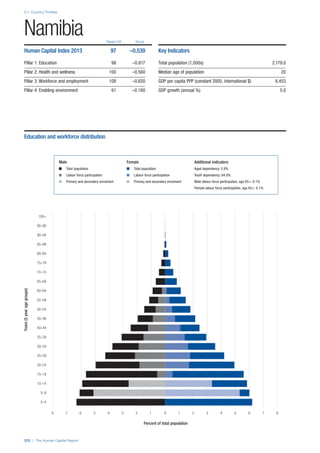
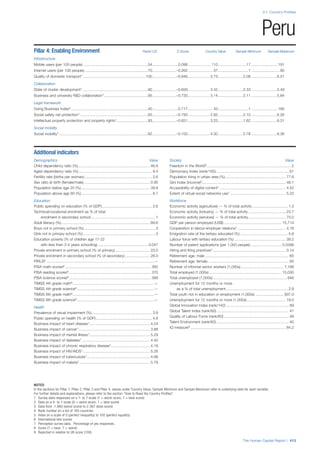
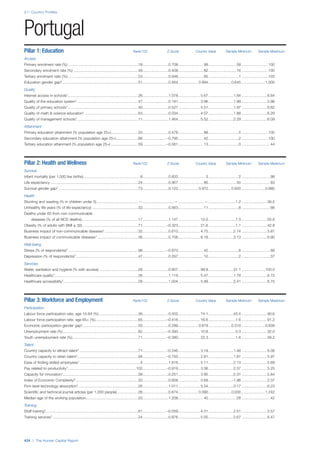
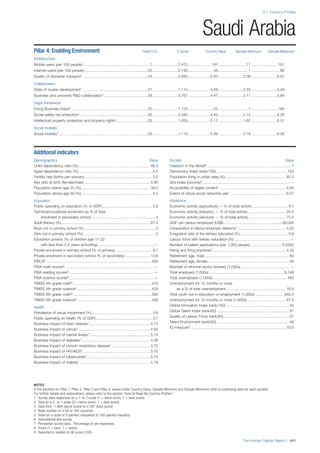
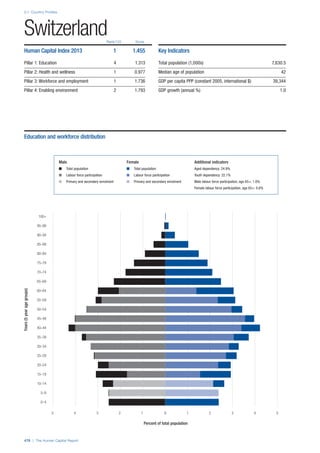
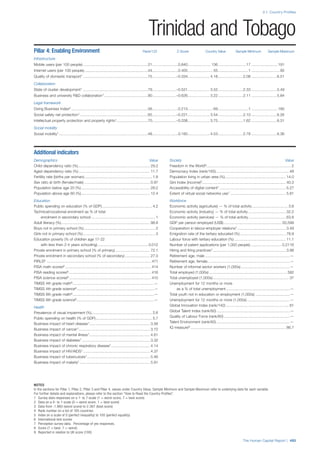
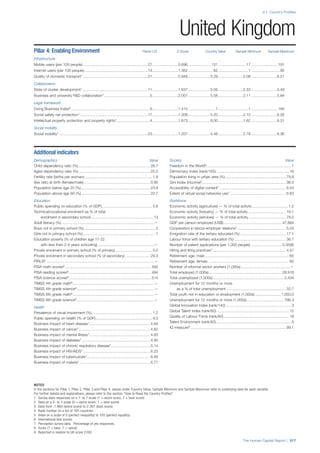
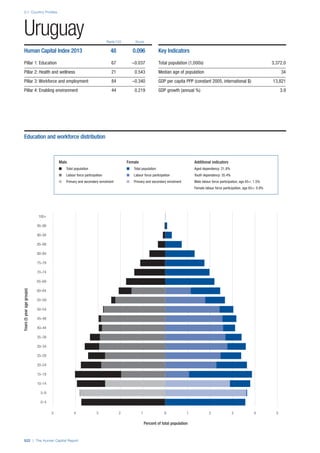
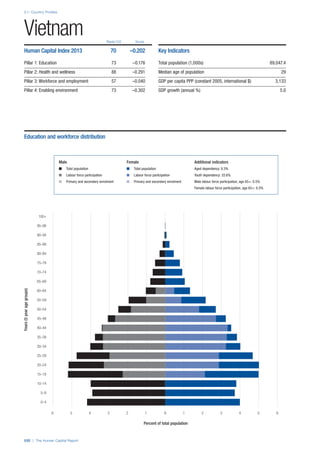
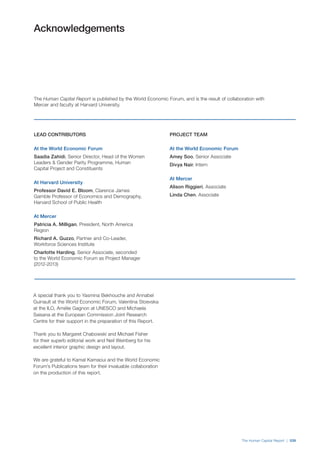
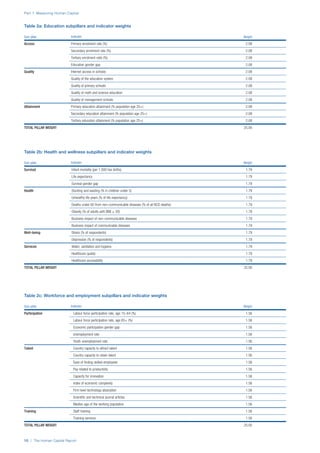
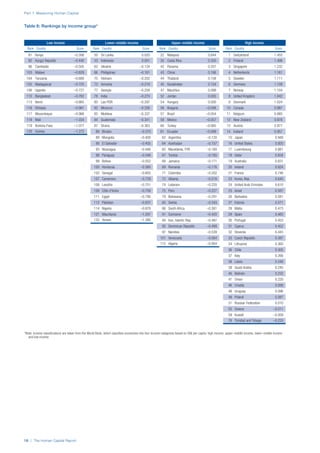
Pillar 2: Health and Wellness
Survival
Infant mortality (per 1,000 live births): Probability of
dying between birth and age 1 per 1,000 live births.
Source: World Health Organisation, Global Health
Observatory, World Health Statistics, Mortality and
Burden of Disease, Child mortality, 2011 (accessed
July 2013).
Life expectancy: Life expectancy at birth (years).
Source: World Health Organisation, Global Health
Observatory, World Health Statistics, Mortality and
Global Health Estimates, 2011 (accessed August
2013).
Survival gender gap: Taken from the World Economic
Forum’s Global Gender Gap 2012 report and
comprises the full Health and Survival subindex (ratios:
sex ratio at birth [converted to female-over-male ratio],
Female healthy life expectancy over male value; 0 =
lowest score, 1 = highest score and full gender parity).
Health
Stunting and wasting (% in children under 5):
Average of the percentage of children under five years
of age who are stunted (height-for-age ratio is below
minus two standard deviations [moderate and severe]
and minus three standard deviations [severe] from the
median height-for-age ratio of the reference population)
and the percentage of children under five who are
wasted (weight-for-height ratio is below minus two
standard deviations [moderate and severe] and minus
three standard deviations [severe] from the median
weight-for-height of the reference population).4
Source:
World Health Organisation, Global Health Observatory,
World Health Statistics, Nutrition, Child malnutrition,
2011 or latest available data (accessed July 2013).
Unhealthy life years (% of life expectancy): Number
of years difference between healthy adjusted life
expectancy at birth (HALE) and life expectancy at
birth, as a percentage of life expectancy. Source:
Healthy adjusted life expectancy, World Health
Organisation data, 2007, taken from the Global Gender
Gap Report 2012. Life expectancy, as above.
Deaths under 60 from non-communicable
diseases (% of all NCD deaths): Number of deaths
under age 60 from non-communicable diseases (NCD)
expressed as a percentage of all NCD deaths. Source:
World Health Organisation, Global Health Observatory,
World Health Statistics, Non-communicable diseases,
2008 (accessed August 2013).
Obesity (% of adults with BMI ≥ 30): Percentage of
adults aged 20 and over with a body mass index of 30
or above. Source: World Health Organisation, Global
Health Observatory, World Health Statistics, Adult risk
factors, 2008 (accessed August 2013).
Business impact of non-communicable diseases is
the average of five variables contained in the response
to the survey question, “How serious an impact do
you consider the following diseases will have on your
company in the next five years (e.g. death, disability,
medical and funeral expenses, productivity and
absenteeism, recruitment and training expenses,
revenues)?
a. Heart disease and related cardio vascular
problems (1 = a serious impact, 7 = no
impact at all)
b. Cancer (1 = a serious impact, 7 = no impact
at all)
c. Mental illness (1 = a serious impact, 7 = no
impact at all)
d. Diabetes (1 = a serious impact, 7 = no
impact at all)
e. Chronic respiratory disease (1 = a serious
impact, 7 = no impact at all)
Source: World Economic Forum, Executive Opinion
Survey, 2013-2014.
Business impact of communicable diseases: The
average of three variables contained in the response
to the survey question, “How serious an impact do
you consider the following diseases will have on your
company in the next five years (e.g. death, disability,
medical and funeral expenses, productivity and
absenteeism, recruitment and training expenses,
revenues)?
f. HIV / AIDS (1 = a serious impact, 7 = no
impact at all)
g. Tuberculosis (1 = a serious impact, 7 = no
impact at all)
h. Malaria (1 = a serious impact, 7 = no impact
at all)
Source: World Economic Forum, Executive Opinion
Survey, 2013-2014.
Well-being
Stress (% of respondents): Percentage of sample
population with “yes” responses to the question, “Did
you experience the following feelings during a lot of the
day yesterday? How about stress?”. Source: Gallup,
Worldview database, 2013 or latest available data.
Depression (% of respondents): Percentage of
sample population with “yes” responses to the
question, “Did you experience the following feelings
during a lot of the day yesterday? How about
depression?”. Source: Gallup, Worldview database,
2011 or latest available data.](https://image.slidesharecdn.com/201312wefhumancapitalreport2013-140702120247-phpapp02/85/201312-WEF-Human-Capital-Report-2013-49-320.jpg)
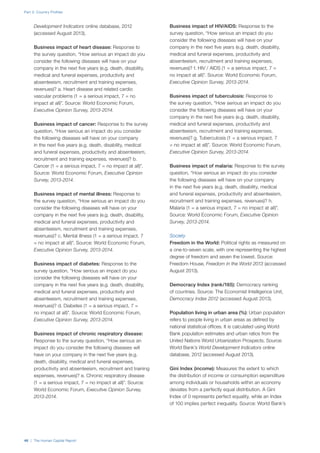
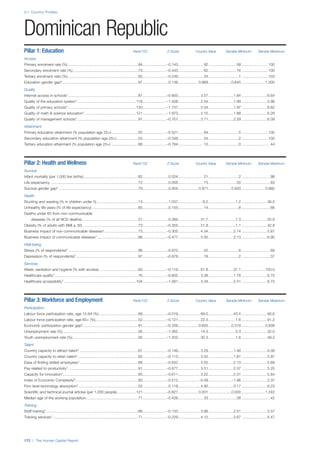
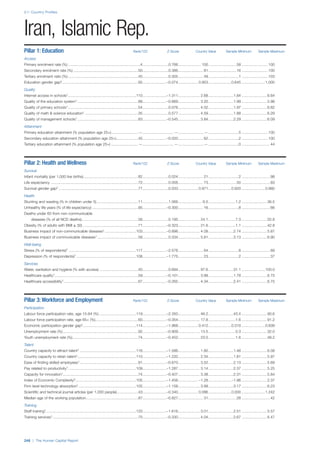
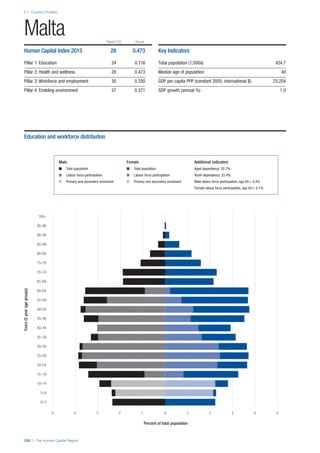
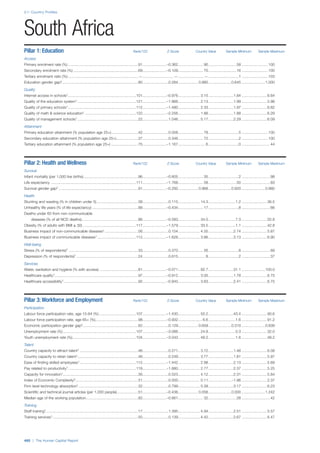
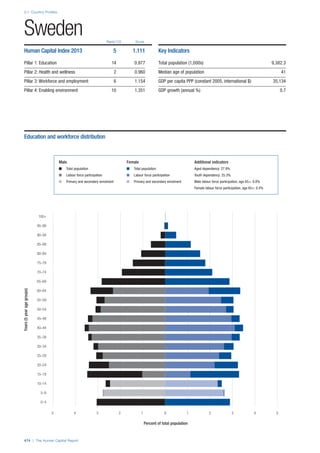
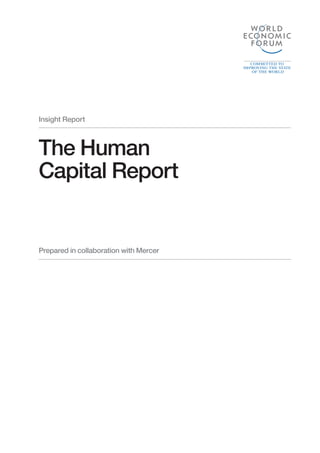
![Part 2: Country Profiles
42 | The Human Capital Report
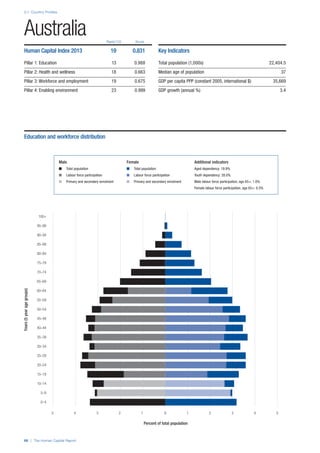
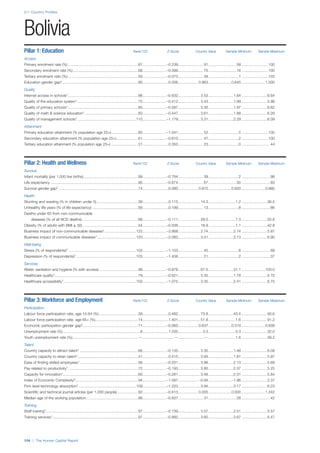
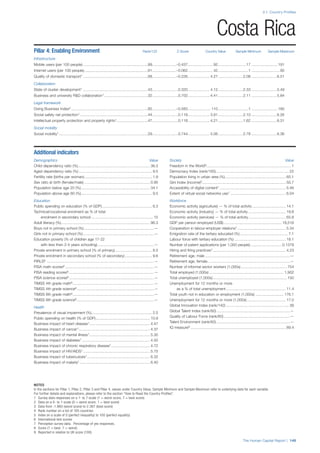
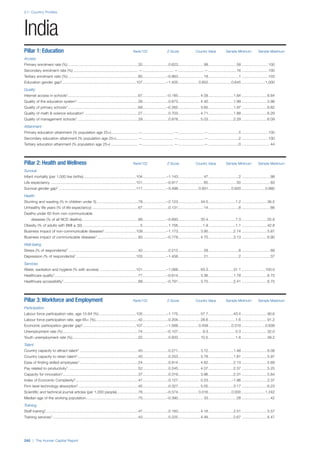
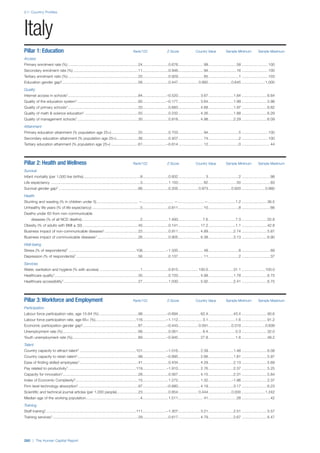
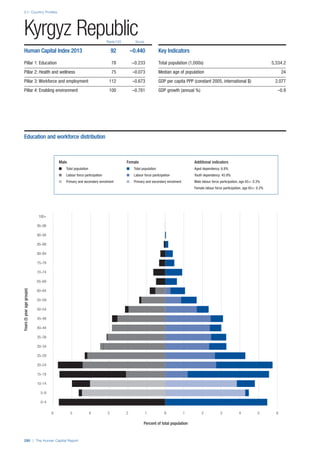
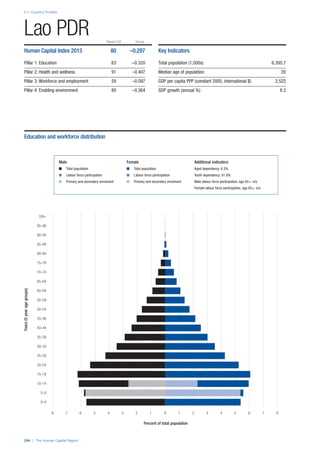
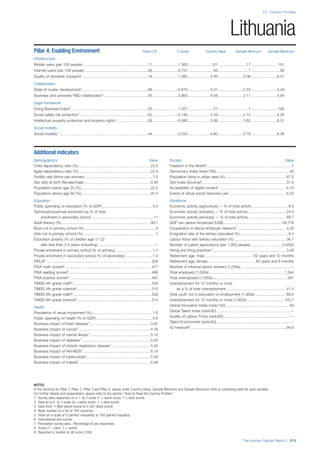
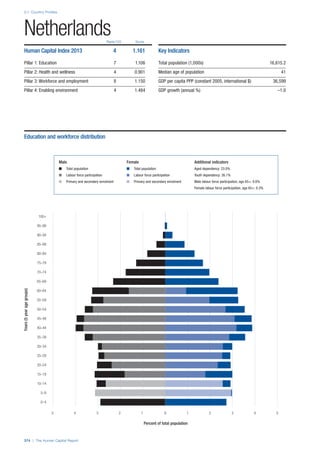
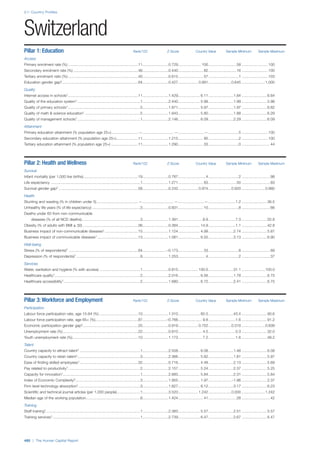
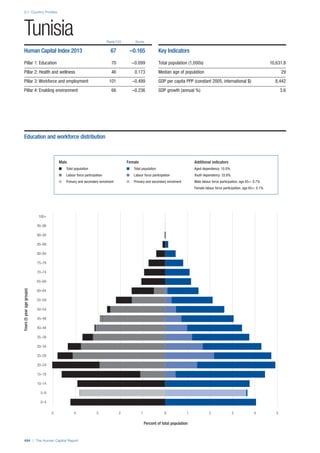
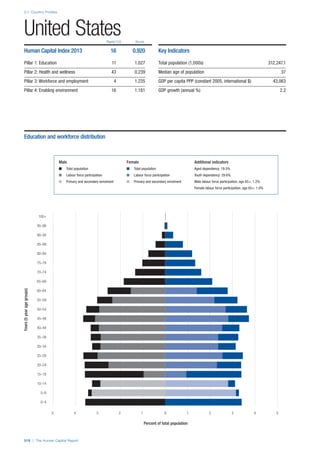
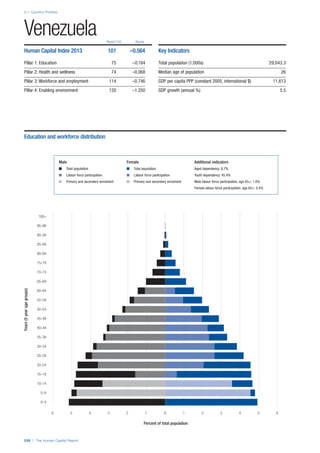
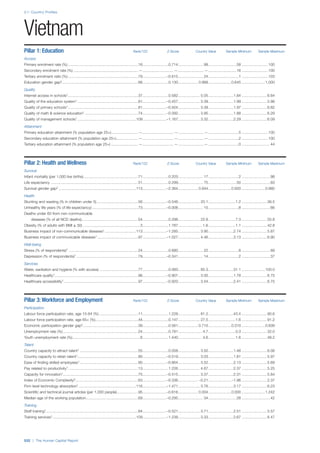
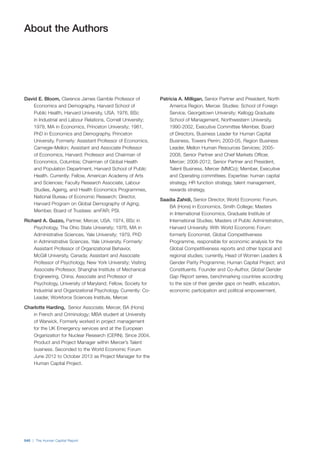
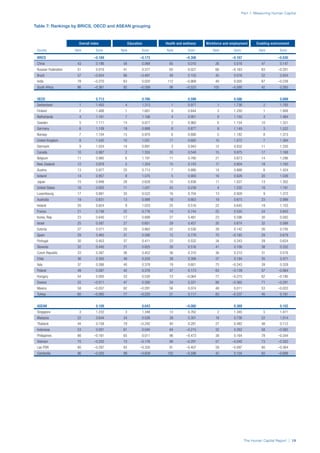
Services
Water, sanitation and hygiene: Average of
“population (as a % of total population) using improved
drinking water sources” and “population using
improved sanitation facilities”. Source: World Health
Organisation, Global Health Observatory, World
Health Statistics, Environmental Health, 2011 or latest
available data (accessed August 2013).
Healthcare quality: Response to the survey question,
“In your country, how would you assess the quality of
healthcare (public and private) provided to ordinary
citizens? (1 = extremely poor – among the worst in the
world, 7 = excellent - among the best in the world)”.
Source: World Economic Forum, Executive Opinion
Survey, 2013-2014.
Healthcare accessibility: Response to the survey
question, “How accessible is healthcare in your
country? (1 = limited — only the privileged have
access, 7 = universal— all citizens have access
to healthcare)”. Source: World Economic Forum,
Executive Opinion Survey, 2013-2014.
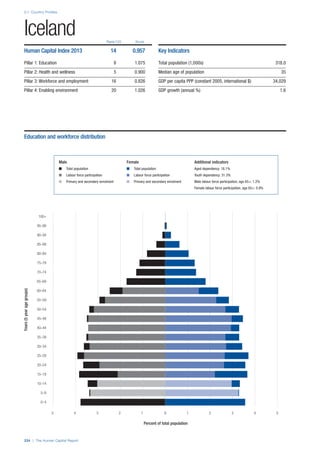
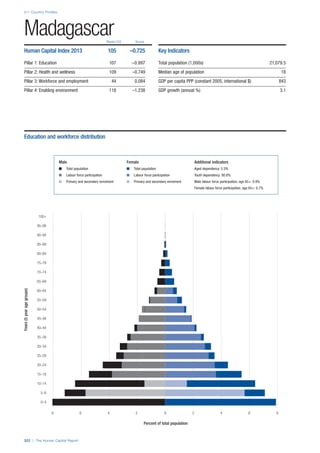
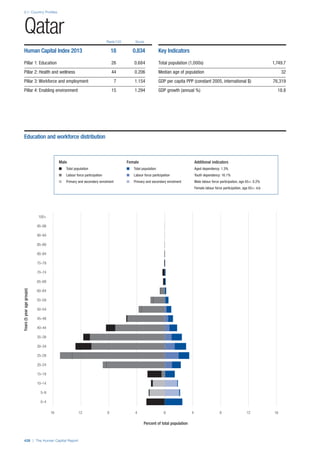
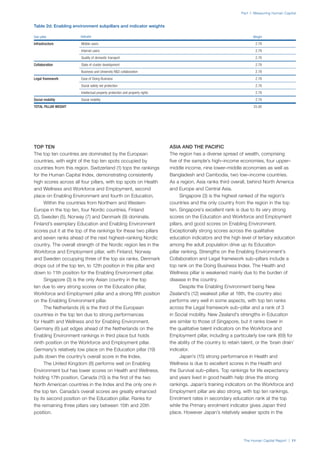
Pillar 3: Workforce and Employment
Participation
Labour force participation rate, age 15-64 (%):
The labour force participation rate is a measure of
the proportion of a country’s working-age population
that engages actively in the labour market, either
by working or looking for work.5
Source: ILO, Key
Indicators of the Labour Market, (KILM), 2010
(accessed September 2013).
Labour force participation rate, age 65+ (%):
Source: ILO, Key Indicators of the Labour Market,
(KILM), 2010 (accessed July 2013).
Economic participation gender gap: Taken from the
World Economic Forum’s Global Gender Gap Report
2012 and comprises the full Economic Participation
and Opportunity subindex score (ratios: female labour
force participation over male value, estimated female
earned income over male value, female legislators,
senior officials, and managers over male value, female
professional and technical workers over male value,
wage equality between women and men for similar
work [converted to male-over-female ratio]); 0 = lowest
score, 1 = highest score and full gender parity.
Unemployment rate: Number of persons who are
unemployed as a percentage of the total number of
employed and unemployed persons (i.e. the labour
force)6
Source: ILO, ILOstat, 2010 or latest available
data (accessed August 2013).
Youth unemployment rate: Number of unemployed
youth (typically 15-24 years) divided by the youth
labour force (employment + unemployment).7
Source:
ILO, Laborstat, 2010 or latest available data (accessed
August 2013).
Talent
Country capacity to attract talent: Response to the
survey question, “Does your country attract talented
people from abroad? (1 = not at all, 7 = attracts the
best and brightest from around the world)”. Source:
World Economic Forum, Executive Opinion Survey,
2013-2014.
Country capacity to retain talent: Response to
the survey question, “Does your country retain
talented people? (1 = the best and brightest leave to
pursue opportunities in other countries, 7 = the best
and brightest stay and pursue opportunities in the
country)”. Source: World Economic Forum, Executive
Opinion Survey, 2013-2014.
Ease of finding skilled employees: Response to the
survey question, “In your country, how easy is it for
companies to find employees with the required skills
for their business needs? (1 = extremely difficult, 7
= extremely easy)”. Source: World Economic Forum,
Executive Opinion Survey, 2013-2014.
Pay related to productivity: Response to the survey
question, “To what extent is pay in your country related
to productivity? (1 = not related to worker productivity,
7 = strongly related to worker productivity)”. Source:
World Economic Forum, Executive Opinion Survey,
2013-2014.
Capacity for innovation: Response to the survey
question, “In your country, how do companies
obtain technology? (1 = exclusively from licensing or
imitating foreign companies, 7 = by conducting formal
research and pioneering their own new products
and processes)”. Source: World Economic Forum,
Executive Opinion Survey, 2013-2014.
Index of economic complexity: The Atlas of
Economic Complexity attempts to measure the
amount of productive knowledge that each country
holds.8
Source: Hausmann, R., Hidalgo, C., et al. The
Atlas of Economic Complexity. Cambridge: Puritan
Press, 2011.9
Firm level technology absorption: Response to the
survey question, “To what extent do businesses in
your country absorb new technology? (1 = Not at all;
7 = Aggressively absorb)”. Source: World Economic
Forum, Executive Opinion Survey, 2013-2014.](https://image.slidesharecdn.com/201312wefhumancapitalreport2013-140702120247-phpapp02/85/201312-WEF-Human-Capital-Report-2013-50-320.jpg)