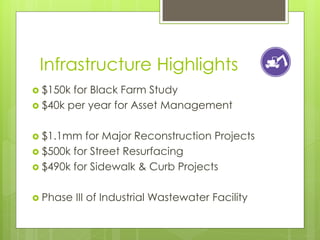
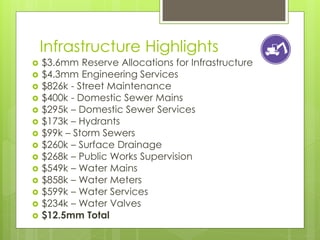
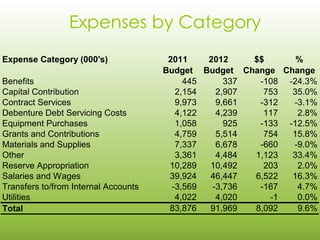
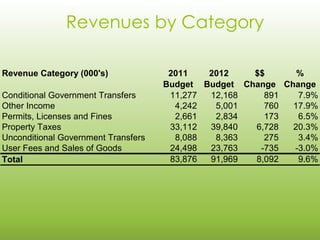
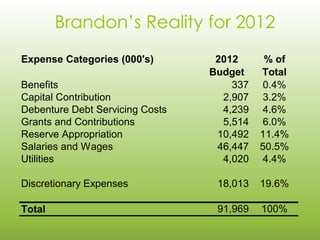
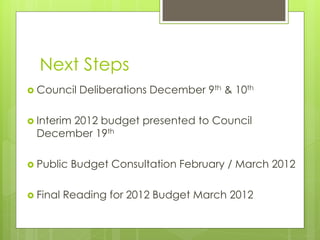
2012 City of
   Brandon
    Budget
   Highlights
Dean Hammond, CMA
City Treasurer and GM of
Corporate Services

December 6, 2011
Agenda
 Strategic Challenges
 Operating Challenges
 2012 Opportunities
 The Roadmap for Growth
 The Nine Pillars
 2012 Expenses
 2012 Revenues
 Final Thoughts on the 2012 Budget
 Next Steps
Strategic Challenges
 Infrastructure
 How    do we manage growth?
     Physical Growth
     Economic Growth
     “Quality of Life” Growth
 How do we best support our partners, e.g.,
 The Keystone Centre?
Operational Challenges
 Four   New Collective Agreements
     Protective Services – Police, Fire, E-911
     Transit – ATU
 Infrastructure
 Aging   Equipment & A Need For Space
 City Structure & Organizational Sustainability
2012 Opportunities
 Infrastructure
             – Asset Management
 New Revenue Opportunities
     Accommodation Tax
     Sanitation
     Greywater Recovery
     Transit Strategy
     Trenchless Technology
     Landfill Gas Recovery
     Potential Canada Games Bid
 Performance      Metrics / Performance Management
The Roadmap for Growth
 “How    to Manage Growth” is our Theme
    Physical Growth
    Economic Growth
    Quality of Life Growth

 10   Supporting Pillars
Infrastructure Highlights
 $150k for Black Farm Study
 $40k per year for Asset Management


 $1.1mm  for Major Reconstruction Projects
 $500k for Street Resurfacing
 $490k for Sidewalk & Curb Projects


 Phase   III of Industrial Wastewater Facility
Infrastructure Highlights
   $3.6mm Reserve Allocations for Infrastructure
   $4.3mm Engineering Services
   $826k - Street Maintenance
   $400k - Domestic Sewer Mains
   $295k – Domestic Sewer Services
   $173k – Hydrants
   $99k – Storm Sewers
   $260k – Surface Drainage
   $268k – Public Works Supervision
   $549k – Water Mains
   $858k – Water Meters
   $599k – Water Services
   $234k – Water Valves
   $12.5mm Total
Infrastructure Highlights
 $35k  for Sewer Leak Detection Equipment
 $75k for Increased Sewer Inspections
 $100k for Sewer Inspection Equipment
 $50k for Manhole Restorations
 $5k Pipe Freezing Equipment
 $60k for Ditch Cleaning / Remediation
 $35k for a Truck Mounted Sewer Cage
 $50k for 4” Diesel Pump
 Total - $410k
Communications Highlights
 $91k   Communications
Rural Outreach Highlights
 Explore Regionalization & Shared Services
    Opportunities.

   Elton / Cornwallis Annexation Strategy
Affordable Housing Highlights
 $250kappropriation for Affordable Housing
 Reserve

 $293k
      grant for Manitoba Seniors Housing
 Co-op on McDiarmid Drive

 $58k
     grant & support for Brandon
 Neighborhood Renewal Corp

 $200k   for Comprehensive Zoning By-Law
Economic Development
Highlights
 $135k
      additional funding allocated to
 Economic Development Initiatives
    Foreign Direct Investment Study
    Excess Moisture Business Continuity Planning


 $45k   Keystone Centre Study

 $200k   allocated for 2017 Canada Games
 Study
Downtown Hub Highlights
 Comprehensive    Zoning By-law review
 Renaissance District Secondary Plan
 Demolition of Brandon Inn
Environment Highlights
 Landfill   Gas Recovery

 Permanent     Hazardous Waste Depot

 Water   Conservation Strategy

 Environmental    Strategy Plan
Culture & Heritage Highlights
 $20k for Multi-Cultural Festival
 $42k for Cultural Resource Center
 $25k for Support of a Brandon Arts Council
 $50k for Sculptures Program
 Funding for Brandon Museum (TBD)
Recreation Highlights
 $4mm   Commitment to YMCA Project
 Joint Use Agreement with School Division
 $45k commitment to School Division for
  maintenance / replacement of playgrounds
 $215k Permanent Youth Center
 $48k Community Centre Funding
 $48k for Community Centre GAP Analysis
 Recreation Strategy & Rec Centre Strategies
Expenses by Category
Expense Category (000's)               2011    2012    $$      %
                                      Budget Budget Change Change
Benefits                                   445     337  -108 -24.3%
Capital Contribution                     2,154   2,907   753  35.0%
Contract Services                        9,973   9,661  -312  -3.1%
Debenture Debt Servicing Costs           4,122   4,239   117   2.8%
Equipment Purchases                      1,058     925  -133 -12.5%
Grants and Contributions                 4,759   5,514   754  15.8%
Materials and Supplies                   7,337   6,678  -660  -9.0%
Other                                    3,361   4,484 1,123  33.4%
Reserve Appropriation                  10,289  10,492    203   2.0%
Salaries and Wages                     39,924  46,447  6,522  16.3%
Transfers to/from Internal Accounts     -3,569  -3,736  -167   4.7%
Utilities                                4,022   4,020    -1   0.0%
Total                                  83,876  91,969  8,092   9.6%
Revenues by Category

Revenue Category (000's)              2011   2012    $$      %
                                     Budget Budget Change Change
Conditional Government Transfers      11,277 12,168    891   7.9%
Other Income                           4,242  5,001    760  17.9%
Permits, Licenses and Fines            2,661  2,834    173   6.5%
Property Taxes                        33,112 39,840  6,728  20.3%
Unconditional Government Transfers     8,088  8,363    275   3.4%
User Fees and Sales of Goods          24,498 23,763   -735  -3.0%
Total                                 83,876 91,969  8,092   9.6%
Brandon’s Reality for 2012
Expense Categories (000's)        2012      % of
                                 Budget    Total
Benefits                             337    0.4%
Capital Contribution               2,907    3.2%
Debenture Debt Servicing Costs     4,239    4.6%
Grants and Contributions           5,514    6.0%
Reserve Appropriation             10,492   11.4%
Salaries and Wages                46,447   50.5%
Utilities                          4,020    4.4%

Discretionary Expenses            18,013   19.6%

Total                             91,969   100%
Revenues by Category

Revenue Category (000's)              2011   2012    $$      %
                                     Budget Budget Change Change
Conditional Government Transfers      11,277 12,168    891   7.9%
Other Income                           4,242  5,001    760  17.9%
Permits, Licenses and Fines            2,661  2,834    173   6.5%
Property Taxes                        33,112 39,840  6,728  20.3%
Unconditional Government Transfers     8,088  8,363    275   3.4%
User Fees and Sales of Goods          24,498 23,763   -735  -3.0%
Total                                 83,876 91,969  8,092   9.6%
Next Steps
 Council   Deliberations December 9th & 10th

 Interim
       2012 budget presented to Council
  December 19th

 Public   Budget Consultation February / March 2012

 Final   Reading for 2012 Budget March 2012
Questions?

2012 Public Budget Meeting

  • 1.
    2012 City of Brandon Budget Highlights Dean Hammond, CMA City Treasurer and GM of Corporate Services December 6, 2011
  • 2.
    Agenda  Strategic Challenges Operating Challenges  2012 Opportunities  The Roadmap for Growth  The Nine Pillars  2012 Expenses  2012 Revenues  Final Thoughts on the 2012 Budget  Next Steps
  • 3.
    Strategic Challenges  Infrastructure How do we manage growth?  Physical Growth  Economic Growth  “Quality of Life” Growth  How do we best support our partners, e.g., The Keystone Centre?
  • 4.
    Operational Challenges  Four New Collective Agreements  Protective Services – Police, Fire, E-911  Transit – ATU  Infrastructure  Aging Equipment & A Need For Space  City Structure & Organizational Sustainability
  • 5.
    2012 Opportunities  Infrastructure – Asset Management  New Revenue Opportunities  Accommodation Tax  Sanitation  Greywater Recovery  Transit Strategy  Trenchless Technology  Landfill Gas Recovery  Potential Canada Games Bid  Performance Metrics / Performance Management
  • 6.
    The Roadmap forGrowth  “How to Manage Growth” is our Theme  Physical Growth  Economic Growth  Quality of Life Growth  10 Supporting Pillars
  • 7.
    Infrastructure Highlights  $150kfor Black Farm Study  $40k per year for Asset Management  $1.1mm for Major Reconstruction Projects  $500k for Street Resurfacing  $490k for Sidewalk & Curb Projects  Phase III of Industrial Wastewater Facility
  • 8.
    Infrastructure Highlights  $3.6mm Reserve Allocations for Infrastructure  $4.3mm Engineering Services  $826k - Street Maintenance  $400k - Domestic Sewer Mains  $295k – Domestic Sewer Services  $173k – Hydrants  $99k – Storm Sewers  $260k – Surface Drainage  $268k – Public Works Supervision  $549k – Water Mains  $858k – Water Meters  $599k – Water Services  $234k – Water Valves  $12.5mm Total
  • 9.
    Infrastructure Highlights  $35k for Sewer Leak Detection Equipment  $75k for Increased Sewer Inspections  $100k for Sewer Inspection Equipment  $50k for Manhole Restorations  $5k Pipe Freezing Equipment  $60k for Ditch Cleaning / Remediation  $35k for a Truck Mounted Sewer Cage  $50k for 4” Diesel Pump  Total - $410k
  • 10.
  • 11.
    Rural Outreach Highlights Explore Regionalization & Shared Services Opportunities.  Elton / Cornwallis Annexation Strategy
  • 12.
    Affordable Housing Highlights $250kappropriation for Affordable Housing Reserve  $293k grant for Manitoba Seniors Housing Co-op on McDiarmid Drive  $58k grant & support for Brandon Neighborhood Renewal Corp  $200k for Comprehensive Zoning By-Law
  • 13.
    Economic Development Highlights  $135k additional funding allocated to Economic Development Initiatives  Foreign Direct Investment Study  Excess Moisture Business Continuity Planning  $45k Keystone Centre Study  $200k allocated for 2017 Canada Games Study
  • 14.
    Downtown Hub Highlights Comprehensive Zoning By-law review  Renaissance District Secondary Plan  Demolition of Brandon Inn
  • 15.
    Environment Highlights  Landfill Gas Recovery  Permanent Hazardous Waste Depot  Water Conservation Strategy  Environmental Strategy Plan
  • 16.
    Culture & HeritageHighlights  $20k for Multi-Cultural Festival  $42k for Cultural Resource Center  $25k for Support of a Brandon Arts Council  $50k for Sculptures Program  Funding for Brandon Museum (TBD)
  • 17.
    Recreation Highlights  $4mm Commitment to YMCA Project  Joint Use Agreement with School Division  $45k commitment to School Division for maintenance / replacement of playgrounds  $215k Permanent Youth Center  $48k Community Centre Funding  $48k for Community Centre GAP Analysis  Recreation Strategy & Rec Centre Strategies
  • 18.
    Expenses by Category ExpenseCategory (000's) 2011 2012 $$ % Budget Budget Change Change Benefits 445 337 -108 -24.3% Capital Contribution 2,154 2,907 753 35.0% Contract Services 9,973 9,661 -312 -3.1% Debenture Debt Servicing Costs 4,122 4,239 117 2.8% Equipment Purchases 1,058 925 -133 -12.5% Grants and Contributions 4,759 5,514 754 15.8% Materials and Supplies 7,337 6,678 -660 -9.0% Other 3,361 4,484 1,123 33.4% Reserve Appropriation 10,289 10,492 203 2.0% Salaries and Wages 39,924 46,447 6,522 16.3% Transfers to/from Internal Accounts -3,569 -3,736 -167 4.7% Utilities 4,022 4,020 -1 0.0% Total 83,876 91,969 8,092 9.6%
  • 19.
    Revenues by Category RevenueCategory (000's) 2011 2012 $$ % Budget Budget Change Change Conditional Government Transfers 11,277 12,168 891 7.9% Other Income 4,242 5,001 760 17.9% Permits, Licenses and Fines 2,661 2,834 173 6.5% Property Taxes 33,112 39,840 6,728 20.3% Unconditional Government Transfers 8,088 8,363 275 3.4% User Fees and Sales of Goods 24,498 23,763 -735 -3.0% Total 83,876 91,969 8,092 9.6%
  • 20.
    Brandon’s Reality for2012 Expense Categories (000's) 2012 % of Budget Total Benefits 337 0.4% Capital Contribution 2,907 3.2% Debenture Debt Servicing Costs 4,239 4.6% Grants and Contributions 5,514 6.0% Reserve Appropriation 10,492 11.4% Salaries and Wages 46,447 50.5% Utilities 4,020 4.4% Discretionary Expenses 18,013 19.6% Total 91,969 100%
  • 21.
    Revenues by Category RevenueCategory (000's) 2011 2012 $$ % Budget Budget Change Change Conditional Government Transfers 11,277 12,168 891 7.9% Other Income 4,242 5,001 760 17.9% Permits, Licenses and Fines 2,661 2,834 173 6.5% Property Taxes 33,112 39,840 6,728 20.3% Unconditional Government Transfers 8,088 8,363 275 3.4% User Fees and Sales of Goods 24,498 23,763 -735 -3.0% Total 83,876 91,969 8,092 9.6%
  • 22.
    Next Steps  Council Deliberations December 9th & 10th  Interim 2012 budget presented to Council December 19th  Public Budget Consultation February / March 2012  Final Reading for 2012 Budget March 2012
  • 23.