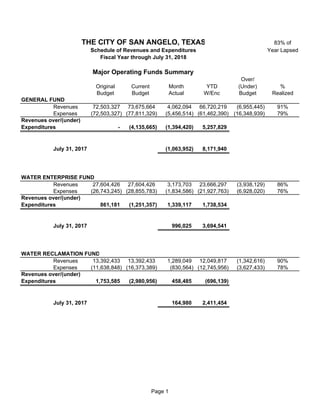
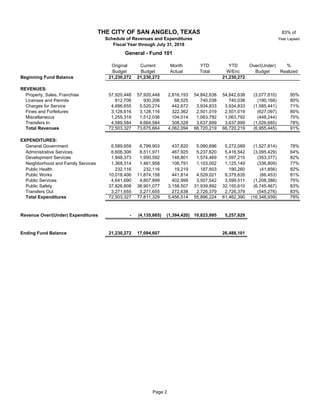
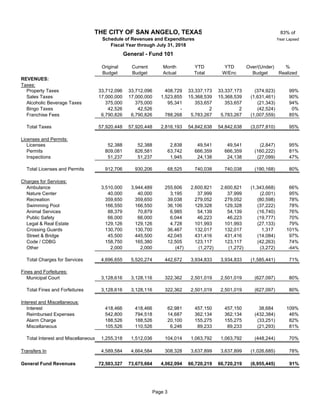
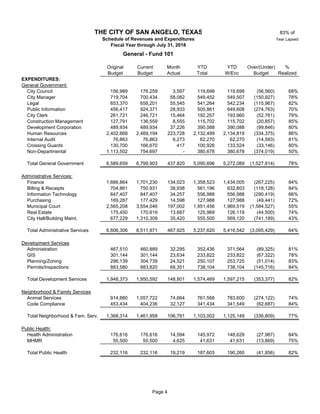
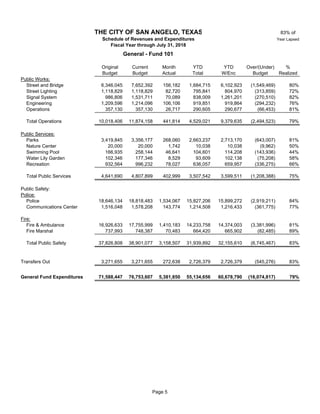
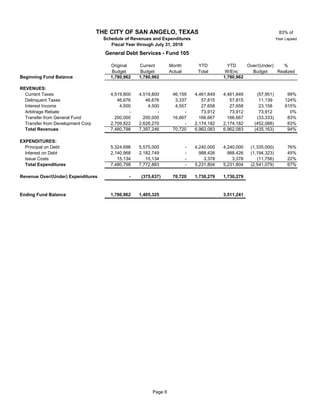
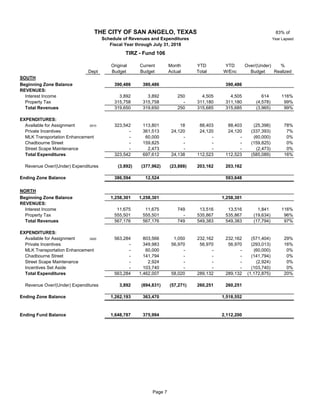
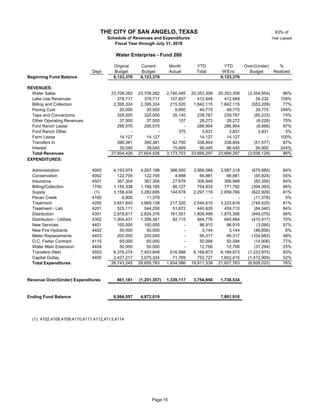
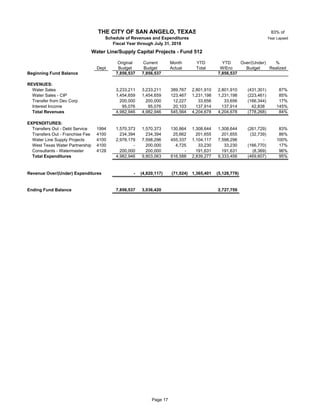
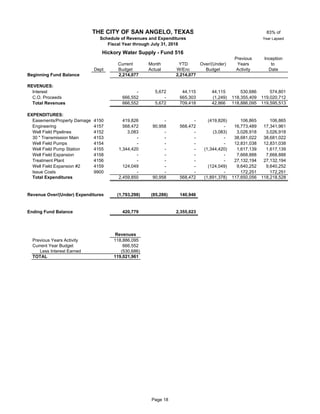
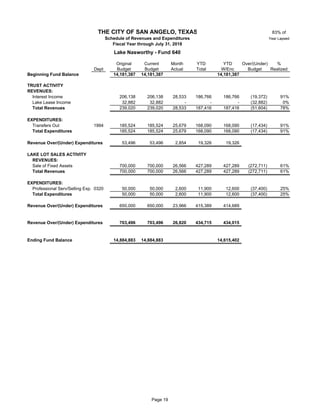
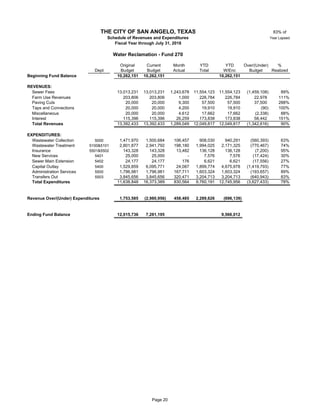
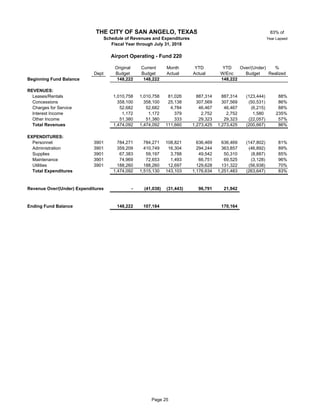
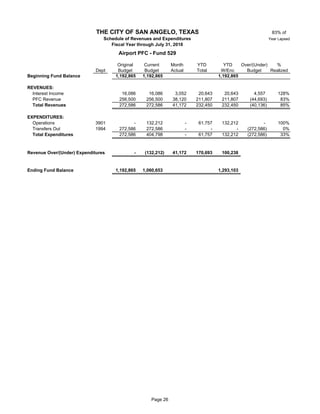
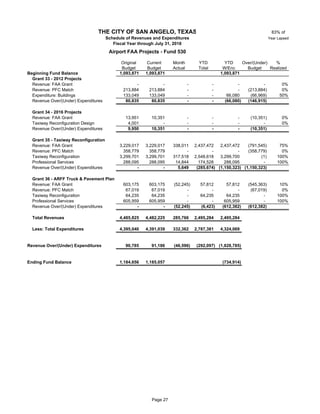
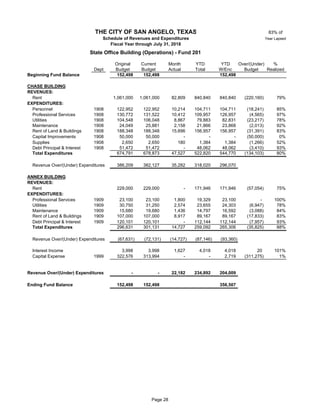
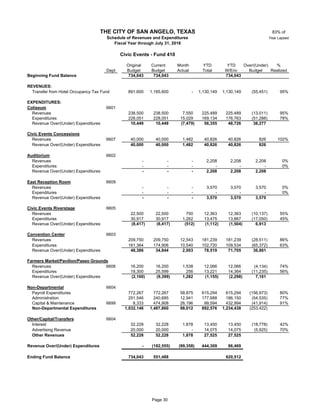
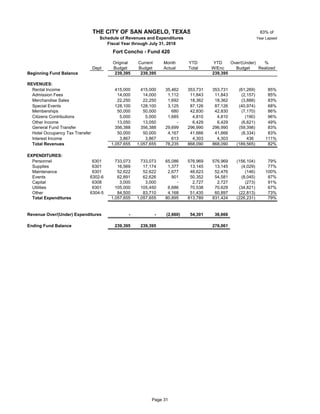
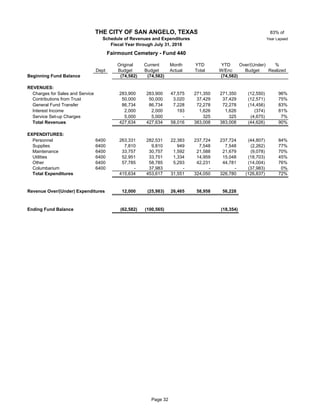
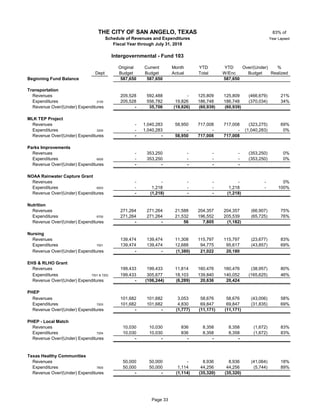
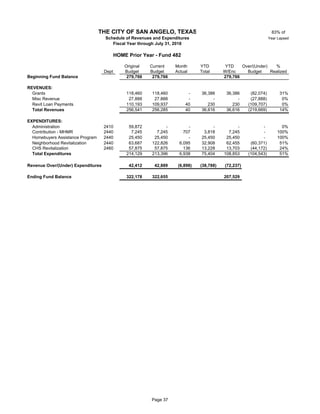
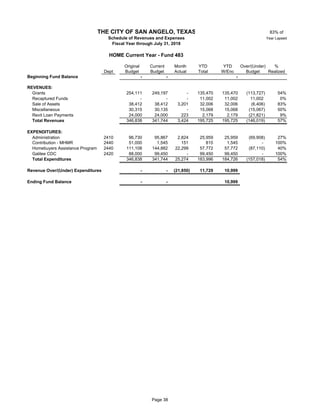
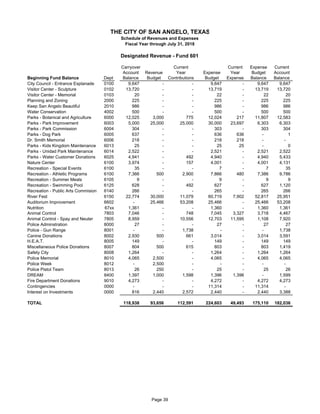
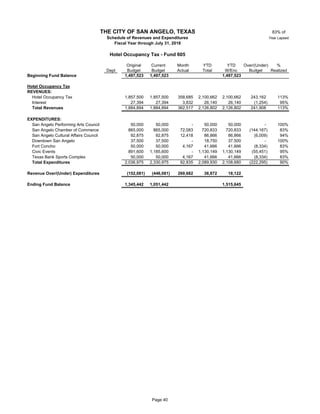
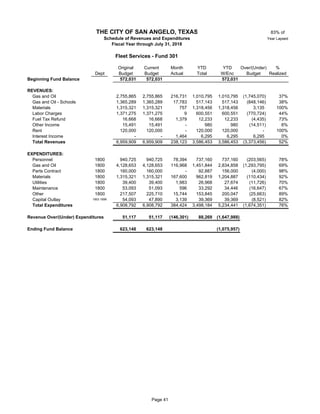
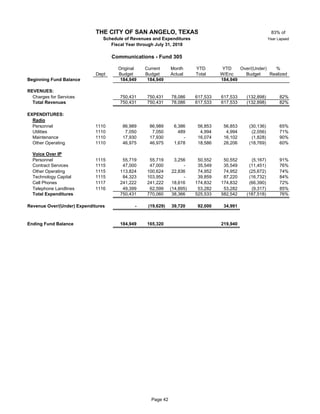
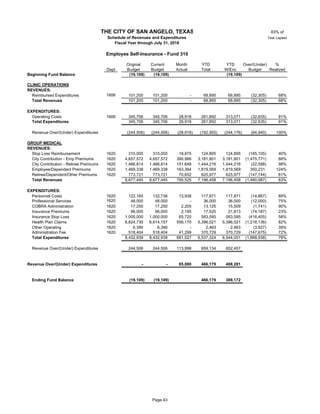
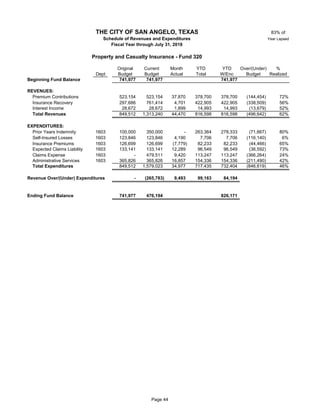
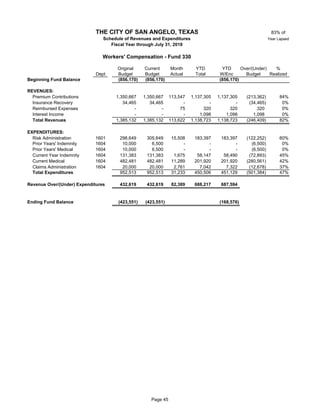
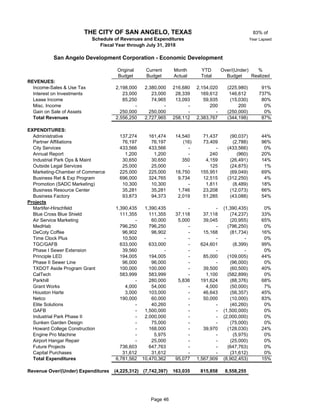
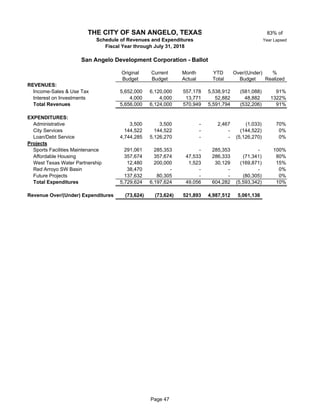
July 31, 2018
Page Accounting Contact Budget Contact
GENERAL
Major Operating Funds Summary 1
Fund 101 General 2-5 Asst Finance Director Budget Coordinator
Fund 105 General Debt Service 6 H. Ryan Gaddy Kimberly Holle
Fund 106 TIRZ 7 (325) 481-2649 (325) 657-4211
Fund 501 General Equipment Replacement 8
Fund 502 General Capital Projects 9
Certificate of Obligation Capital Projects Cash & Debt Analyst Budget Coordinator
Fund 514 2011A Tax/Revenue 10 Dale Hahn Kimberly Holle
Fund 517 2015 Certificate of Obligation 11 (325) 657-4251 (325) 657-4211
Fund 519 2016 Streets Certificate of Obligation 12
Fund 523 2017 Communications Certificate of Obligation 13
Fund 526 2018 Streets Certificate of Obligation 14
WATER / WATER RECLAMATION Senior Accountant Budget Analyst, Sr.
Fund 260 Water Enterprise 15 Jose Menchaca Moises Flores
Fund 261 Water Debt Service 16 (325) 481-1229 (325) 657-2757
Fund 512 Water Line/Supply Capital Project 17
Fund 516 Hickory Water Supply 18
Fund 640 Lake Nasworthy 19
Fund 270 Water Reclamation 20
Fund 271 Water Reclamation Debt Service 21
Fund 520 Water Reclamation Capital Projects 22
Fund 230 Solid Waste Enterprise 23
Fund 240 Storm Water 24
ENTERPRISE ACTIVITIES Asst Finance Director Budget Analyst, Sr.
Fund 220 Airport Operating 25 H. Ryan Gaddy Angela Bloss
Fund 529 Airport PFC 26 (325) 481-2649 (325) 653-6291
Fund 530 Airport FAA Projects 27
Fund 201 State Office Building Operations 28
Fund 203 Texas Bank Sports Complex 29
Fund 410 Civic Events 30
Fund 420 Fort Concho 31
Fund 440 Fairmount Cemetery 32
SPECIAL REVENUE FUNDS Cash & Debt Analyst Budget Analyst, Sr.
Fund 103 Intergovernmental 33-34 Dale Hahn Angela Bloss
Fund 452 Community Development Block Grant - Prior Year 35 (325) 657-4251 (325) 653-6291
Fund 453 Community Development Block Grant - Current Year 36
Fund 482 HOME - Prior Year 37
Fund 483 HOME - Current Year 38
Fund 601 Designated Revenue 39
Fund 605 Hotel Occupancy Tax 40
INTERNAL SERVICES Accountant Budget Analyst, Sr.
Fund 301 Fleet Services 41 Jonathan Flores Moises Flores
Fund 305 Communications 42 (325) 657-4401 (325) 657-2757
Fund 310 Health/Dental Insurance 43
Fund 320 Property and Casualty Insurance 44
Fund 330 Workers' Compensation 45
SAN ANGELO DEVELOPMENT CORPORATION Accountant Budget Coordinator
Economic Development 46 Jonathan Flores Kimberly Holle
Ballot 47 (325) 657-4401 (325) 657-4211
Table of Contents
THE CITY OF SAN ANGELO, TEXAS
Schedules of Revenues and Expenditures
Fiscal Year through July 31, 2018
83% of
Year Lapsed
Over/
Original Current Month YTD (Under) %
Budget Budget Actual W/Enc Budget Realized
GENERAL FUND
Revenues 72,503,327 73,675,664 4,062,094 66,720,219 (6,955,445) 91%
Expenses (72,503,327) (77,811,329) (5,456,514) (61,462,390) (16,348,939) 79%
Revenues over/(under)
Expenditures - (4,135,665) (1,394,420) 5,257,829
July 31, 2017 (1,063,952) 8,171,940
WATER ENTERPRISE FUND
Revenues 27,604,426 27,604,426 3,173,703 23,666,297 (3,938,129) 86%
Expenses (26,743,245) (28,855,783) (1,834,586) (21,927,763) (6,928,020) 76%
Revenues over/(under)
Expenditures 861,181 (1,251,357) 1,339,117 1,738,534
July 31, 2017 996,025 3,694,541
WATER RECLAMATION FUND
Revenues 13,392,433 13,392,433 1,289,049 12,049,817 (1,342,616) 90%
Expenses (11,638,848) (16,373,389) (830,564) (12,745,956) (3,627,433) 78%
Revenues over/(under)
Expenditures 1,753,585 (2,980,956) 458,485 (696,139)
July 31, 2017 164,980 2,411,454
THE CITY OF SAN ANGELO, TEXAS
Major Operating Funds Summary
Schedule of Revenues and Expenditures
Fiscal Year through July 31, 2018
Page 1
83% of
Year Lapsed
Original Current Month YTD YTD Over/(Under) %
Budget Budget Actual Total W/Enc Budget Realized
Beginning Fund Balance 21,230,272 21,230,272 21,230,272
REVENUES:
Property, Sales, Franchise 57,920,448 57,920,448 2,816,193 54,842,638 54,842,638 (3,077,810) 95%
Licenses and Permits 912,706 930,206 68,525 740,038 740,038 (190,168) 80%
Charges for Service 4,696,655 5,520,274 442,672 3,934,833 3,934,833 (1,585,441) 71%
Fines and Forfeitures 3,128,616 3,128,116 322,362 2,501,019 2,501,019 (627,097) 80%
Miscellaneous 1,255,318 1,512,036 104,014 1,063,792 1,063,792 (448,244) 70%
Transfers In 4,589,584 4,664,584 308,328 3,637,899 3,637,899 (1,026,685) 78%
Total Revenues 72,503,327 73,675,664 4,062,094 66,720,219 66,720,219 (6,955,445) 91%
EXPENDITURES:
General Government 6,589,659 6,799,903 437,820 5,090,696 5,272,089 (1,527,814) 78%
Administrative Services 6,606,306 8,511,971 467,925 5,237,620 5,416,542 (3,095,429) 64%
Development Services 1,948,373 1,950,592 148,801 1,574,469 1,597,215 (353,377) 82%
Neighborhood and Family Services 1,368,314 1,461,958 106,791 1,103,002 1,125,149 (336,809) 77%
Public Health 232,116 232,116 19,219 187,603 190,260 (41,856) 82%
Public Works 10,018,406 11,874,158 441,814 4,529,021 9,379,635 (66,453) 81%
Public Services 4,641,690 4,807,899 402,999 3,507,542 3,599,511 (1,208,388) 75%
Public Safety 37,826,808 38,901,077 3,158,507 31,939,892 32,155,610 (6,745,467) 83%
Transfers Out 3,271,655 3,271,655 272,638 2,726,379 2,726,379 (545,276) 83%
Total Expenditures 72,503,327 77,811,329 5,456,514 55,896,224 61,462,390 (16,348,939) 79%
Revenue Over/(Under) Expenditures - (4,135,665) (1,394,420) 10,823,995 5,257,829
Ending Fund Balance 21,230,272 17,094,607 26,488,101
THE CITY OF SAN ANGELO, TEXAS
Schedule of Revenues and Expenditures
Fiscal Year through July 31, 2018
General - Fund 101
Page 2
83% of
Year Lapsed
Original Current Month YTD YTD Over/(Under) %
Budget Budget Actual Total W/Enc Budget Realized
REVENUES:
Taxes:
Property Taxes 33,712,096 33,712,096 408,729 33,337,173 33,337,173 (374,923) 99%
Sales Taxes 10 17,000,000 17,000,000 1,523,855 15,368,539 15,368,539 (1,631,461) 90%
Alcoholic Beverage Taxes 10 375,000 375,000 95,341 353,657 353,657 (21,343) 94%
Bingo Taxes 10 42,526 42,526 - 2 2 (42,524) 0%
Franchise Fees 6,790,826 6,790,826 788,268 5,783,267 5,783,267 (1,007,559) 85%
Total Taxes 57,920,448 57,920,448 2,816,193 54,842,638 54,842,638 (3,077,810) 95%
Licenses and Permits:
Licenses 52,388 52,388 2,838 49,541 49,541 (2,847) 95%
Permits 809,081 826,581 63,742 666,359 666,359 (160,222) 81%
Inspections 51,237 51,237 1,945 24,138 24,138 (27,099) 47%
Total Licenses and Permits 912,706 930,206 68,525 740,038 740,038 (190,168) 80%
Charges for Services:
Ambulance 3,510,000 3,944,489 255,606 2,600,821 2,600,821 (1,343,668) 66%
Nature Center 10 40,000 40,000 3,195 37,999 37,999 (2,001) 95%
Recreation 359,650 359,650 39,038 279,052 279,052 (80,598) 78%
Swimming Pool 166,550 166,550 36,106 129,328 129,328 (37,222) 78%
Animal Services 88,379 70,879 6,985 54,139 54,139 (16,740) 76%
Public Safety 66,000 66,000 6,044 46,223 46,223 (19,777) 70%
Legal & Real Estate 129,126 129,126 4,728 101,993 101,993 (27,133) 79%
Crossing Guards 10 130,700 130,700 36,467 132,017 132,017 1,317 101%
Street & Bridge 10 45,500 445,500 42,045 431,416 431,416 (14,084) 97%
Code / CDBG 10 158,750 165,380 12,505 123,117 123,117 (42,263) 74%
Other 2,000 2,000 (47) (1,272) (1,272) (3,272) -64%
Total Charges for Services 4,696,655 5,520,274 442,672 3,934,833 3,934,833 (1,585,441) 71%
Fines and Forfeitures:
Municipal Court 3,128,616 3,128,116 322,362 2,501,019 2,501,019 (627,097) 80%
Total Fines and Forfeitures 3,128,616 3,128,116 322,362 2,501,019 2,501,019 (627,097) 80%
Interest and Miscellaneous:
Interest 418,466 418,466 62,981 457,150 457,150 38,684 109%
Reimbursed Expenses 542,800 794,518 14,687 362,134 362,134 (432,384) 46%
Alarm Charge 10 188,526 188,526 20,100 155,275 155,275 (33,251) 82%
Miscellaneous 105,526 110,526 6,246 89,233 89,233 (21,293) 81%
Total Interest and Miscellaneous 1,255,318 1,512,036 104,014 1,063,792 1,063,792 (448,244) 70%
Transfers In 4,589,584 4,664,584 308,328 3,637,899 3,637,899 (1,026,685) 78%
General Fund Revenues 72,503,327 73,675,664 4,062,094 66,720,219 66,720,219 (6,955,445) 91%
THE CITY OF SAN ANGELO, TEXAS
Schedule of Revenues and Expenditures
Fiscal Year through July 31, 2018
General - Fund 101
Page 3
83% of
Year Lapsed
Original Current Month YTD YTD Over/(Under) %
Budget Budget Actual Total W/Enc Budget Realized
EXPENDITURES:
General Government:
City Council 156,989 176,259 3,597 119,699 119,699 (56,560) 68%
City Manager 719,704 700,434 58,082 549,452 549,507 (150,927) 78%
Legal 653,370 658,201 55,545 541,264 542,234 (115,967) 82%
Public Information 456,417 924,371 28,933 505,861 649,608 (274,763) 70%
City Clerk 261,721 246,721 15,464 192,257 193,960 (52,761) 79%
Construction Management 127,791 136,559 8,555 115,702 115,702 (20,857) 85%
Development Corporation 489,934 489,934 37,226 390,088 390,088 (99,846) 80%
Human Resources 2,402,668 2,469,194 223,728 2,132,499 2,134,819 (334,375) 86%
Internal Audit 76,863 76,863 6,273 62,270 62,270 (14,593) 81%
Crossing Guards 130,700 166,670 417 100,926 133,524 (33,146) 80%
Non-Departmental 1,113,502 754,697 - 380,678 380,678 (374,019) 50%
Total General Government 6,589,659 6,799,903 437,820 5,090,696 5,272,089 (1,527,814) 78%
Administrative Services:
Finance 1,666,864 1,701,230 134,023 1,358,523 1,434,005 (267,225) 84%
Billing & Receipts 704,861 750,931 38,938 561,196 632,803 (118,128) 84%
Information Technology 647,407 847,407 34,257 556,988 556,988 (290,419) 66%
Purchasing 169,287 177,429 14,598 127,988 127,988 (49,441) 72%
Municipal Court 2,565,208 3,554,046 197,002 1,951,456 1,969,519 (1,584,527) 55%
Real Estate 175,450 170,619 13,687 125,969 126,119 (44,500) 74%
City Hall/Building Maint. 677,229 1,310,309 35,420 555,500 569,120 (741,189) 43%
Total Administrative Services 6,606,306 8,511,971 467,925 5,237,620 5,416,542 (3,095,429) 64%
Development Services
Administration 467,510 460,889 32,295 352,436 371,564 (89,325) 81%
GIS 301,144 301,144 23,634 233,822 233,822 (67,322) 78%
Planning/Zoning 296,139 304,739 24,521 250,107 253,725 (51,014) 83%
Permits/Inspections 883,580 883,820 68,351 738,104 738,104 (145,716) 84%
Total Development Services 1,948,373 1,950,592 148,801 1,574,469 1,597,215 (353,377) 82%
Neighborhood & Family Services
Animal Services 914,880 1,057,722 74,664 761,568 783,600 (274,122) 74%
Code Compliance 453,434 404,236 32,127 341,434 341,549 (62,687) 84%
Total Neighborhood & Fam. Serv. 1,368,314 1,461,958 106,791 1,103,002 1,125,149 (336,809) 77%
Public Health:
Health Administration 176,616 176,616 14,594 145,972 148,629 (27,987) 84%
MHMR 10 55,500 55,500 4,625 41,631 41,631 (13,869) 75%
Total Public Health 232,116 232,116 19,219 187,603 190,260 (41,856) 82%
THE CITY OF SAN ANGELO, TEXAS
Schedule of Revenues and Expenditures
Fiscal Year through July 31, 2018
General - Fund 101
Page 4
83% of
Year Lapsed
Original Current Month YTD YTD Over/(Under) %
Budget Budget Actual Total W/Enc Budget Realized
Public Works:
Street and Bridge 6,346,045 7,652,392 156,182 1,684,715 6,102,923 (1,549,469) 80%
Street Lighting 10 1,118,829 1,118,829 82,720 795,841 804,970 (313,859) 72%
Signal System 986,806 1,531,711 70,089 838,009 1,261,201 (270,510) 82%
Engineering 1,209,596 1,214,096 106,106 919,851 919,864 (294,232) 76%
Operations 357,130 357,130 26,717 290,605 290,677 (66,453) 81%
Total Operations 10,018,406 11,874,158 441,814 4,529,021 9,379,635 (2,494,523) 79%
Public Services:
Parks 3,419,845 3,356,177 268,060 2,663,237 2,713,170 (643,007) 81%
Nature Center 10 20,000 20,000 1,742 10,038 10,038 (9,962) 50%
Swimming Pool 166,935 258,144 46,641 104,601 114,208 (143,936) 44%
Water Lily Garden 10 102,346 177,346 8,529 93,609 102,138 (75,208) 58%
Recreation 932,564 996,232 78,027 636,057 659,957 (336,275) 66%
Total Public Services 4,641,690 4,807,899 402,999 3,507,542 3,599,511 (1,208,388) 75%
Public Safety:
Police:
Police 18,646,134 18,818,483 1,534,067 15,827,206 15,899,272 (2,919,211) 84%
Communications Center 1,516,048 1,578,208 143,774 1,214,508 1,216,433 (361,775) 77%
Fire:
Fire & Ambulance 16,926,633 17,755,999 1,410,183 14,233,758 14,374,003 (3,381,996) 81%
Fire Marshal 737,993 748,387 70,483 664,420 665,902 (82,485) 89%
Total Public Safety 37,826,808 38,901,077 3,158,507 31,939,892 32,155,610 (6,745,467) 83%
Transfers Out 3,271,655 3,271,655 272,638 2,726,379 2,726,379 (545,276) 83%
General Fund Expenditures 71,588,447 76,753,607 5,381,850 55,134,656 60,678,790 (16,074,817) 79%
THE CITY OF SAN ANGELO, TEXAS
Schedule of Revenues and Expenditures
Fiscal Year through July 31, 2018
General - Fund 101
Page 5
83% of
Year Lapsed
Original Current Month YTD YTD Over/(Under) %
Budget Budget Actual Total W/Enc Budget Realized
Beginning Fund Balance 1,780,962 1,780,962 1,780,962
REVENUES:
Current Taxes 10 4,519,800 4,519,800 46,159 4,461,849 4,461,849 (57,951) 99%
Delinquent Taxes 10 46,676 46,676 3,337 57,815 57,815 11,139 124%
Interest Income 4,500 4,500 4,557 27,658 27,658 23,158 615%
Arbitrage Rebate 10 - - - 73,912 73,912 73,912 0%
Transfer from General Fund 10 200,000 200,000 16,667 166,667 166,667 (33,333) 83%
Transfer from Development Corp 10 2,709,822 2,626,270 - 2,174,182 2,174,182 (452,088) 83%
Total Revenues 7,480,798 7,397,246 70,720 6,962,083 6,962,083 (435,163) 94%
EXPENDITURES:
Principal on Debt 10 5,324,696 5,575,000 - 4,240,000 4,240,000 (1,335,000) 76%
Interest on Debt 10 2,140,968 2,182,749 - 988,426 988,426 (1,194,323) 45%
Issue Costs 10 15,134 15,134 - 3,378 3,378 (11,756) 22%
Total Expenditures 7,480,798 7,772,883 - 5,231,804 5,231,804 (2,541,079) 67%
Revenue Over/(Under) Expenditures - (375,637) 70,720 1,730,279 1,730,279
Ending Fund Balance 1,780,962 1,405,325 3,511,241
THE CITY OF SAN ANGELO, TEXAS
Schedule of Revenues and Expenditures
Fiscal Year through July 31, 2018
General Debt Services - Fund 105
Page 6
83% of
Year Lapsed
Original Current Month YTD YTD Over/(Under) %
Dept Budget Budget Actual Total W/Enc Budget Realized
SOUTH
Beginning Zone Balance 390,486 390,486 390,486
REVENUES:
Interest Income 3,892 3,892 250 4,505 4,505 614 116%
Property Tax 10 315,758 315,758 - 311,180 311,180 (4,578) 99%
Total Revenues 319,650 319,650 250 315,685 315,685 (3,965) 99%
EXPENDITURES:
Available for Assignment 2910 323,542 113,801 18 88,403 88,403 (25,398) 78%
Private Incentives 10 - 361,513 24,120 24,120 24,120 (337,393) 7%
MLK Transportation Enhancement 10 - 60,000 - - - (60,000) 0%
Chadbourne Street 10 - 159,825 - - - (159,825) 0%
Street Scape Maintenance 10 - 2,473 - - - (2,473) 0%
Total Expenditures 323,542 697,612 24,138 112,523 112,523 (585,089) 16%
Revenue Over/(Under) Expenditures (3,892) (377,962) (23,888) 203,162 203,162
Ending Zone Balance 386,594 12,524 593,648
NORTH
Beginning Zone Balance 1,258,301 1,258,301 1,258,301
REVENUES:
Interest Income 11,675 11,675 749 13,516 13,516 1,841 116%
Property Tax 10 555,501 555,501 - 535,867 535,867 (19,634) 96%
Total Revenues 567,176 567,176 749 549,383 549,383 (17,794) 97%
EXPENDITURES:
Available for Assignment 2920 563,284 803,566 1,050 232,162 232,162 (571,404) 29%
Private Incentives 10 - 349,983 56,970 56,970 56,970 (293,013) 16%
MLK Transportation Enhancement 10 - 60,000 - - - (60,000) 0%
Chadbourne Street 10 - 141,794 - - - (141,794) 0%
Street Scape Maintenance 10 - 2,924 - - - (2,924) 0%
Incentives Set Aside 10 - 103,740 - - - (103,740) 0%
Total Expenditures 563,284 1,462,007 58,020 289,132 289,132 (1,172,875) 20%
Revenue Over/(Under) Expenditures 3,892 (894,831) (57,271) 260,251 260,251
Ending Zone Balance 1,262,193 363,470 1,518,552
Ending Fund Balance 1,648,787 375,994 2,112,200
THE CITY OF SAN ANGELO, TEXAS
Schedule of Revenues and Expenditures
Fiscal Year through July 31, 2018
TIRZ - Fund 106
Page 7
83% of
Year Lapsed
Original Current Month YTD YTD Over/(Under) %
Dept Budget Budget Actual Total W/Enc Budget Realized
Beginning Fund Balance 349,018 349,018 349,018
REVENUES:
Equipment Reserve:
Sales of Fixed Assets 110,000 110,000 - 35,910 35,910 (74,090) 33%
Insurance Proceeds 50 40,000 40,000 - 32,596 32,596 (7,404) 81%
Interest Income - - 893 3,938 3,938 3,938 0%
Transfer from General Fund 50 1,201,373 1,201,373 100,114 1,001,144 1,001,144 (200,229) 83%
Total Revenues 1,351,373 1,351,373 101,007 1,073,588 1,073,588 (277,785) 79%
EXPENDITURES:
Equipment Reserve:
Municipal Court Capital 1300 50 - 40,000 - 30,670 30,676 (9,324) 77%
Street & Bridge Capital 3200 - 555,270 - 547,262 547,262 (8,008) 99%
Parks Capital 6000 - 32,000 4,715 30,032 30,032 (1,968) 94%
Code Compliance Capital 7500 - 25,000 - 23,214 23,214 (1,786) 93%
Animal Services Capital 7803 50 - 90,000 225 77,643 77,643 (12,357) 86%
Police Capital 8000 50 - 535,215 - 405,591 455,425 (79,790) 85%
Ambulance Capital 9100 50 - 250,000 165,070 232,061 240,427 (9,573) 96%
Fire Marshal 9300 50 - 32,000 4,079 30,337 30,337 (1,663) 95%
Contingencies 9900 50 1,351,373 47,234 - - - (47,234) 0%
Total Expenditures 1,351,373 1,606,719 174,089 1,376,810 1,435,016 (171,703) 89%
Revenue Over/(Under) Expenditures - (255,346) (73,082) (303,222) (361,428)
Ending Fund Balance 349,018 93,672 (12,410)
General Equipment Replacement - Fund 501
THE CITY OF SAN ANGELO, TEXAS
Schedule of Revenues and Expenditures
Fiscal Year through July 31, 2018
Page 8
83% of
Year Lapsed
Original Current Month YTD YTD Over/(Under) %
Dept Budget Budget Actual Total W/Enc Budget Realized
Beginning Fund Balance 4,038,114 4,038,114 4,038,114
REVENUES:
Interest Income 5,705 5,705 10,226 38,846 38,846 33,141 681%
Auditorium Donations 50 - 3,906,685 3,512,555 3,906,685 3,906,685 - 100%
Interfund Transfers 244,295 244,295 20,358 203,579 203,579 (40,716) 83%
Total Revenues 250,000 4,156,685 3,543,139 4,149,110 4,149,110 (7,575) 100%
EXPENDITURES:
City Hall Improvements 1901 50 - 198,051 747 11,252 11,252 (186,799) 6%
City Hall Campus/Grounds 1920 - 2,552 - 1,534 1,534 (1,018) 60%
Transportation Enhancement 2020 50 - 50,117 - 59,997 69,877 19,760 139%
Street Maintenance 3200 50 - 49,358 - 49,356 49,356 (2) 100%
Stormwater - Ave P Drainage 5800 50 - 2,080,000 3,203 741,507 820,172 (1,259,828) 39%
City Dog Park 6005 50 - 7,551 - 7,551 7,551 - 100%
Texas Sports Bank Complex 6019 50 - 659,908 39,316 67,866 433,718 (226,190) 66%
29th Street Sports Complex 6107 50 - 1,681,502 - 64,694 183,135 (1,498,367) 11%
Fort Concho 6301 50 - 877,436 - 115,000 236,562 (640,874) 27%
Fairmount Cemetery 6400 50 - 2,846 - - - (2,846) 0%
Auditorium 6602 50 - 1,042,699 - 1,037,031 1,041,699 (1,000) 100%
Fire Station 9000 50 - 148,320 8,000 8,000 8,000 (140,320) 5%
Fire Truck 9000 50 250,000 1,249,991 12,006 12,006 1,110,600 (139,391) 89%
Total Expenditures 250,000 8,050,331 63,272 2,175,794 3,973,456 (4,076,875) 49%
Revenue Over/(Under) Expenditures - (3,893,646) 3,479,867 1,973,316 175,654
Ending Fund Balance 4,038,114 144,468 4,213,768
THE CITY OF SAN ANGELO, TEXAS
Schedule of Revenues and Expenditures
Fiscal Year through July 31, 2018
General Capital Projects - Fund 502
Page 9
Previous Inception
Current Month YTD Over/(Under) Years to
Dept Budget Actual W/Enc Budget Activity Date
Beginning Fund Balance 1,083,888 1,083,888
REVENUES:
C.O. Proceeds - - - - 13,780,000 13,780,000
Municipal Pool Donation - - - - 21,225 21,225
SASSRA Stock Barn 51 - - - - 157,722 157,722
Transfer from Dev. Corp. - - - - 4,220,000 4,220,000
Interest Income - 2,773 18,679 18,679 145,771 164,450
Total Revenues - 2,773 18,679 18,679 18,324,718 18,343,397
EXPENDITURES:
Airport Terminal Rehab 3925 51 - - - - 500,000 500,000
Concho River 4119 51 327,650 - 41,179 (286,471) 8,272,352 8,313,531
Parks 6000 51 585,535 28,554 135,697 (449,838) 339,465 475,162
Red Arroyo Trail 6040 51 - - - - 325,000 325,000
Recreation 6100 75,000 - - (75,000) 2,597,817 2,597,817
Fort Concho Improvements 6301 51 61,892 - 61,892 - 38,109 100,001
Auditorium 6602 51 - - - - 3,750,001 3,750,001
Fairgrounds 6636 51 - - - - 1,157,722 1,157,722
Issue Costs 9900 51 - - - - 260,363 260,363
Total Expenditures 1,050,077 28,554 238,768 (811,309) 17,240,829 17,479,597
Revenue Over/(Under) Expenditures (1,050,077) (25,781) (220,089)
Ending Fund Balance 33,811 863,799
THE CITY OF SAN ANGELO, TEXAS
Schedule of Revenues and Expenditures
Fiscal Year through July 31, 2018
2011A Tax/Revenue C.O. - Fund 514
Debt Payments Through 2024
For Airport, Ft. Concho, and Parks Improvements
Page 10
Previous Inception
Current Month YTD Over/(Under) Years to
Dept Budget Actual W/Enc Budget Activity Date
Beginning Fund Balance 5,180,490 5,180,490
REVENUES:
C.O. Proceeds 51 - - - - 13,260,000 13,260,000
Reoffering Premium 51 - - - - 381,008 381,008
Replacement Proceeds 51 - - - - 1,000,000 1,000,000
Interest Income 51 - 13,256 72,295 72,295 121,510 193,805
Total Revenues - 13,256 72,295 72,295 14,762,518 14,834,813
EXPENDITURES:
Police Communications Upgrade 1110 116,356 10,000 59,000 (57,356) 1,443,646 1,502,646
Public Safety Radio 1501 51 796,688 - 775,319 (21,369) 5,077,152 5,852,471
Fire Station 4 9000 51 3,145,940 127,016 3,088,597 (57,343) 120,221 3,208,818
Fire Training Center 9010 51 - - - - 2,800,001 2,800,001
Issue Costs 9900 51 - - - - 141,008 141,008
Total Expenditures 4,058,984 137,016 3,922,916 (136,068) 9,582,028 13,504,944
Revenue Over/(Under) Expenditures (4,058,984) (123,760) (3,850,621)
Ending Fund Balance 1,121,506 1,329,869
Debt Payments Through 2035
THE CITY OF SAN ANGELO, TEXAS
Schedule of Revenues and Expenditures
Fiscal Year through July 31, 2018
2015 Certificate of Obligation - Fund 517
For Public Safety Facilities and Communication Upgrades
Page 11
Previous Inception
Current Month YTD Over/(Under) Years to
Dept Budget Actual W/Enc Budget Activity Date
Beginning Fund Balance 11,922,225 11,922,225
REVENUES:
C.O. Proceeds 51 - - - - 15,615,000 15,615,000
Reoffering Premium 51 - - - - 538,531 538,531
Interest Income 51 - 30,507 181,508 181,508 194,072 375,580
Total Revenues - 30,507 181,508 181,508 16,347,603 16,529,111
EXPENDITURES:
Street Construction 3200 11,728,153 212,867 11,666,597 (61,556) 4,271,847 15,938,444
Issue Costs 9900 51 - - - - 153,531 153,531
Total Expenditures 11,728,153 212,867 11,666,597 (61,556) 4,425,378 16,091,975
Revenue Over/(Under) Expenditures (11,728,153) (182,360) (11,485,089)
Ending Fund Balance 194,072 437,136
Debt Payments Through 2036
THE CITY OF SAN ANGELO, TEXAS
Schedule of Revenues and Expenditures
Fiscal Year through July 31, 2018
2016 Streets Certificate of Obligation - Fund 519
For Street Improvements
Page 12
Previous Inception
Current Month YTD Over/(Under) Years to
Dept Budget Actual W/Enc Budget Activity Date
Beginning Fund Balance 1,764,580 1,764,580
REVENUES:
C.O. Proceeds 52 - - - - 2,185,000 2,185,000
Reoffering Premium 52 - - - - 31,365 31,365
Interest Income 52 - 4,515 25,381 25,381 8,695 34,076
Total Revenues - 4,515 25,381 25,381 2,225,060 2,250,441
EXPENDITURES:
Communications Software 1500 1,755,886 - 785,230 (970,656) 404,115 1,189,345
Issue Costs 9900 52 - - - - 56,365 56,365
Total Expenditures 1,755,886 - 785,230 (970,656) 460,480 1,245,710
Revenue Over/(Under) Expenditures (1,755,886) 4,515 (759,849)
Ending Fund Balance 8,694 1,004,731
Debt Payments through 2024
THE CITY OF SAN ANGELO, TEXAS
Schedule of Revenues and Expenditures
Fiscal Year through July 31, 2018
2017 Communications Certificate of Obligation - Fund 523
For Communications Upgrades
Page 13
Previous Inception
Current Month YTD Over/(Under) Years to
Dept Budget Actual W/Enc Budget Activity Date
Beginning Fund Balance - -
REVENUES:
C.O. Proceeds 52 16,500,000 - 16,500,000 - - 16,500,000
Reoffering Premium 52 167,856 - 167,856 - - 167,856
Interest Income 52 - - - - - -
Total Revenues 16,667,856 - 16,667,856 - - 16,667,856
EXPENDITURES:
Street Construction 3200 16,504,106 - 3,413,702 (13,090,404) - 3,413,702
Issue Costs 9900 52 163,750 - 163,750 - - 163,750
Total Expenditures 16,667,856 - 3,577,452 (13,090,404) - 3,577,452
Revenue Over/(Under) Expenditures - - 13,090,404
Ending Fund Balance - 13,090,404
Debt Payments through 2038
THE CITY OF SAN ANGELO, TEXAS
Schedule of Revenues and Expenditures
Fiscal Year through July 31, 2018
2018 Streets Certificate of Obligation - Fund 526
For Street Improvements
Page 14
83% of
Year Lapsed
Original Current Month YTD YTD Over/(Under) %
Dept Budget Budget Actual Total W/Enc Budget Realized
Beginning Fund Balance 6,123,376 6,123,376 6,123,376
REVENUES:
Water Sales 26 23,708,262 23,708,262 2,746,485 20,353,308 20,353,308 (3,354,954) 86%
Lake Use Revenues 378,717 378,717 107,807 412,949 412,949 34,232 109%
Billing and Collection 2,395,324 2,395,324 215,520 1,842,115 1,842,115 (553,209) 77%
Paving Cuts 26 20,000 20,000 9,850 49,775 49,775 29,775 249%
Taps and Connections 325,000 325,000 35,140 239,767 239,767 (85,233) 74%
Other Operating Revenues 37,500 37,500 107 28,272 28,272 (9,228) 75%
Ford Ranch Lease 26 295,570 295,570 - 286,904 286,904 (8,666) 97%
Ford Ranch Other 26 - - 375 3,831 3,831 3,831 0%
Farm Lease 26 14,127 14,127 - 14,127 14,127 - 100%
Transfers In 390,381 390,381 42,750 338,804 338,804 (51,577) 87%
Interest 39,545 39,545 15,669 96,445 96,445 56,900 244%
Total Revenues 27,604,426 27,604,426 3,173,703 23,666,297 23,666,297 (3,938,129) 86%
EXPENDITURES:
Administration 4000 4,193,974 4,267,198 366,000 3,566,068 3,587,318 (679,880) 84%
Conservation 4002 122,705 122,705 4,688 66,881 66,881 (55,824) 55%
Insurance 4501 367,304 367,304 27,678 306,948 306,948 (60,356) 84%
Billing/Collection 1700 1,155,338 1,166,185 90,127 754,833 771,792 (394,393) 66%
Supply (1) 3,158,434 3,282,695 144,678 2,297,118 2,659,766 (622,929) 81%
Pecan Creek 4160 26 6,800 11,378 - - - (11,378) 0%
Treatment 4200 3,651,840 3,969,139 217,320 2,544,610 3,223,619 (745,520) 81%
Treatment - Lab 4201 525,111 544,250 51,672 440,835 459,710 (84,540) 84%
Distribution 4301 2,978,817 2,824,376 161,551 1,808,499 1,875,306 (949,070) 66%
Distribution - Utilities 4302 1,304,431 1,356,381 82,115 944,776 945,964 (410,417) 70%
New Services 4401 26 100,000 100,000 - 96,910 96,910 (3,090) 97%
New Fire Hydrants 4402 26 50,000 50,000 - 3,144 3,144 (46,856) 6%
Meter Replacements 4403 26 200,000 200,000 - 95,317 95,317 (104,683) 48%
O.C. Fisher Contract 4115 26 65,000 65,000 - 50,094 50,094 (14,906) 77%
Water Main Extension 4404 26 50,000 50,000 - 12,706 12,706 (37,294) 25%
Transfers (Net) 4503 6,376,274 7,403,848 616,988 6,169,873 6,169,873 (1,233,975) 83%
Capital Outlay 4400 2,437,217 3,075,324 71,769 752,727 1,602,415 (1,472,909) 52%
Total Expenditures 26,743,245 28,855,783 1,834,586 19,911,339 21,927,763 (6,928,020) 76%
Revenue Over/(Under) Expenditures 861,181 (1,251,357) 1,339,117 3,754,958 1,738,534
Ending Fund Balance 6,984,557 4,872,019 7,861,910
(1): 4102,4108,4109,4110,4111,4112,4113,4114
THE CITY OF SAN ANGELO, TEXAS
Schedule of Revenues and Expenditures
Fiscal Year through July 31, 2018
Water Enterprise - Fund 260
Page 15
83% of
Year Lapsed
Original Current Month YTD YTD Over/(Under) %
Dept Budget Budget Actual Total W/Enc Budget Realized
Beginning Fund Balance 19,060 19,060 19,060
REVENUES:
Transfer In 11,474,221 11,474,221 747,851 9,978,517 9,978,517 (1,495,704) 87%
Interest Income - - - 31,970 31,970 31,970 0%
Total Revenues 11,474,221 11,474,221 747,851 10,010,487 10,010,487 (1,463,734) 87%
EXPENDITURES:
Principal 5301 26 8,231,960 8,231,960 - 8,231,960 8,231,960 - 100%
Interest 5301 26 3,236,552 3,236,552 - 1,634,187 1,634,187 (1,602,365) 50%
Issue Costs 5301 26 5,709 5,612 - (1,020) (1,020) (6,632) -18%
Total Expenditures 11,474,221 11,474,124 - 9,865,127 9,865,127 (1,608,997) 86%
Revenue Over/(Under) Expenditures - 97 747,851 145,360 145,360
Ending Fund Balance 19,060 19,157 164,420
THE CITY OF SAN ANGELO, TEXAS
Schedule of Revenues and Expenditures
Fiscal Year through July 31, 2018
Water Debt Service - Fund 261
Page 16
83% of
Year Lapsed
Original Current Month YTD YTD Over/(Under) %
Dept Budget Budget Actual Total W/Enc Budget Realized
Beginning Fund Balance 7,856,537 7,856,537 7,856,537
REVENUES: 512‐4021‐343.10‐00
Water Sales 51 3,233,211 3,233,211 389,767 2,801,910 2,801,910 (431,301) 87%
Water Sales - CIP 51 1,454,659 1,454,659 123,467 1,231,198 1,231,198 (223,461) 85%
Transfer from Dev Corp 51 200,000 200,000 12,227 33,656 33,656 (166,344) 17%
Interest Income 95,076 95,076 20,103 137,914 137,914 42,838 145%
Total Revenues 4,982,946 4,982,946 545,564 4,204,678 4,204,678 (778,268) 84%
EXPENDITURES:
Transfers Out - Debt Service 1994 51 1,570,373 1,570,373 130,864 1,308,644 1,308,644 (261,729) 83%
Transfers Out - Franchise Fee 4100 51 234,394 234,394 25,662 201,655 201,655 (32,739) 86%
Water Line Supply Projects 4100 51 2,978,179 7,598,296 455,337 1,104,117 7,598,296 - 100%
West Texas Water Partnership 4100 51 - 200,000 4,725 33,230 33,230 (166,770) 17%
Consultants - Watermaster 4128 51 200,000 200,000 - 191,631 191,631 (8,369) 96%
Total Expenditures 4,982,946 9,803,063 616,588 2,839,277 9,333,456 (469,607) 95%
Revenue Over/(Under) Expenditures - (4,820,117) (71,024) 1,365,401 (5,128,778)
Ending Fund Balance 7,856,537 3,036,420 2,727,759
THE CITY OF SAN ANGELO, TEXAS
Schedule of Revenues and Expenditures
Fiscal Year through July 31, 2018
Water Line/Supply Capital Projects - Fund 512
Page 17
83% of
Year Lapsed
Previous Inception
Current Month YTD Over/(Under) Years to
Dept Budget Actual W/Enc Budget Activity Date
Beginning Fund Balance 2,214,077 2,214,077
REVENUES:
Interest - 5,672 44,115 44,115 530,686 574,801
C.O. Proceeds 51 666,552 - 665,303 (1,249) 118,355,409 119,020,712
Total Revenues 666,552 5,672 709,418 42,866 118,886,095 119,595,513
EXPENDITURES:
Easements/Property Damage 4150 51 419,826 - - (419,826) 106,865 106,865
Engineering 4157 51 568,472 90,958 568,472 - 16,773,489 17,341,961
Well Field Pipelines 4152 51 3,083 - - (3,083) 3,026,918 3,026,918
30 " Transmission Main 4153 51 - - - - 38,681,022 38,681,022
Well Field Pumps 4154 51 - - - - 12,831,038 12,831,038
Well Field Pump Station 4155 51 1,344,420 - - (1,344,420) 1,617,139 1,617,139
Well Field Expansion 4158 51 - - - - 7,668,888 7,668,888
Treatment Plant 4156 51 - - - - 27,132,194 27,132,194
Well Field Expansion #2 4159 51 124,049 - - (124,049) 9,640,252 9,640,252
Issue Costs 9900 - - - - 172,251 172,251
Total Expenditures 2,459,850 90,958 568,472 (1,891,378) 117,650,056 118,218,528
Revenue Over/(Under) Expenditures (1,793,298) (85,286) 140,946
Ending Fund Balance 420,779 2,355,023
Revenues
Previous Years Activity 118,886,095
Current Year Budget 666,552
Less Interest Earned (530,686)
TOTAL 119,021,961
THE CITY OF SAN ANGELO, TEXAS
Schedule of Revenues and Expenditures
Fiscal Year through July 31, 2018
Hickory Water Supply - Fund 516
Page 18
83% of
Year Lapsed
Original Current Month YTD YTD Over/(Under) %
Dept Budget Budget Actual Total W/Enc Budget Realized
Beginning Fund Balance 14,181,387 14,181,387 14,181,387
TRUST ACTIVITY
REVENUES:
Interest Income 206,138 206,138 28,533 186,766 186,766 (19,372) 91%
Lake Lease Income 64 32,882 32,882 - - - (32,882) 0%
Total Revenues 239,020 239,020 28,533 187,416 187,416 (51,604) 78%
EXPENDITURES:
Transfers Out 1994 64 185,524 185,524 25,679 168,090 168,090 (17,434) 91%
Total Expenditures 185,524 185,524 25,679 168,090 168,090 (17,434) 91%
Revenue Over/(Under) Expenditures 53,496 53,496 2,854 19,326 19,326
LAKE LOT SALES ACTIVITY
REVENUES:
Sale of Fixed Assets 64 700,000 700,000 26,566 427,289 427,289 (272,711) 61%
Total Revenues 700,000 700,000 26,566 427,289 427,289 (272,711) 61%
EXPENDITURES:
Professional Serv/Selling Exp. 0320 64 50,000 50,000 2,600 11,900 12,600 (37,400) 25%
Total Expenditures 50,000 50,000 2,600 11,900 12,600 (37,400) 25%
Revenue Over/(Under) Expenditures 650,000 650,000 23,966 415,389 414,689
Revenue Over/(Under) Expenditures 703,496 703,496 26,820 434,715 434,015
Ending Fund Balance 14,884,883 14,884,883 14,615,402
THE CITY OF SAN ANGELO, TEXAS
Schedule of Revenues and Expenditures
Fiscal Year through July 31, 2018
Lake Nasworthy - Fund 640
Page 19
83% of
Year Lapsed
Original Current Month YTD YTD Over/(Under) %
Dept Budget Budget Actual Total W/Enc Budget Realized
Beginning Fund Balance 10,262,151 10,262,151 10,262,151
REVENUES:
Sewer Fees 27 13,013,231 13,013,231 1,243,678 11,554,123 11,554,123 (1,459,108) 89%
Farm Use Revenues 203,806 203,806 1,000 226,784 226,784 22,978 111%
Paving Cuts 27 20,000 20,000 9,300 57,500 57,500 37,500 288%
Taps and Connections 27 20,000 20,000 4,200 19,910 19,910 (90) 100%
Miscellaneous 20,000 20,000 4,612 17,662 17,662 (2,338) 88%
Interest 115,396 115,396 26,259 173,838 173,838 58,442 151%
Total Revenues 13,392,433 13,392,433 1,289,049 12,049,817 12,049,817 (1,342,616) 90%
EXPENDITURES:
Wastewater Collection 5000 1,471,970 1,500,684 106,457 908,030 940,291 (560,393) 63%
Wastewater Treatment 5100&5101 2,801,877 2,941,792 198,180 1,994,025 2,171,325 (770,467) 74%
Insurance 5501&5502 143,328 143,328 13,482 136,128 136,128 (7,200) 95%
New Services 5401 27 25,000 25,000 - 7,576 7,576 (17,424) 30%
Sewer Main Extension 5402 27 24,177 24,177 176 6,621 6,621 (17,556) 27%
Capital Outlay 5400 1,529,859 6,095,771 24,087 1,899,774 4,675,978 (1,419,793) 77%
Administration Services 5500 1,796,981 1,796,981 167,711 1,603,324 1,603,324 (193,657) 89%
Transfers Out 5503 3,845,656 3,845,656 320,471 3,204,713 3,204,713 (640,943) 83%
Total Expenditures 11,638,848 16,373,389 830,564 9,760,191 12,745,956 (3,627,433) 78%
Revenue Over/(Under) Expenditures 1,753,585 (2,980,956) 458,485 2,289,626 (696,139)
Ending Fund Balance 12,015,736 7,281,195 9,566,012
THE CITY OF SAN ANGELO, TEXAS
Schedule of Revenues and Expenditures
Fiscal Year through July 31, 2018
Water Reclamation - Fund 270
Page 20
83% of
Year Lapsed
Original Current Month YTD YTD Over/(Under) %
Dept Budget Budget Actual Total W/Enc Budget Realized
Beginning Fund Balance 246,317 246,317 246,317
REVENUES:
Interest - - 601 3,585 3,585 3,585 0%
Transfers In 4,014,333 4,014,333 334,528 3,345,277 3,345,277 (669,056) 83%
Total Revenues 4,014,333 4,014,333 335,129 3,348,862 3,348,862 (665,471) 83%
EXPENDITURES:
Principal on Debt 5302 27 3,186,400 3,186,400 - 3,186,400 3,186,400 - 100%
Interest on Debt 5302 27 818,524 818,524 - 433,160 433,160 (385,364) 53%
Issue Costs 5302 27 9,409 9,409 - (8,941) (8,941) (18,350) -95%
Total Expenditures 4,014,333 4,014,333 - 3,610,619 3,610,619 (403,714) 90%
Revenue Over/(Under) Expenditures - - 335,129 (261,757) (261,757)
Ending Fund Balance 246,317 246,317 (15,440)
THE CITY OF SAN ANGELO, TEXAS
Schedule of Revenues and Expenditures
Fiscal Year through July 31, 2018
Water Reclamation Debt Service - Fund 271
Page 21
83% of
Year Lapsed
Original Current Month YTD YTD Over/(Under) %
Dept Budget Budget Actual Total W/Enc Budget Realized
Beginning Fund Balance 7,492,832 7,492,832 7,492,832
REVENUES:
Interest Income 78,506 78,506 19,173 133,416 133,416 54,910 170%
Sewer Charges 52 1,727,496 1,727,496 147,281 1,468,370 1,468,370 (259,126) 85%
Transfer from Development Corp 52 - - - (733) (733) (733) 0%
Total Revenues 1,806,002 1,806,002 166,454 1,601,053 1,601,053 (204,949) 89%
EXPENDITURES:
Property Improvement-Sewer Line Ext. 5400 1,346,093 6,744,852 - 68,822 5,350,200 (1,394,652) 79%
Franchise Fee 5500 52 86,375 86,375 7,364 73,418 73,418 (12,957) 85%
Transfer to Debt Service 1994 52 373,534 373,534 31,128 311,278 311,278 (62,256) 83%
Total Expenditures 1,806,002 7,204,761 38,492 453,518 5,734,896 (1,469,865) 80%
Revenue Over/(Under) Expenditures - (5,398,759) 127,962 1,147,535 (4,133,843)
Ending Fund Balance 7,492,832 2,094,073 3,358,989
THE CITY OF SAN ANGELO, TEXAS
Schedule of Revenues and Expenditures
Fiscal Year through July 31, 2018
Water Reclamation Capital Projects - Fund 520
Page 22
83% of
Year Lapsed
Original Current Month YTD YTD Over/(Under) %
Dept Budget Budget Actual Total W/Enc Budget Realized
Beginning Fund Balance 3,485,406 3,485,406 3,485,406
REVENUES:
Surcharges 619,106 619,106 56,762 544,902 544,902 (74,204) 88%
Landfill Host Fees 23 350,000 350,000 33,838 315,006 315,006 (34,994) 90%
Landfill Lease 23 582,690 582,690 48,558 485,580 485,580 (97,110) 83%
Farm Lease 23 19,760 19,760 - 14,413 14,413 (5,347) 73%
Interest Income 39,258 39,258 7,076 50,759 50,759 11,501 129%
Total Revenues 1,610,814 1,610,814 146,234 1,410,660 1,410,660 (200,154) 88%
EXPENDITURES:
Personnel 3700 261,999 274,572 16,026 183,032 183,032 (91,540) 67%
Maintenance 3700 11,800 13,300 594 6,429 6,429 (6,871) 48%
Contract Services 3700 161,726 190,226 1,918 83,890 103,352 (86,874) 54%
Supplies 3700 11,820 11,820 123 3,314 3,314 (8,506) 28%
Transfers 3700 255,000 255,000 21,250 212,500 212,500 (42,500) 83%
Capital Projects 3700 458,469 450,932 10,975 23,842 31,010 (419,922) 7%
Professional Services 3702 23 150,000 199,500 - 81,102 155,581 (43,919) 78%
Total Expenditures 1,310,814 1,395,350 50,886 594,109 695,218 (700,132) 50%
Revenue Over/(Under) Expenditures 300,000 215,464 95,348 816,551 715,442
Ending Fund Balance 3,785,406 3,700,870 4,200,848
THE CITY OF SAN ANGELO, TEXAS
Schedule of Revenues and Expenditures
Fiscal Year through July 31, 2018
Solid Waste Enterprise - Fund 230
Page 23
83% of
Year Lapsed
Original Current Month YTD YTD Over/(Under) %
Dept Budget Budget Actual Total W/Enc Budget Realized
Beginning Fund Balance 3,126,616 3,126,616 3,126,616
REVENUES:
Storm Water Fee 24 2,786,000 2,786,000 232,546 2,280,524 2,280,524 (505,476) 82%
Miscellaneous 100,000 100,000 7 346 346 (99,654) 0%
Transfers In from General 24 95,000 95,000 7,917 79,167 79,167 (15,833) 83%
Interest Income 42,154 42,154 8,000 55,573 55,573 13,419 132%
Total Revenues 3,023,154 3,023,154 248,470 2,415,610 2,415,610 (607,544) 80%
EXPENDITURES:
Personnel 5800 1,313,538 1,331,638 94,696 931,828 931,828 (399,810) 70%
Maintenance 5800 491,475 568,888 9,806 278,560 363,256 (205,632) 64%
Supplies 5800 116,900 117,400 16,406 67,341 67,634 (49,766) 58%
Other 5800 48,100 48,100 1,829 12,339 12,339 (35,761) 26%
Transfers 5800 359,239 359,239 29,961 297,741 297,741 (61,498) 83%
Capital Outlay 5800 582,800 1,864,487 2,553 89,498 270,553 (1,593,934) 15%
Contingencies 5800 24 111,102 55,502 - - - (55,502) 0%
Total Expenditures 3,023,154 4,345,254 155,251 1,677,307 1,943,351 (2,401,903) 45%
Revenue Over/(Under) Expenditures - (1,322,100) 93,219 738,303 472,259
Ending Fund Balance 3,126,616 1,804,516 3,598,875
THE CITY OF SAN ANGELO, TEXAS
Schedule of Revenues and Expenditures
Fiscal Year through July 31, 2018
Storm Water - Fund 240
Page 24
83% of
Year Lapsed
Original Current Month YTD YTD Over/(Under) %
Dept Budget Budget Actual Actual W/Enc Budget Realized
Beginning Fund Balance 148,222 148,222 148,222
REVENUES:
Leases/Rentals 1,010,758 1,010,758 81,026 887,314 887,314 (123,444) 88%
Concessions 358,100 358,100 25,138 307,569 307,569 (50,531) 86%
Charges for Service 22 52,682 52,682 4,784 46,467 46,467 (6,215) 88%
Interest Income 1,172 1,172 379 2,752 2,752 1,580 235%
Other Income 51,380 51,380 333 29,323 29,323 (22,057) 57%
Total Revenues 1,474,092 1,474,092 111,660 1,273,425 1,273,425 (200,667) 86%
EXPENDITURES:
Personnel 3901 784,271 784,271 108,821 636,469 636,469 (147,802) 81%
Administration 3901 359,209 410,749 16,304 294,244 363,857 (46,892) 89%
Supplies 3901 67,383 59,197 3,788 49,542 50,310 (8,887) 85%
Maintenance 3901 74,969 72,653 1,493 66,751 69,525 (3,128) 96%
Utilities 3901 188,260 188,260 12,697 129,628 131,322 (56,938) 70%
Total Expenditures 1,474,092 1,515,130 143,103 1,176,634 1,251,483 (263,647) 83%
Revenue Over/(Under) Expenditures - (41,038) (31,443) 96,791 21,942
Ending Fund Balance 148,222 107,184 170,164
THE CITY OF SAN ANGELO, TEXAS
Schedule of Revenues and Expenditures
Fiscal Year through July 31, 2018
Airport Operating - Fund 220
Page 25
83% of
Year Lapsed
Original Current Month YTD YTD Over/(Under) %
Dept Budget Budget Actual Total W/Enc Budget Realized
Beginning Fund Balance 1,192,865 1,192,865 1,192,865
REVENUES:
Interest Income 16,086 16,086 3,052 20,643 20,643 4,557 128%
PFC Revenue 52 256,500 256,500 38,120 211,807 211,807 (44,693) 83%
Total Revenues 272,586 272,586 41,172 232,450 232,450 (40,136) 85%
EXPENDITURES:
Operations 3901 52 - 132,212 - 61,757 132,212 - 100%
Transfers Out 1994 52 272,586 272,586 - - - (272,586) 0%
Total Expenditures 272,586 404,798 - 61,757 132,212 (272,586) 33%
Revenue Over/(Under) Expenditures - (132,212) 41,172 170,693 100,238
Ending Fund Balance 1,192,865 1,060,653 1,293,103
THE CITY OF SAN ANGELO, TEXAS
Schedule of Revenues and Expenditures
Fiscal Year through July 31, 2018
Airport PFC - Fund 529
Page 26
83% of
Year Lapsed
Original Current Month YTD YTD Over/(Under) %
Budget Budget Actual Total W/Enc Budget Realized
Beginning Fund Balance 1,093,871 1,093,871 1,093,871
Grant 33 - 2012 Projects
Revenue: FAA Grant 53 - - - - - - 0%
Revenue: PFC Match 53 213,884 213,884 - - - (213,884) 0%
Expenditure: Buildings 53 133,049 133,049 - - 66,080 (66,969) 50%
Revenue Over/(Under) Expenditures 80,835 80,835 - - (66,080) (146,915)
Grant 34 - 2016 Projects
Revenue: FAA Grant 53 13,951 10,351 - - - (10,351) 0%
Taxiway Reconfiguration Design 53 4,001 - - - - - 0%
Revenue Over/(Under) Expenditures 9,950 10,351 - - - (10,351)
Grant 35 - Taxiway Reconfiguration
Revenue: FAA Grant 53 3,229,017 3,229,017 338,011 2,437,472 2,437,472 (791,545) 75%
Revenue: PFC Match 53 358,779 358,779 - - - (358,779) 0%
Taxiway Reconfiguration 53 3,299,701 3,299,701 317,518 2,548,618 3,299,700 (1) 100%
Professional Services 53 288,095 288,095 14,844 174,528 288,095 - 100%
Revenue Over/(Under) Expenditures - - 5,649 (285,674) (1,150,323) (1,150,323)
Grant 36 - ARFF Truck & Pavement Plan
Revenue: FAA Grant 53 603,175 603,175 (52,245) 57,812 57,812 (545,363) 10%
Revenue: PFC Match 53 67,019 67,019 - - - (67,019) 0%
Taxiway Reconfiguration 53 64,235 64,235 - 64,235 64,235 - 100%
Professional Services 53 605,959 605,959 - - 605,959 - 100%
Revenue Over/(Under) Expenditures - - (52,245) (6,423) (612,382) (612,382)
Total Revenues 4,485,825 4,482,225 285,766 2,495,284 2,495,284
Less: Total Expenditures 4,395,040 4,391,039 332,362 2,787,381 4,324,069
Revenue Over/(Under) Expenditures 90,785 91,186 (46,596) (292,097) (1,828,785)
Ending Fund Balance 1,184,656 1,185,057 (734,914)
THE CITY OF SAN ANGELO, TEXAS
Schedule of Revenues and Expenditures
Fiscal Year through July 31, 2018
Airport FAA Projects - Fund 530
Page 27
83% of
Year Lapsed
Original Current Month YTD YTD Over/(Under) %
Dept Budget Budget Actual Total W/Enc Budget Realized
Beginning Fund Balance 152,498 152,498 152,498
CHASE BUILDING
REVENUES:
Rent 1,061,000 1,061,000 82,809 840,840 840,840 (220,160) 79%
EXPENDITURES:
Personnel 1908 122,952 122,952 10,214 104,711 104,711 (18,241) 85%
Professional Services 1908 130,772 131,522 10,412 109,957 126,957 (4,565) 97%
Utilities 1908 104,548 106,048 8,867 79,883 82,831 (23,217) 78%
Maintenance 1908 24,049 25,881 2,158 21,866 23,868 (2,013) 92%
Rent of Land & Buildings 1908 20 188,348 188,348 15,696 156,957 156,957 (31,391) 83%
Capital Improvements 1908 20 50,000 50,000 - - - (50,000) 0%
Supplies 1908 2,650 2,650 180 1,384 1,384 (1,266) 52%
Debt Principal & Interest 1908 51,472 51,472 - 48,062 48,062 (3,410) 93%
Total Expenditures 674,791 678,873 47,527 522,820 544,770 (134,103) 80%
Revenue Over/(Under) Expenditures 386,209 382,127 35,282 318,020 296,070
ANNEX BUILDING
REVENUES:
Rent 20 229,000 229,000 - 171,946 171,946 (57,054) 75%
EXPENDITURES:
Professional Services 1909 23,100 23,100 1,800 19,329 23,100 - 100%
Utilities 1909 30,750 31,250 2,574 23,655 24,303 (6,947) 78%
Maintenance 1909 15,680 19,680 1,436 14,797 16,592 (3,088) 84%
Rent of Land & Buildings 1909 20 107,000 107,000 8,917 89,167 89,167 (17,833) 83%
Debt Principal & Interest 1909 120,101 120,101 - 112,144 112,144 (7,957) 93%
Total Expenditures 296,631 301,131 14,727 259,092 265,306 (35,825) 88%
Revenue Over/(Under) Expenditures (67,631) (72,131) (14,727) (87,146) (93,360)
Interest Income 3,998 3,998 1,627 4,018 4,018 20 101%
Capital Expense 1999 20 322,576 313,994 - - 2,719 (311,275) 1%
Revenue Over/(Under) Expenditures - - 22,182 234,892 204,009
Ending Fund Balance 152,498 152,498 356,507
THE CITY OF SAN ANGELO, TEXAS
Schedule of Revenues and Expenditures
Fiscal Year through July 31, 2018
State Office Building (Operations) - Fund 201
Page 28
83% of
Year Lapsed
Original Current Month YTD YTD Over/(Under) %
Dept Budget Budget Actual Total W/Enc Budget Realized
Beginning Fund Balance 515,265 515,265 515,265
REVENUES:
Advertising 20 29,000 29,000 - 17,441 17,441 (11,559) 60%
Athletic Programs 20 3,700 3,700 228 1,416 1,416 (2,284) 38%
Rentals 20 20,000 20,000 9,223 22,642 22,642 2,642 113%
Concessions 20 10,000 10,000 2,037 6,929 6,929 (3,071) 69%
Program Registration 20 98,000 98,000 3,958 67,120 67,120 (30,880) 68%
General Fund Transfer 20 701,728 701,728 58,477 584,773 584,773 (116,955) 83%
Hotel Occupancy Tax Transfer 20 50,000 50,000 4,167 41,666 41,666 (8,334) 83%
Interest Income 5,009 5,009 1,318 9,558 9,558 4,549 191%
Total Revenues 917,437 917,437 79,408 751,545 751,545 (165,892) 82%
EXPENDITURES:
Parks Maintenance
Personnel 6019 375,477 375,477 24,763 279,717 279,717 (95,760) 74%
Maintenance & Utilities 372,024 372,024 12,025 189,615 204,466 (167,558) 55%
Capital 20 - 293,521 170,488 174,567 251,464 (42,057) 86%
Other Operating 72,113 72,113 1,878 29,603 29,700 (42,413) 41%
Total Parks Maintenance 819,614 1,113,135 209,154 673,502 765,347 (347,788) 69%
Recreation Performance
Personnel 6101 14,750 14,750 1,514 7,092 7,092 (7,658) 48%
Operating Expenditures 83,073 83,073 3,878 31,725 31,725 (51,348) 38%
Total Recreation Performance 97,823 97,823 5,392 38,817 38,817 (59,006) 40%
Special Events
Expenditures 6119 20 - 20,000 - - - (20,000) 0%
Total Special Events - 20,000 - - - (20,000) 0%
Total Expenditures 917,437 1,230,958 214,546 712,319 804,164 (406,794) 65%
Revenue Over/(Under) Expenditures - (313,521) (135,138) 39,226 (52,619)
Ending Fund Balance 515,265 201,744 462,646
THE CITY OF SAN ANGELO, TEXAS
Schedule of Revenues and Expenditures
Fiscal Year through July 31, 2018
Texas Bank Sports Complex - Fund 203
Page 29
83% of
Year Lapsed
Original Current Month YTD YTD Over/(Under) %
Dept Budget Budget Actual Total W/Enc Budget Realized
Beginning Fund Balance 734,043 734,043 734,043
REVENUES:
Transfer from Hotel Occupancy Tax Fund 41 891,600 1,185,600 - 1,130,149 1,130,149 (55,451) 95%
EXPENDITURES:
Coliseum 6601
Revenues 238,500 238,500 7,550 225,489 225,489 (13,011) 95%
Expenditures 228,051 228,051 15,029 169,134 176,763 (51,288) 78%
Revenue Over/(Under) Expenditures 10,449 10,449 (7,479) 56,355 48,726 38,277
Civic Events Concessions
Revenues 6607 41 40,000 40,000 1,482 40,826 40,826 826 102%
Revenue Over/(Under) Expenditures 40,000 40,000 1,482 40,826 40,826 826
Auditorium 6602
Revenues - - - 2,208 2,208 2,208 0%
Expenditures - - - - - - 0%
Revenue Over/(Under) Expenditures - - - 2,208 2,208 2,208
East Reception Room 6609
Revenues - - - 3,570 3,570 3,570 0%
Expenditures - - - - - - 0%
Revenue Over/(Under) Expenditures - - - 3,570 3,570 3,570
Civic Events Riverstage 6605
Revenues 22,500 22,500 750 12,363 12,363 (10,137) 55%
Expenditures 30,917 30,917 1,262 13,475 13,867 (17,050) 45%
Revenue Over/(Under) Expenditures (8,417) (8,417) (512) (1,112) (1,504) 6,913
Convention Center 6603
Revenues 209,750 209,750 12,543 181,239 181,239 (28,511) 86%
Expenditures 161,364 174,906 10,540 102,720 109,534 (65,372) 63%
Revenue Over/(Under) Expenditures 48,386 34,844 2,003 78,519 71,705 36,861
Farmers Market/Pavilion/Paseo Grounds
Revenues 6606 16,200 16,200 1,538 12,066 12,066 (4,134) 74%
Expenditures 18,300 25,599 256 13,221 14,364 (11,235) 56%
Revenue Over/(Under) Expenditures (2,100) (9,399) 1,282 (1,155) (2,298) 7,101
Non-Departmental 6604
Payroll Expenditures 772,267 772,267 58,875 615,294 615,294 (156,973) 80%
Administration 251,546 240,685 12,941 177,688 186,150 (54,535) 77%
Capital & Maintenance 6699 8,333 474,908 26,196 99,594 432,994 (41,914) 91%
Non-Departmental Expenditures 1,032,146 1,487,860 98,012 892,576 1,234,438 (253,422)
Other/Capital/Transfers 6604
Interest 32,228 32,228 1,878 13,450 13,450 (18,778) 42%
Advertising Revenue 41 20,000 20,000 - 14,075 14,075 (5,925) 70%
Other Revenues 52,228 52,228 1,878 27,525 27,525
Revenue Over/(Under) Expenditures - (182,555) (99,358) 444,309 86,469
Ending Fund Balance 734,043 551,488 820,512
THE CITY OF SAN ANGELO, TEXAS
Schedule of Revenues and Expenditures
Fiscal Year through July 31, 2018
Civic Events - Fund 410
Page 30
83% of
Year Lapsed
Original Current Month YTD YTD Over/(Under) %
Dept Budget Budget Actual Total W/Enc Budget Realized
Beginning Fund Balance 239,395 239,395 239,395
REVENUES:
Rental Income 415,000 415,000 35,462 353,731 353,731 (61,269) 85%
Admission Fees 42 14,000 14,000 1,112 11,843 11,843 (2,157) 85%
Merchandise Sales 22,250 22,250 1,692 18,362 18,362 (3,888) 83%
Special Events 128,100 128,100 3,125 87,126 87,126 (40,974) 68%
Memberships 42 50,000 50,000 680 42,830 42,830 (7,170) 86%
Citizens Contributions 42 5,000 5,000 1,685 4,810 4,810 (190) 96%
Other Income 13,050 13,050 - 6,429 6,429 (6,621) 49%
General Fund Transfer 42 356,388 356,388 29,699 296,990 296,990 (59,398) 83%
Hotel Occupancy Tax Transfer 42 50,000 50,000 4,167 41,666 41,666 (8,334) 83%
Interest Income 42 3,867 3,867 613 4,303 4,303 436 111%
Total Revenues 1,057,655 1,057,655 78,235 868,090 868,090 (189,565) 82%
EXPENDITURES:
Personnel 6301 733,073 733,073 65,086 576,969 576,969 (156,104) 79%
Supplies 6301 16,569 17,174 1,377 13,145 13,145 (4,029) 77%
Maintenance 6301 52,622 52,622 2,677 48,623 52,476 (146) 100%
Events 6302-6 62,891 62,626 901 50,352 54,581 (8,045) 87%
Capital 6308 3,000 3,000 - 2,727 2,727 (273) 91%
Utilities 6301 105,000 105,450 6,686 70,538 70,629 (34,821) 67%
Other 6304-5 84,500 83,710 4,168 51,435 60,897 (22,813) 73%
Total Expenditures 1,057,655 1,057,655 80,895 813,789 831,424 (226,231) 79%
Revenue Over/(Under) Expenditures - - (2,660) 54,301 36,666
Ending Fund Balance 239,395 239,395 276,061
THE CITY OF SAN ANGELO, TEXAS
Schedule of Revenues and Expenditures
Fiscal Year through July 31, 2018
Fort Concho - Fund 420
Page 31
83% of
Year Lapsed
Original Current Month YTD YTD Over/(Under) %
Dept Budget Budget Actual Total W/Enc Budget Realized
Beginning Fund Balance (74,582) (74,582) (74,582)
REVENUES:
Charges for Sales and Service 283,900 283,900 47,575 271,350 271,350 (12,550) 96%
Contributions from Trust 44 50,000 50,000 3,020 37,429 37,429 (12,571) 75%
General Fund Transfer 44 86,734 86,734 7,228 72,278 72,278 (14,456) 83%
Interest Income 44 2,000 2,000 193 1,626 1,626 (374) 81%
Service Set-up Charges 44 5,000 5,000 - 325 325 (4,675) 7%
Total Revenues 427,634 427,634 58,016 383,008 383,008 (44,626) 90%
EXPENDITURES:
Personnel 6400 263,331 282,531 22,383 237,724 237,724 (44,807) 84%
Supplies 6400 7,810 9,810 949 7,548 7,548 (2,262) 77%
Maintenance 6400 33,757 30,757 1,592 21,588 21,679 (9,078) 70%
Utilities 6400 52,951 33,751 1,334 14,959 15,048 (18,703) 45%
Other 6400 57,785 58,785 5,293 42,231 44,781 (14,004) 76%
Columbarium 6400 44 - 37,983 - - - (37,983) 0%
Total Expenditures 415,634 453,617 31,551 324,050 326,780 (126,837) 72%
Revenue Over/(Under) Expenditures 12,000 (25,983) 26,465 58,958 56,228
Ending Fund Balance (62,582) (100,565) (18,354)
THE CITY OF SAN ANGELO, TEXAS
Schedule of Revenues and Expenditures
Fiscal Year through July 31, 2018
Fairmount Cemetery - Fund 440
Page 32
83% of
Year Lapsed
Original Current Month YTD YTD Over/(Under) %
Dept Budget Budget Actual Total W/Enc Budget Realized
Beginning Fund Balance 587,650 587,650 587,650
Transportation
Revenues 103 205,528 592,488 - 125,809 125,809 (466,679) 21%
Expenditures 2100 205,528 556,782 19,826 186,748 186,748 (370,034) 34%
Revenue Over/(Under) Expenditures - 35,706 (19,826) (60,939) (60,939)
MLK TEP Project
Revenues 103 - 1,040,283 58,950 717,008 717,008 (323,275) 69%
Expenditures 3200 103 - 1,040,283 - - - (1,040,283) 0%
Revenue Over/(Under) Expenditures - - 58,950 717,008 717,008
Parks Improvements
Revenues 103 - 353,250 - - - (353,250) 0%
Expenditures 6000 103 - 353,250 - - - (353,250) 0%
Revenue Over/(Under) Expenditures 103 - - - - -
NOAA Rainwater Capture Grant
Revenues 103 - - - - - - 0%
Expenditures 6003 103 - 1,218 - - 1,218 - 100%
Revenue Over/(Under) Expenditures - (1,218) - - (1,218)
Nutrition
Revenues 271,264 271,264 21,588 204,357 204,357 (66,907) 75%
Expenditures 6700 271,264 271,264 21,532 196,552 205,539 (65,725) 76%
Revenue Over/(Under) Expenditures - - 56 7,805 (1,182)
Nursing
Revenues 139,474 139,474 11,308 115,797 115,797 (23,677) 83%
Expenditures 7001 139,474 139,474 12,688 94,775 95,617 (43,857) 69%
Revenue Over/(Under) Expenditures - - (1,380) 21,022 20,180
EHS & RLHO Grant
Revenues 199,433 199,433 11,814 160,476 160,476 (38,957) 80%
Expenditures 7201 & 7202 199,433 305,677 18,103 139,840 140,052 (165,625) 46%
Revenue Over/(Under) Expenditures - (106,244) (6,289) 20,636 20,424
PHEP
Revenues 101,682 101,682 3,053 58,676 58,676 (43,006) 58%
Expenditures 7203 101,682 101,682 4,830 69,847 69,847 (31,835) 69%
Revenue Over/(Under) Expenditures - - (1,777) (11,171) (11,171)
PHEP - Local Match
Revenues 103 10,030 10,030 836 8,358 8,358 (1,672) 83%
Expenditures 7204 10,030 10,030 836 8,358 8,358 (1,672) 83%
Revenue Over/(Under) Expenditures - - - - -
Texas Healthy Communities
Revenues 103 50,000 50,000 - 8,936 8,936 (41,064) 18%
Expenditures 7600 50,000 50,000 1,114 44,256 44,256 (5,744) 89%
Revenue Over/(Under) Expenditures - - (1,114) (35,320) (35,320)
THE CITY OF SAN ANGELO, TEXAS
Schedule of Revenues and Expenditures
Fiscal Year through July 31, 2018
Intergovernmental - Fund 103
Page 33
83% of
Year Lapsed
Original Current Month YTD YTD Over/(Under) %
Dept Budget Budget Actual Total W/Enc Budget Realized
Beginning Fund Balance 587,650 587,650 587,650
THE CITY OF SAN ANGELO, TEXAS
Schedule of Revenues and Expenditures
Fiscal Year through July 31, 2018
Intergovernmental - Fund 103
Women Infant & Children Grant
Revenues 103 854,620 848,998 109,892 499,853 499,853 (349,145) 59%
Expenditures 7700 854,620 848,998 68,755 665,718 669,140 (179,858) 79%
Revenue Over/(Under) Expenditures - - 41,137 (165,865) (169,287)
1115 Waiver
Revenues 137,500 137,500 (27,372) 167,072 167,072 29,572 122%
Expenditures 7808 137,500 484,009 7,318 73,538 81,037 (402,972) 17%
Revenue Over/(Under) Expenditures - (346,509) (34,690) 93,534 86,035
Social Services
Revenues 126,170 126,170 8,014 100,975 100,975 (25,195) 80%
Expenditures 7900 126,170 126,472 11,723 98,260 99,185 (27,287) 78%
Revenue Over/(Under) Expenditures - (302) (3,709) 2,715 1,790
2017 State Justice Assist Grant
Revenues 103 - 26,500 - 26,500 26,500 - 100%
Expenditures 8725 103 - 26,500 - 26,500 26,500 - 100%
Revenue Over/(Under) Expenditures - - - - -
2018 State Justice Assist Grant
Revenues 103 - 98,938 98,938 98,938 98,938 - 100%
Expenditures 8726 103 - 98,938 - 98,938 98,938 - 100%
Revenue Over/(Under) Expenditures - - 98,938 - -
Emergency Management
Revenues 280,966 280,966 90,138 164,828 164,828 (116,138) 59%
Expenditures 9200 280,966 280,966 9,239 152,619 157,565 (123,401) 56%
Revenue Over/(Under) Expenditures - - 80,899 12,209 7,263
Miscellaneous
Interest 103 - - 1,504 4,229 4,229 4,229 0%
Revenue Over/(Under) Expenditures - (418,567) 212,699 614,683 586,632
Ending Fund Balance 587,650 169,083 1,174,282
Page 34
83% of
Year Lapsed
Original Current Month YTD YTD Over/(Under) %
Dept Budget Budget Actual Total W/Enc Budget Realized
Beginning Fund Balance 137,111 137,111 137,111
REVENUES:
HUD-CDBG 45 110,335 110,335 - 6,649 6,649 (103,686) 6%
Rehab Loans 45 78,071 77,798 110 560 560 (77,238) 1%
Total Revenues 188,406 188,133 110 7,209 7,209 (180,924) 4%
EXPENDITURES:
Administration 2610 45 23,920 14,854 - - - (14,854) 0%
Public Services:
Rehab Grants and Loans 2621 9,428 9,030 - 1,986 1,986 (7,044) 22%
Public Works:
Health Dept - Code Enforcement 2630 45 12,616 10,744 - 10,514 10,514 (230) 98%
Service Line Warranties 2660 45 10,645 6,987 - 525 525 (6,462) 8%
Total Expenditures 56,609 41,615 - 13,025 13,025 (28,590) 31%
Revenue Over/(Under) Expenditures 131,797 146,518 110 (5,816) (5,816)
Ending Fund Balance 268,908 283,629 131,295
THE CITY OF SAN ANGELO, TEXAS
Schedule of Revenues and Expenditures
Fiscal Year through July 31, 2018
Community Development Block Grant - Prior Year - Fund 452
Page 35
83% of
Year Lapsed
Original Current Month YTD YTD Over/(Under) %
Dept Budget Budget Actual Total W/Enc Budget Realized
Beginning Fund Balance - - -
REVENUES:
HUD-CDBG 45 688,898 688,898 - 275,284 275,284 (413,614) 40%
Rehab Loans 45 32,000 32,000 191 1,923 1,923 (30,077) 6%
Recaptured Funds 45 - - - 15,656 15,656 15,656 0%
Total Revenues 720,898 720,898 191 292,863 292,863 (428,035) 41%
EXPENDITURES:
Administration 2610 142,341 142,341 11,421 99,361 99,383 (42,958) 70%
Debt Service 2617 45 146,048 146,048 126,524 146,047 146,047 (1) 100%
Rehab Administration 2620 126,659 126,659 10,465 99,976 100,098 (26,561) 79%
Rehab Grants and Loans 2621 267,850 267,850 47,727 211,041 225,793 (42,057) 84%
Health Dept Code Enforcement 2630 45 38,000 38,000 4,433 37,235 37,235 (765) 98%
Total Expenditures 720,898 720,898 200,570 593,660 608,556 (112,342) 84%
Revenue Over/(Under) Expenditures - - (200,379) (300,797) (315,693)
Ending Fund Balance - - (315,693)
THE CITY OF SAN ANGELO, TEXAS
Schedule of Revenues and Expenditures
Fiscal Year through July 31, 2018
Community Development Block Grant - Current Year - Fund 453
Page 36
83% of
Year Lapsed
Original Current Month YTD YTD Over/(Under) %
Dept Budget Budget Actual Total W/Enc Budget Realized
Beginning Fund Balance 279,766 279,766 279,766
REVENUES:
Grants 48 118,460 118,460 - 36,386 36,386 (82,074) 31%
Misc Revenue 48 27,888 27,888 - - - (27,888) 0%
Revit Loan Payments 48 110,193 109,937 40 230 230 (109,707) 0%
Total Revenues 256,541 256,285 40 36,616 36,616 (219,669) 14%
EXPENDITURES:
Administration 2410 59,872 - - - - - 0%
Contribution - MHMR 2440 48 7,245 7,245 707 3,818 7,245 - 100%
Homebuyers Assistance Program 2440 48 25,450 25,450 - 25,450 25,450 - 100%
Neighborhood Revitalization 2440 63,687 122,826 6,095 32,908 62,455 (60,371) 51%
CHS Revitalization 2460 57,875 57,875 136 13,228 13,703 (44,172) 24%
Total Expenditures 214,129 213,396 6,938 75,404 108,853 (104,543) 51%
Revenue Over/(Under) Expenditures 42,412 42,889 (6,898) (38,788) (72,237)
Ending Fund Balance 322,178 322,655 207,529
THE CITY OF SAN ANGELO, TEXAS
Schedule of Revenues and Expenditures
Fiscal Year through July 31, 2018
HOME Prior Year - Fund 482
Page 37
83% of
Year Lapsed
Original Current Month YTD YTD Over/(Under) %
Dept Budget Budget Actual Total W/Enc Budget Realized
Beginning Fund Balance - - -
REVENUES:
Grants 48 254,111 249,197 - 135,470 135,470 (113,727) 54%
Recaptured Funds 48 - - - 11,002 11,002 11,002 0%
Sale of Assets 48 38,412 38,412 3,201 32,006 32,006 (6,406) 83%
Miscellaneous 48 30,315 30,135 - 15,068 15,068 (15,067) 50%
Revit Loan Payments 48 24,000 24,000 223 2,179 2,179 (21,821) 9%
Total Revenues 346,838 341,744 3,424 195,725 195,725 (146,019) 57%
EXPENDITURES:
Administration 2410 96,730 95,867 2,824 25,959 25,959 (69,908) 27%
Contribution - MHMR 2440 48 51,000 1,545 151 815 1,545 - 100%
Homebuyers Assistance Program 2440 48 111,108 144,882 22,299 57,772 57,772 (87,110) 40%
Galilee CDC 2420 48 88,000 99,450 - 99,450 99,450 - 100%
Total Expenditures 346,838 341,744 25,274 183,996 184,726 (157,018) 54%
Revenue Over/(Under) Expenditures - - (21,850) 11,729 10,999
Ending Fund Balance - - 10,999
THE CITY OF SAN ANGELO, TEXAS
Schedule of Revenues and Expenses
Fiscal Year through July 31, 2018
HOME Current Year - Fund 483
Page 38
Carryover Current Current Expense Current
Account Revenue Year Expense Year Budget Account
Beginning Fund Balance Dept Balance Budget Contributions Budget Expense Balance Balance
City Council - Entrance Esplanade 0100 9,647 - - 60 9,647 - 9,647 9,647
Visitor Center - Sculpture 0102 13,720 - - 60 13,719 - 13,719 13,720
Visitor Center - Memorial 0103 20 - - 60 22 - 22 20
Planning and Zoning 2000 225 - - 60 225 - 225 225
Keep San Angelo Beautiful 2010 60 986 - - 60 986 - 986 986
Water Conservation 4002 500 - - 60 500 - 500 500
Parks - Botanical and Agriculture 6000 60 12,025 3,000 775 60 12,024 217 11,807 12,583
Parks - Park Improvement 6003 60 5,000 25,000 25,000 60 30,000 23,697 6,303 6,303
Parks - Park Commission 6004 304 - - 60 303 - 303 304
Parks - Dog Park 6005 60 637 - - 60 636 636 - 1
Dr. Smith Memorial 6006 218 - - 60 218 218 - -
Parks - Kids Kingdom Maintenance 6013 25 - - 60 25 25 - 0
Parks - Unidad Park Maintenance 6014 60 2,522 - - 60 2,521 - 2,521 2,522
Parks - Water Customer Donations 6025 60 4,941 - 492 60 4,940 - 4,940 5,433
Nature Center 6100 60 3,974 - 157 60 4,001 - 4,001 4,131
Recreation - Special Events 6100 60 35 - - 60 7 - 7 35
Recreation - Athletic Programs 6100 60 7,366 500 2,900 60 7,866 480 7,386 9,786
Recreation - Summer Meals 6105 9 - - 60 9 - 9 9
Recreation - Swimming Pool 6125 60 628 - 492 60 627 - 627 1,120
Recreation - Public Arts Commision 6140 60 266 - - 60 265 - 265 266
River Fest 6150 60 22,774 30,000 11,079 60 60,719 7,902 52,817 25,951
Auditorium Improvement 6602 60 - 25,466 53,208 60 25,466 - 25,466 53,208
Nutrition 67xx 1,361 - - 60 1,360 - 1,360 1,361
Animal Control 7803 60 7,046 - 748 60 7,045 3,327 3,718 4,467
Animal Control - Spay and Neuter 7805 60 8,959 - 10,556 60 12,703 11,595 1,108 7,920
Police Adminstration 8000 27 - - 60 27 - 27 27
Police - Gun Range 8001 60 - - 1,738 - - - 1,738
Canine Donations 8002 60 2,930 500 661 60 3,014 - 3,014 3,591
H.E.A.T. 8005 149 - - 60 149 - 149 149
Miscellaneous Police Donations 8007 60 804 500 615 60 803 - 803 1,419
Safety City 8008 60 1,264 - - 60 1,264 - 1,264 1,264
Police Memorial 8010 60 4,065 2,500 - 60 4,065 - 4,065 4,065
Police Week 8012 60 - 2,500 - 60 - - - -
Police Pistol Team 8013 60 26 250 - 60 25 - 25 26
DREAM 8400 60 1,397 1,000 1,598 60 1,396 1,396 - 1,599
Fire Department Donations 9010 60 4,273 - - 60 4,272 - 4,272 4,273
Contingencies 0000 - - - 60 11,314 - 11,314 -
Interest on Investments 0000 60 816 2,440 2,572 60 2,440 - 2,440 3,388
TOTAL 118,938 93,656 112,591 224,603 49,493 175,110 182,036
THE CITY OF SAN ANGELO, TEXAS
Schedule of Revenues and Expenses
Fiscal Year through July 31, 2018
Designated Revenue - Fund 601
Page 39
83% of
Year Lapsed
Original Current Month YTD YTD Over/(Under) %
Dept Budget Budget Actual Total W/Enc Budget Realized
Beginning Fund Balance 1,497,523 1,497,523 1,497,523
Hotel Occupancy Tax
REVENUES:
Hotel Occupancy Tax 60 1,857,500 1,857,500 358,685 2,100,662 2,100,662 243,162 113%
Interest 60 27,394 27,394 3,832 26,140 26,140 (1,254) 95%
Total Revenues 1,884,894 1,884,894 362,517 2,126,802 2,126,802 241,908 113%
EXPENDITURES:
San Angelo Performing Arts Council 60 50,000 50,000 - 50,000 50,000 - 100%
San Angelo Chamber of Commerce 60 865,000 865,000 72,083 720,833 720,833 (144,167) 83%
San Angelo Cultural Affairs Council 60 92,875 92,875 12,418 86,866 86,866 (6,009) 94%
Downtown San Angelo 60 37,500 37,500 - 18,750 37,500 - 100%
Fort Concho 60 50,000 50,000 4,167 41,666 41,666 (8,334) 83%
Civic Events 60 891,600 1,185,600 - 1,130,149 1,130,149 (55,451) 95%
Texas Bank Sports Complex 60 50,000 50,000 4,167 41,666 41,666 (8,334) 83%
Total Expenditures 2,036,975 2,330,975 92,835 2,089,930 2,108,680 (222,295) 90%
Revenue Over/(Under) Expenditures (152,081) (446,081) 269,682 36,872 18,122
Ending Fund Balance 1,345,442 1,051,442 1,515,645
THE CITY OF SAN ANGELO, TEXAS
Schedule of Revenues and Expenditures
Fiscal Year through July 31, 2018
Hotel Occupancy Tax - Fund 605
Page 40
83% of
Year Lapsed
Original Current Month YTD YTD Over/(Under) %
Dept Budget Budget Actual Total W/Enc Budget Realized
Beginning Fund Balance 572,031 572,031 572,031
REVENUES:
Gas and Oil 2,755,865 2,755,865 216,731 1,010,795 1,010,795 (1,745,070) 37%
Gas and Oil - Schools 30 1,365,289 1,365,289 17,783 517,143 517,143 (848,146) 38%
Materials 1,315,321 1,315,321 757 1,318,456 1,318,456 3,135 100%
Labor Charges 30 1,371,275 1,371,275 9 600,551 600,551 (770,724) 44%
Fuel Tax Refund 30 16,668 16,668 1,379 12,233 12,233 (4,435) 73%
Other Income 15,491 15,491 - 980 980 (14,511) 6%
Rent 30 120,000 120,000 - 120,000 120,000 - 100%
Interest Income - - 1,464 6,295 6,295 6,295 0%
Total Revenues 6,959,909 6,959,909 238,123 3,586,453 3,586,453 (3,373,456) 52%
EXPENDITURES:
Personnel 1800 940,725 940,725 78,394 737,160 737,160 (203,565) 78%
Gas and Oil 1800 4,128,653 4,128,653 116,968 1,451,844 2,834,858 (1,293,795) 69%
Parts Contract 1800 30 160,000 160,000 - 92,887 156,000 (4,000) 98%
Materials 1800 30 1,315,321 1,315,321 167,600 962,819 1,204,887 (110,434) 92%
Utilities 1800 39,400 39,400 1,983 26,968 27,674 (11,726) 70%
Maintenance 1800 53,093 51,093 596 33,292 34,446 (16,647) 67%
Other 1800 217,507 225,710 15,744 153,845 200,047 (25,663) 89%
Capital Outlay 1803 1899 54,093 47,890 3,139 39,369 39,369 (8,521) 82%
Total Expenditures 6,908,792 6,908,792 384,424 3,498,184 5,234,441 (1,674,351) 76%
Revenue Over/(Under) Expenditures 51,117 51,117 (146,301) 88,269 (1,647,988)
Ending Fund Balance 623,148 623,148 (1,075,957)
THE CITY OF SAN ANGELO, TEXAS
Schedule of Revenues and Expenditures
Fiscal Year through July 31, 2018
Fleet Services - Fund 301
Page 41
83% of
Year Lapsed
Original Current Month YTD YTD Over/(Under) %
Dept Budget Budget Actual Total W/Enc Budget Realized
Beginning Fund Balance 184,949 184,949 184,949
REVENUES:
Charges for Services 750,431 750,431 78,086 617,533 617,533 (132,898) 82%
Total Revenues 750,431 750,431 78,086 617,533 617,533 (132,898) 82%
EXPENDITURES:
Radio
Personnel 1110 86,989 86,989 6,386 56,853 56,853 (30,136) 65%
Utilities 1110 7,050 7,050 489 4,994 4,994 (2,056) 71%
Maintenance 1110 17,930 17,930 - 16,074 16,102 (1,828) 90%
Other Operating 1110 46,975 46,975 1,678 18,586 28,206 (18,769) 60%
Voice Over IP
Personnel 1115 55,719 55,719 3,256 50,552 50,552 (5,167) 91%
Contract Services 1115 30 47,000 47,000 - 35,549 35,549 (11,451) 76%
Other Operating 1115 113,824 100,624 22,836 74,952 74,952 (25,672) 74%
Technology Capital 1115 30 84,323 103,952 - 39,859 87,220 (16,732) 84%
Cell Phones 1117 241,222 241,222 18,616 174,832 174,832 (66,390) 72%
Telephone Landlines 1116 49,399 62,599 (14,895) 53,282 53,282 (9,317) 85%
Total Expenditures 750,431 770,060 38,366 525,533 582,542 (187,518) 76%
Revenue Over/(Under) Expenditures - (19,629) 39,720 92,000 34,991
Ending Fund Balance 184,949 165,320 219,940
THE CITY OF SAN ANGELO, TEXAS
Schedule of Revenues and Expenditures
Fiscal Year through July 31, 2018
Communications - Fund 305
Page 42
83% of
Year Lapsed
Original Current Month YTD YTD Over/(Under) %
Dept Budget Budget Actual Total W/Enc Budget Realized
Beginning Fund Balance (19,109) (19,109) (19,109)
CLINIC OPERATIONS
REVENUES:
Reimbursed Expenditures 1606 31 101,200 101,200 - 68,895 68,895 (32,305) 68%
Total Revenues 101,200 101,200 - 68,895 68,895 (32,305) 68%
EXPENDITURES:
Operating Costs 1606 345,706 345,706 28,918 261,850 313,071 (32,635) 91%
Total Expenditures 345,706 345,706 28,918 261,850 313,071 (32,635) 91%
Revenue Over/(Under) Expenditures (244,506) (244,506) (28,918) (192,955) (244,176) (64,940) 100%
GROUP MEDICAL
REVENUES:
Stop Loss Reimbursement 1620 310,000 310,000 18,875 124,895 124,895 (185,105) 40%
City Contribution - Emp Premiums 1620 31 4,657,572 4,657,572 390,966 3,181,801 3,181,801 (1,475,771) 68%
City Contribution - Retiree Premiums 1620 31 1,466,814 1,466,814 151,648 1,444,216 1,444,216 (22,598) 98%
Employee/Dependent Premiums 1620 31 1,469,338 1,469,338 163,384 1,819,569 1,819,569 350,231 124%
Retiree/Dependent/Other Premiums 1620 31 773,721 773,721 70,652 625,977 625,977 (147,744) 81%
Total Revenues 8,677,445 8,677,445 795,525 7,196,458 7,196,458 (1,480,987) 83%
EXPENDITURES:
Personnel Costs 1620 122,165 132,738 13,938 117,871 117,871 (14,867) 89%
Professional Services 1620 31 48,000 48,000 - 36,000 36,000 (12,000) 75%
COBRA Administration 1620 31 17,250 17,250 2,205 13,125 15,509 (1,741) 90%
Insurance Premiums 1620 31 96,000 96,000 2,195 17,520 21,813 (74,187) 23%
Insurance Stop Loss 1620 31 1,000,000 1,000,000 65,720 583,595 583,595 (416,405) 58%
Health Plan Claims 1620 31 6,624,730 6,614,157 556,170 5,396,021 5,396,021 (1,218,136) 82%
Other Operating 1620 6,390 6,390 - 2,463 2,463 (3,927) 39%
Administration Fee 1620 31 518,404 518,404 41,299 370,729 370,729 (147,675) 72%
Total Expenditures 8,432,939 8,432,939 681,527 6,537,324 6,544,001 (1,888,938) 78%
Revenue Over/(Under) Expenditures 244,506 244,506 113,998 659,134 652,457
Revenue Over/(Under) Expenditures - - 85,080 466,179 408,281
Ending Fund Balance (19,109) (19,109) 466,179 389,172
THE CITY OF SAN ANGELO, TEXAS
Schedule of Revenues and Expenditures
Fiscal Year through July 31, 2018
Employee Self-Insurance - Fund 310
Page 43
83% of
Year Lapsed
Original Current Month YTD YTD Over/(Under) %
Dept Budget Budget Actual Total W/Enc Budget Realized
Beginning Fund Balance 741,977 741,977 741,977
REVENUES:
Premium Contributions 32 523,154 523,154 37,870 378,700 378,700 (144,454) 72%
Insurance Recovery 297,686 761,414 4,701 422,905 422,905 (338,509) 56%
Interest Income 28,672 28,672 1,899 14,993 14,993 (13,679) 52%
Total Revenues 849,512 1,313,240 44,470 816,598 816,598 (496,642) 62%
EXPENDITURES:
Prior Years Indemnity 1603 32 100,000 350,000 - 263,364 278,333 (71,667) 80%
Self-Insured Losses 1603 32 123,846 123,846 4,190 7,706 7,706 (116,140) 6%
Insurance Premiums 1603 126,699 126,699 (7,779) 82,233 82,233 (44,466) 65%
Expected Claims Liability 1603 32 133,141 133,141 12,289 96,549 96,549 (36,592) 73%
Claims Expense 1603 - 479,511 9,420 113,247 113,247 (366,264) 24%
Administrative Services 1603 365,826 365,826 16,857 154,336 154,336 (211,490) 42%
Total Expenditures 849,512 1,579,023 34,977 717,435 732,404 (846,619) 46%
Revenue Over/(Under) Expenditures - (265,783) 9,493 99,163 84,194
Ending Fund Balance 741,977 476,194 826,171
THE CITY OF SAN ANGELO, TEXAS
Schedule of Revenues and Expenditures
Fiscal Year through July 31, 2018
Property and Casualty Insurance - Fund 320
Page 44
83% of
Year Lapsed
Original Current Month YTD YTD Over/(Under) %
Dept Budget Budget Actual Total W/Enc Budget Realized
Beginning Fund Balance (856,170) (856,170) (856,170)
REVENUES:
Premium Contributions 33 1,350,667 1,350,667 113,547 1,137,305 1,137,305 (213,362) 84%
Insurance Recovery 33 34,465 34,465 - - - (34,465) 0%
Reimbursed Expenses 33 - - 75 320 320 320 0%
Interest Income - - - 1,098 1,098 1,098 0%
Total Revenues 1,385,132 1,385,132 113,622 1,138,723 1,138,723 (246,409) 82%
EXPENDITURES:
Risk Administration 1601 298,649 305,649 15,508 183,397 183,397 (122,252) 60%
Prior Years' Indemnity 1604 33 10,000 6,500 - - - (6,500) 0%
Prior Years' Medical 1604 33 10,000 6,500 - - - (6,500) 0%
Current Year Indemnity 1604 33 131,383 131,383 1,675 58,147 58,490 (72,893) 45%
Current Medical 1604 482,481 482,481 11,289 201,920 201,920 (280,561) 42%
Claims Administration 1604 20,000 20,000 2,761 7,042 7,322 (12,678) 37%
Total Expenditures 952,513 952,513 31,233 450,506 451,129 (501,384) 47%
Revenue Over/(Under) Expenditures 432,619 432,619 82,389 688,217 687,594
Ending Fund Balance (423,551) (423,551) (168,576)
THE CITY OF SAN ANGELO, TEXAS
Schedule of Revenues and Expenditures
Fiscal Year through July 31, 2018
Workers' Compensation - Fund 330
Page 45
83% of
Year Lapsed
Original Current Month YTD Over/(Under) %
Budget Budget Actual Total Budget Realized
REVENUES:
Income-Sales & Use Tax # 2,198,000 2,380,000 216,680 2,154,020 (225,980) 91%
Interest on Investments # 23,000 23,000 28,339 169,612 146,612 737%
Lease Income 85,250 74,965 13,093 59,935 (15,030) 80%
Misc. Income # - - - 200 200 0%
Gain on Sale of Assets # 250,000 250,000 - - (250,000) 0%
Total Revenues 2,556,250 2,727,965 258,112 2,383,767 (344,198) 87%
EXPENDITURES:
Administrative # 137,274 161,474 14,540 71,437 (90,037) 44%
Partner Affiliations 76,197 76,197 (16) 73,409 (2,788) 96%
City Services # 433,566 433,566 - - (433,566) 0%
Annual Report # 1,200 1,200 - 240 (960) 20%
Industrial Park Ops & Maint 30,650 30,650 350 4,159 (26,491) 14%
Outside Legal Services # 25,000 25,000 - 125 (24,875) 1%
Marketing-Chamber of Commerce # 225,000 225,000 18,750 155,951 (69,049) 69%
Business Ret & Exp Program # 696,000 324,765 9,734 12,515 (312,250) 4%
Promotion (SADC Marketing) # 10,300 10,300 - 1,811 (8,489) 18%
Business Resource Center 35,281 35,281 1,746 23,208 (12,073) 66%
Business Factory # 93,873 94,373 2,019 51,285 (43,088) 54%
Projects
Martifer-Hirschfeld # 1,390,435 1,390,435 - - (1,390,435) 0%
Blue Cross Blue Shield # 111,355 111,355 37,118 37,118 (74,237) 33%
Air Service Marketing # - 60,000 5,000 39,045 (20,955) 65%
MedHab # 796,250 796,250 - - (796,250) 0%
DeCoty Coffee # 96,902 96,902 - 15,168 (81,734) 16%
Time Clock Plus # 10,500 - - - - 0%
TGC/GAFB # 633,000 633,000 - 624,601 (8,399) 99%
Phase I Sewer Extension # 39,560 - - - - 0%
Principle LED # 194,005 194,005 - 85,000 (109,005) 44%
Phase II Sewer Line # 96,000 96,000 - - (96,000) 0%
TXDOT Aside Program Grant # 100,000 100,000 - 39,500 (60,500) 40%
CalTech # 583,999 583,999 - 1,100 (582,899) 0%
Parkhill # - 280,000 5,836 191,624 (88,376) 68%
Grant Works # 4,000 54,000 - 4,000 (50,000) 7%
Houston Harte 45 3,000 103,000 - 46,643 (56,357) 45%
Netco 45 190,000 60,000 - 50,000 (10,000) 83%
Elite Solutions 45 - 40,260 - - (40,260) 0%
GAFB 45 - 1,500,000 - - (1,500,000) 0%
Industrial Park Phase II 45 - 2,000,000 - - (2,000,000) 0%
Sunken Garden Design 45 - 75,000 - - (75,000) 0%
Howard College Construction 45 - 168,000 - 39,970 (128,030) 24%
Engine Pro Machine 45 - 5,975 - - (5,975) 0%
Airport Hangar Repair 45 - 25,000 - - (25,000) 0%
Future Projects 45 736,603 647,763 - - (647,763) 0%
Capital Purchases # 31,612 31,612 - - (31,612) 0%
Total Expenditures 6,781,562 10,470,362 95,077 1,567,909 (8,902,453) 15%
Revenue Over/(Under) Expenditures (4,225,312) (7,742,397) 163,035 815,858 8,558,255
THE CITY OF SAN ANGELO, TEXAS
Schedule of Revenues and Expenditures
Fiscal Year through July 31, 2018
San Angelo Development Corporation - Economic Development
Page 46
83% of
Year Lapsed
Original Current Month YTD Over/(Under) %
Budget Budget Actual Total Budget Realized
REVENUES:
Income-Sales & Use Tax # 5,652,000 6,120,000 557,178 5,538,912 (581,088) 91%
Interest on Investments # 4,000 4,000 13,771 52,882 48,882 1322%
Total Revenues 5,656,000 6,124,000 570,949 5,591,794 (532,206) 91%
EXPENDITURES:
Administrative 41 3,500 3,500 - 2,467 (1,033) 70%
City Services # 144,522 144,522 - - (144,522) 0%
Loan/Debt Service # 4,744,285 5,126,270 - - (5,126,270) 0%
Projects
Sports Facilities Maintenance # 291,061 285,353 - 285,353 - 100%
Affordable Housing # 357,674 357,674 47,533 286,333 (71,341) 80%
West Texas Water Partnership # 12,480 200,000 1,523 30,129 (169,871) 15%
Red Arroyo SW Basin # 38,470 - - - - 0%
Future Projects # 137,632 80,305 - - (80,305) 0%
Total Expenditures 5,729,624 6,197,624 49,056 604,282 (5,593,342) 10%
Revenue Over/(Under) Expenditures (73,624) (73,624) 521,893 4,987,512 5,061,136
THE CITY OF SAN ANGELO, TEXAS
Schedule of Revenues and Expenditures
Fiscal Year through July 31, 2018
San Angelo Development Corporation - Ballot
Page 47

1807 blue book

  • 1.
  • 2.
    Page Accounting ContactBudget Contact GENERAL Major Operating Funds Summary 1 Fund 101 General 2-5 Asst Finance Director Budget Coordinator Fund 105 General Debt Service 6 H. Ryan Gaddy Kimberly Holle Fund 106 TIRZ 7 (325) 481-2649 (325) 657-4211 Fund 501 General Equipment Replacement 8 Fund 502 General Capital Projects 9 Certificate of Obligation Capital Projects Cash & Debt Analyst Budget Coordinator Fund 514 2011A Tax/Revenue 10 Dale Hahn Kimberly Holle Fund 517 2015 Certificate of Obligation 11 (325) 657-4251 (325) 657-4211 Fund 519 2016 Streets Certificate of Obligation 12 Fund 523 2017 Communications Certificate of Obligation 13 Fund 526 2018 Streets Certificate of Obligation 14 WATER / WATER RECLAMATION Senior Accountant Budget Analyst, Sr. Fund 260 Water Enterprise 15 Jose Menchaca Moises Flores Fund 261 Water Debt Service 16 (325) 481-1229 (325) 657-2757 Fund 512 Water Line/Supply Capital Project 17 Fund 516 Hickory Water Supply 18 Fund 640 Lake Nasworthy 19 Fund 270 Water Reclamation 20 Fund 271 Water Reclamation Debt Service 21 Fund 520 Water Reclamation Capital Projects 22 Fund 230 Solid Waste Enterprise 23 Fund 240 Storm Water 24 ENTERPRISE ACTIVITIES Asst Finance Director Budget Analyst, Sr. Fund 220 Airport Operating 25 H. Ryan Gaddy Angela Bloss Fund 529 Airport PFC 26 (325) 481-2649 (325) 653-6291 Fund 530 Airport FAA Projects 27 Fund 201 State Office Building Operations 28 Fund 203 Texas Bank Sports Complex 29 Fund 410 Civic Events 30 Fund 420 Fort Concho 31 Fund 440 Fairmount Cemetery 32 SPECIAL REVENUE FUNDS Cash & Debt Analyst Budget Analyst, Sr. Fund 103 Intergovernmental 33-34 Dale Hahn Angela Bloss Fund 452 Community Development Block Grant - Prior Year 35 (325) 657-4251 (325) 653-6291 Fund 453 Community Development Block Grant - Current Year 36 Fund 482 HOME - Prior Year 37 Fund 483 HOME - Current Year 38 Fund 601 Designated Revenue 39 Fund 605 Hotel Occupancy Tax 40 INTERNAL SERVICES Accountant Budget Analyst, Sr. Fund 301 Fleet Services 41 Jonathan Flores Moises Flores Fund 305 Communications 42 (325) 657-4401 (325) 657-2757 Fund 310 Health/Dental Insurance 43 Fund 320 Property and Casualty Insurance 44 Fund 330 Workers' Compensation 45 SAN ANGELO DEVELOPMENT CORPORATION Accountant Budget Coordinator Economic Development 46 Jonathan Flores Kimberly Holle Ballot 47 (325) 657-4401 (325) 657-4211 Table of Contents THE CITY OF SAN ANGELO, TEXAS Schedules of Revenues and Expenditures Fiscal Year through July 31, 2018
  • 3.
    83% of Year Lapsed Over/ OriginalCurrent Month YTD (Under) % Budget Budget Actual W/Enc Budget Realized GENERAL FUND Revenues 72,503,327 73,675,664 4,062,094 66,720,219 (6,955,445) 91% Expenses (72,503,327) (77,811,329) (5,456,514) (61,462,390) (16,348,939) 79% Revenues over/(under) Expenditures - (4,135,665) (1,394,420) 5,257,829 July 31, 2017 (1,063,952) 8,171,940 WATER ENTERPRISE FUND Revenues 27,604,426 27,604,426 3,173,703 23,666,297 (3,938,129) 86% Expenses (26,743,245) (28,855,783) (1,834,586) (21,927,763) (6,928,020) 76% Revenues over/(under) Expenditures 861,181 (1,251,357) 1,339,117 1,738,534 July 31, 2017 996,025 3,694,541 WATER RECLAMATION FUND Revenues 13,392,433 13,392,433 1,289,049 12,049,817 (1,342,616) 90% Expenses (11,638,848) (16,373,389) (830,564) (12,745,956) (3,627,433) 78% Revenues over/(under) Expenditures 1,753,585 (2,980,956) 458,485 (696,139) July 31, 2017 164,980 2,411,454 THE CITY OF SAN ANGELO, TEXAS Major Operating Funds Summary Schedule of Revenues and Expenditures Fiscal Year through July 31, 2018 Page 1
  • 4.
    83% of Year Lapsed OriginalCurrent Month YTD YTD Over/(Under) % Budget Budget Actual Total W/Enc Budget Realized Beginning Fund Balance 21,230,272 21,230,272 21,230,272 REVENUES: Property, Sales, Franchise 57,920,448 57,920,448 2,816,193 54,842,638 54,842,638 (3,077,810) 95% Licenses and Permits 912,706 930,206 68,525 740,038 740,038 (190,168) 80% Charges for Service 4,696,655 5,520,274 442,672 3,934,833 3,934,833 (1,585,441) 71% Fines and Forfeitures 3,128,616 3,128,116 322,362 2,501,019 2,501,019 (627,097) 80% Miscellaneous 1,255,318 1,512,036 104,014 1,063,792 1,063,792 (448,244) 70% Transfers In 4,589,584 4,664,584 308,328 3,637,899 3,637,899 (1,026,685) 78% Total Revenues 72,503,327 73,675,664 4,062,094 66,720,219 66,720,219 (6,955,445) 91% EXPENDITURES: General Government 6,589,659 6,799,903 437,820 5,090,696 5,272,089 (1,527,814) 78% Administrative Services 6,606,306 8,511,971 467,925 5,237,620 5,416,542 (3,095,429) 64% Development Services 1,948,373 1,950,592 148,801 1,574,469 1,597,215 (353,377) 82% Neighborhood and Family Services 1,368,314 1,461,958 106,791 1,103,002 1,125,149 (336,809) 77% Public Health 232,116 232,116 19,219 187,603 190,260 (41,856) 82% Public Works 10,018,406 11,874,158 441,814 4,529,021 9,379,635 (66,453) 81% Public Services 4,641,690 4,807,899 402,999 3,507,542 3,599,511 (1,208,388) 75% Public Safety 37,826,808 38,901,077 3,158,507 31,939,892 32,155,610 (6,745,467) 83% Transfers Out 3,271,655 3,271,655 272,638 2,726,379 2,726,379 (545,276) 83% Total Expenditures 72,503,327 77,811,329 5,456,514 55,896,224 61,462,390 (16,348,939) 79% Revenue Over/(Under) Expenditures - (4,135,665) (1,394,420) 10,823,995 5,257,829 Ending Fund Balance 21,230,272 17,094,607 26,488,101 THE CITY OF SAN ANGELO, TEXAS Schedule of Revenues and Expenditures Fiscal Year through July 31, 2018 General - Fund 101 Page 2
  • 5.
    83% of Year Lapsed OriginalCurrent Month YTD YTD Over/(Under) % Budget Budget Actual Total W/Enc Budget Realized REVENUES: Taxes: Property Taxes 33,712,096 33,712,096 408,729 33,337,173 33,337,173 (374,923) 99% Sales Taxes 10 17,000,000 17,000,000 1,523,855 15,368,539 15,368,539 (1,631,461) 90% Alcoholic Beverage Taxes 10 375,000 375,000 95,341 353,657 353,657 (21,343) 94% Bingo Taxes 10 42,526 42,526 - 2 2 (42,524) 0% Franchise Fees 6,790,826 6,790,826 788,268 5,783,267 5,783,267 (1,007,559) 85% Total Taxes 57,920,448 57,920,448 2,816,193 54,842,638 54,842,638 (3,077,810) 95% Licenses and Permits: Licenses 52,388 52,388 2,838 49,541 49,541 (2,847) 95% Permits 809,081 826,581 63,742 666,359 666,359 (160,222) 81% Inspections 51,237 51,237 1,945 24,138 24,138 (27,099) 47% Total Licenses and Permits 912,706 930,206 68,525 740,038 740,038 (190,168) 80% Charges for Services: Ambulance 3,510,000 3,944,489 255,606 2,600,821 2,600,821 (1,343,668) 66% Nature Center 10 40,000 40,000 3,195 37,999 37,999 (2,001) 95% Recreation 359,650 359,650 39,038 279,052 279,052 (80,598) 78% Swimming Pool 166,550 166,550 36,106 129,328 129,328 (37,222) 78% Animal Services 88,379 70,879 6,985 54,139 54,139 (16,740) 76% Public Safety 66,000 66,000 6,044 46,223 46,223 (19,777) 70% Legal & Real Estate 129,126 129,126 4,728 101,993 101,993 (27,133) 79% Crossing Guards 10 130,700 130,700 36,467 132,017 132,017 1,317 101% Street & Bridge 10 45,500 445,500 42,045 431,416 431,416 (14,084) 97% Code / CDBG 10 158,750 165,380 12,505 123,117 123,117 (42,263) 74% Other 2,000 2,000 (47) (1,272) (1,272) (3,272) -64% Total Charges for Services 4,696,655 5,520,274 442,672 3,934,833 3,934,833 (1,585,441) 71% Fines and Forfeitures: Municipal Court 3,128,616 3,128,116 322,362 2,501,019 2,501,019 (627,097) 80% Total Fines and Forfeitures 3,128,616 3,128,116 322,362 2,501,019 2,501,019 (627,097) 80% Interest and Miscellaneous: Interest 418,466 418,466 62,981 457,150 457,150 38,684 109% Reimbursed Expenses 542,800 794,518 14,687 362,134 362,134 (432,384) 46% Alarm Charge 10 188,526 188,526 20,100 155,275 155,275 (33,251) 82% Miscellaneous 105,526 110,526 6,246 89,233 89,233 (21,293) 81% Total Interest and Miscellaneous 1,255,318 1,512,036 104,014 1,063,792 1,063,792 (448,244) 70% Transfers In 4,589,584 4,664,584 308,328 3,637,899 3,637,899 (1,026,685) 78% General Fund Revenues 72,503,327 73,675,664 4,062,094 66,720,219 66,720,219 (6,955,445) 91% THE CITY OF SAN ANGELO, TEXAS Schedule of Revenues and Expenditures Fiscal Year through July 31, 2018 General - Fund 101 Page 3
  • 6.
    83% of Year Lapsed OriginalCurrent Month YTD YTD Over/(Under) % Budget Budget Actual Total W/Enc Budget Realized EXPENDITURES: General Government: City Council 156,989 176,259 3,597 119,699 119,699 (56,560) 68% City Manager 719,704 700,434 58,082 549,452 549,507 (150,927) 78% Legal 653,370 658,201 55,545 541,264 542,234 (115,967) 82% Public Information 456,417 924,371 28,933 505,861 649,608 (274,763) 70% City Clerk 261,721 246,721 15,464 192,257 193,960 (52,761) 79% Construction Management 127,791 136,559 8,555 115,702 115,702 (20,857) 85% Development Corporation 489,934 489,934 37,226 390,088 390,088 (99,846) 80% Human Resources 2,402,668 2,469,194 223,728 2,132,499 2,134,819 (334,375) 86% Internal Audit 76,863 76,863 6,273 62,270 62,270 (14,593) 81% Crossing Guards 130,700 166,670 417 100,926 133,524 (33,146) 80% Non-Departmental 1,113,502 754,697 - 380,678 380,678 (374,019) 50% Total General Government 6,589,659 6,799,903 437,820 5,090,696 5,272,089 (1,527,814) 78% Administrative Services: Finance 1,666,864 1,701,230 134,023 1,358,523 1,434,005 (267,225) 84% Billing & Receipts 704,861 750,931 38,938 561,196 632,803 (118,128) 84% Information Technology 647,407 847,407 34,257 556,988 556,988 (290,419) 66% Purchasing 169,287 177,429 14,598 127,988 127,988 (49,441) 72% Municipal Court 2,565,208 3,554,046 197,002 1,951,456 1,969,519 (1,584,527) 55% Real Estate 175,450 170,619 13,687 125,969 126,119 (44,500) 74% City Hall/Building Maint. 677,229 1,310,309 35,420 555,500 569,120 (741,189) 43% Total Administrative Services 6,606,306 8,511,971 467,925 5,237,620 5,416,542 (3,095,429) 64% Development Services Administration 467,510 460,889 32,295 352,436 371,564 (89,325) 81% GIS 301,144 301,144 23,634 233,822 233,822 (67,322) 78% Planning/Zoning 296,139 304,739 24,521 250,107 253,725 (51,014) 83% Permits/Inspections 883,580 883,820 68,351 738,104 738,104 (145,716) 84% Total Development Services 1,948,373 1,950,592 148,801 1,574,469 1,597,215 (353,377) 82% Neighborhood & Family Services Animal Services 914,880 1,057,722 74,664 761,568 783,600 (274,122) 74% Code Compliance 453,434 404,236 32,127 341,434 341,549 (62,687) 84% Total Neighborhood & Fam. Serv. 1,368,314 1,461,958 106,791 1,103,002 1,125,149 (336,809) 77% Public Health: Health Administration 176,616 176,616 14,594 145,972 148,629 (27,987) 84% MHMR 10 55,500 55,500 4,625 41,631 41,631 (13,869) 75% Total Public Health 232,116 232,116 19,219 187,603 190,260 (41,856) 82% THE CITY OF SAN ANGELO, TEXAS Schedule of Revenues and Expenditures Fiscal Year through July 31, 2018 General - Fund 101 Page 4
  • 7.
    83% of Year Lapsed OriginalCurrent Month YTD YTD Over/(Under) % Budget Budget Actual Total W/Enc Budget Realized Public Works: Street and Bridge 6,346,045 7,652,392 156,182 1,684,715 6,102,923 (1,549,469) 80% Street Lighting 10 1,118,829 1,118,829 82,720 795,841 804,970 (313,859) 72% Signal System 986,806 1,531,711 70,089 838,009 1,261,201 (270,510) 82% Engineering 1,209,596 1,214,096 106,106 919,851 919,864 (294,232) 76% Operations 357,130 357,130 26,717 290,605 290,677 (66,453) 81% Total Operations 10,018,406 11,874,158 441,814 4,529,021 9,379,635 (2,494,523) 79% Public Services: Parks 3,419,845 3,356,177 268,060 2,663,237 2,713,170 (643,007) 81% Nature Center 10 20,000 20,000 1,742 10,038 10,038 (9,962) 50% Swimming Pool 166,935 258,144 46,641 104,601 114,208 (143,936) 44% Water Lily Garden 10 102,346 177,346 8,529 93,609 102,138 (75,208) 58% Recreation 932,564 996,232 78,027 636,057 659,957 (336,275) 66% Total Public Services 4,641,690 4,807,899 402,999 3,507,542 3,599,511 (1,208,388) 75% Public Safety: Police: Police 18,646,134 18,818,483 1,534,067 15,827,206 15,899,272 (2,919,211) 84% Communications Center 1,516,048 1,578,208 143,774 1,214,508 1,216,433 (361,775) 77% Fire: Fire & Ambulance 16,926,633 17,755,999 1,410,183 14,233,758 14,374,003 (3,381,996) 81% Fire Marshal 737,993 748,387 70,483 664,420 665,902 (82,485) 89% Total Public Safety 37,826,808 38,901,077 3,158,507 31,939,892 32,155,610 (6,745,467) 83% Transfers Out 3,271,655 3,271,655 272,638 2,726,379 2,726,379 (545,276) 83% General Fund Expenditures 71,588,447 76,753,607 5,381,850 55,134,656 60,678,790 (16,074,817) 79% THE CITY OF SAN ANGELO, TEXAS Schedule of Revenues and Expenditures Fiscal Year through July 31, 2018 General - Fund 101 Page 5
  • 8.
    83% of Year Lapsed OriginalCurrent Month YTD YTD Over/(Under) % Budget Budget Actual Total W/Enc Budget Realized Beginning Fund Balance 1,780,962 1,780,962 1,780,962 REVENUES: Current Taxes 10 4,519,800 4,519,800 46,159 4,461,849 4,461,849 (57,951) 99% Delinquent Taxes 10 46,676 46,676 3,337 57,815 57,815 11,139 124% Interest Income 4,500 4,500 4,557 27,658 27,658 23,158 615% Arbitrage Rebate 10 - - - 73,912 73,912 73,912 0% Transfer from General Fund 10 200,000 200,000 16,667 166,667 166,667 (33,333) 83% Transfer from Development Corp 10 2,709,822 2,626,270 - 2,174,182 2,174,182 (452,088) 83% Total Revenues 7,480,798 7,397,246 70,720 6,962,083 6,962,083 (435,163) 94% EXPENDITURES: Principal on Debt 10 5,324,696 5,575,000 - 4,240,000 4,240,000 (1,335,000) 76% Interest on Debt 10 2,140,968 2,182,749 - 988,426 988,426 (1,194,323) 45% Issue Costs 10 15,134 15,134 - 3,378 3,378 (11,756) 22% Total Expenditures 7,480,798 7,772,883 - 5,231,804 5,231,804 (2,541,079) 67% Revenue Over/(Under) Expenditures - (375,637) 70,720 1,730,279 1,730,279 Ending Fund Balance 1,780,962 1,405,325 3,511,241 THE CITY OF SAN ANGELO, TEXAS Schedule of Revenues and Expenditures Fiscal Year through July 31, 2018 General Debt Services - Fund 105 Page 6
  • 9.
    83% of Year Lapsed OriginalCurrent Month YTD YTD Over/(Under) % Dept Budget Budget Actual Total W/Enc Budget Realized SOUTH Beginning Zone Balance 390,486 390,486 390,486 REVENUES: Interest Income 3,892 3,892 250 4,505 4,505 614 116% Property Tax 10 315,758 315,758 - 311,180 311,180 (4,578) 99% Total Revenues 319,650 319,650 250 315,685 315,685 (3,965) 99% EXPENDITURES: Available for Assignment 2910 323,542 113,801 18 88,403 88,403 (25,398) 78% Private Incentives 10 - 361,513 24,120 24,120 24,120 (337,393) 7% MLK Transportation Enhancement 10 - 60,000 - - - (60,000) 0% Chadbourne Street 10 - 159,825 - - - (159,825) 0% Street Scape Maintenance 10 - 2,473 - - - (2,473) 0% Total Expenditures 323,542 697,612 24,138 112,523 112,523 (585,089) 16% Revenue Over/(Under) Expenditures (3,892) (377,962) (23,888) 203,162 203,162 Ending Zone Balance 386,594 12,524 593,648 NORTH Beginning Zone Balance 1,258,301 1,258,301 1,258,301 REVENUES: Interest Income 11,675 11,675 749 13,516 13,516 1,841 116% Property Tax 10 555,501 555,501 - 535,867 535,867 (19,634) 96% Total Revenues 567,176 567,176 749 549,383 549,383 (17,794) 97% EXPENDITURES: Available for Assignment 2920 563,284 803,566 1,050 232,162 232,162 (571,404) 29% Private Incentives 10 - 349,983 56,970 56,970 56,970 (293,013) 16% MLK Transportation Enhancement 10 - 60,000 - - - (60,000) 0% Chadbourne Street 10 - 141,794 - - - (141,794) 0% Street Scape Maintenance 10 - 2,924 - - - (2,924) 0% Incentives Set Aside 10 - 103,740 - - - (103,740) 0% Total Expenditures 563,284 1,462,007 58,020 289,132 289,132 (1,172,875) 20% Revenue Over/(Under) Expenditures 3,892 (894,831) (57,271) 260,251 260,251 Ending Zone Balance 1,262,193 363,470 1,518,552 Ending Fund Balance 1,648,787 375,994 2,112,200 THE CITY OF SAN ANGELO, TEXAS Schedule of Revenues and Expenditures Fiscal Year through July 31, 2018 TIRZ - Fund 106 Page 7
  • 10.
    83% of Year Lapsed OriginalCurrent Month YTD YTD Over/(Under) % Dept Budget Budget Actual Total W/Enc Budget Realized Beginning Fund Balance 349,018 349,018 349,018 REVENUES: Equipment Reserve: Sales of Fixed Assets 110,000 110,000 - 35,910 35,910 (74,090) 33% Insurance Proceeds 50 40,000 40,000 - 32,596 32,596 (7,404) 81% Interest Income - - 893 3,938 3,938 3,938 0% Transfer from General Fund 50 1,201,373 1,201,373 100,114 1,001,144 1,001,144 (200,229) 83% Total Revenues 1,351,373 1,351,373 101,007 1,073,588 1,073,588 (277,785) 79% EXPENDITURES: Equipment Reserve: Municipal Court Capital 1300 50 - 40,000 - 30,670 30,676 (9,324) 77% Street & Bridge Capital 3200 - 555,270 - 547,262 547,262 (8,008) 99% Parks Capital 6000 - 32,000 4,715 30,032 30,032 (1,968) 94% Code Compliance Capital 7500 - 25,000 - 23,214 23,214 (1,786) 93% Animal Services Capital 7803 50 - 90,000 225 77,643 77,643 (12,357) 86% Police Capital 8000 50 - 535,215 - 405,591 455,425 (79,790) 85% Ambulance Capital 9100 50 - 250,000 165,070 232,061 240,427 (9,573) 96% Fire Marshal 9300 50 - 32,000 4,079 30,337 30,337 (1,663) 95% Contingencies 9900 50 1,351,373 47,234 - - - (47,234) 0% Total Expenditures 1,351,373 1,606,719 174,089 1,376,810 1,435,016 (171,703) 89% Revenue Over/(Under) Expenditures - (255,346) (73,082) (303,222) (361,428) Ending Fund Balance 349,018 93,672 (12,410) General Equipment Replacement - Fund 501 THE CITY OF SAN ANGELO, TEXAS Schedule of Revenues and Expenditures Fiscal Year through July 31, 2018 Page 8
  • 11.
    83% of Year Lapsed OriginalCurrent Month YTD YTD Over/(Under) % Dept Budget Budget Actual Total W/Enc Budget Realized Beginning Fund Balance 4,038,114 4,038,114 4,038,114 REVENUES: Interest Income 5,705 5,705 10,226 38,846 38,846 33,141 681% Auditorium Donations 50 - 3,906,685 3,512,555 3,906,685 3,906,685 - 100% Interfund Transfers 244,295 244,295 20,358 203,579 203,579 (40,716) 83% Total Revenues 250,000 4,156,685 3,543,139 4,149,110 4,149,110 (7,575) 100% EXPENDITURES: City Hall Improvements 1901 50 - 198,051 747 11,252 11,252 (186,799) 6% City Hall Campus/Grounds 1920 - 2,552 - 1,534 1,534 (1,018) 60% Transportation Enhancement 2020 50 - 50,117 - 59,997 69,877 19,760 139% Street Maintenance 3200 50 - 49,358 - 49,356 49,356 (2) 100% Stormwater - Ave P Drainage 5800 50 - 2,080,000 3,203 741,507 820,172 (1,259,828) 39% City Dog Park 6005 50 - 7,551 - 7,551 7,551 - 100% Texas Sports Bank Complex 6019 50 - 659,908 39,316 67,866 433,718 (226,190) 66% 29th Street Sports Complex 6107 50 - 1,681,502 - 64,694 183,135 (1,498,367) 11% Fort Concho 6301 50 - 877,436 - 115,000 236,562 (640,874) 27% Fairmount Cemetery 6400 50 - 2,846 - - - (2,846) 0% Auditorium 6602 50 - 1,042,699 - 1,037,031 1,041,699 (1,000) 100% Fire Station 9000 50 - 148,320 8,000 8,000 8,000 (140,320) 5% Fire Truck 9000 50 250,000 1,249,991 12,006 12,006 1,110,600 (139,391) 89% Total Expenditures 250,000 8,050,331 63,272 2,175,794 3,973,456 (4,076,875) 49% Revenue Over/(Under) Expenditures - (3,893,646) 3,479,867 1,973,316 175,654 Ending Fund Balance 4,038,114 144,468 4,213,768 THE CITY OF SAN ANGELO, TEXAS Schedule of Revenues and Expenditures Fiscal Year through July 31, 2018 General Capital Projects - Fund 502 Page 9
  • 12.
    Previous Inception Current MonthYTD Over/(Under) Years to Dept Budget Actual W/Enc Budget Activity Date Beginning Fund Balance 1,083,888 1,083,888 REVENUES: C.O. Proceeds - - - - 13,780,000 13,780,000 Municipal Pool Donation - - - - 21,225 21,225 SASSRA Stock Barn 51 - - - - 157,722 157,722 Transfer from Dev. Corp. - - - - 4,220,000 4,220,000 Interest Income - 2,773 18,679 18,679 145,771 164,450 Total Revenues - 2,773 18,679 18,679 18,324,718 18,343,397 EXPENDITURES: Airport Terminal Rehab 3925 51 - - - - 500,000 500,000 Concho River 4119 51 327,650 - 41,179 (286,471) 8,272,352 8,313,531 Parks 6000 51 585,535 28,554 135,697 (449,838) 339,465 475,162 Red Arroyo Trail 6040 51 - - - - 325,000 325,000 Recreation 6100 75,000 - - (75,000) 2,597,817 2,597,817 Fort Concho Improvements 6301 51 61,892 - 61,892 - 38,109 100,001 Auditorium 6602 51 - - - - 3,750,001 3,750,001 Fairgrounds 6636 51 - - - - 1,157,722 1,157,722 Issue Costs 9900 51 - - - - 260,363 260,363 Total Expenditures 1,050,077 28,554 238,768 (811,309) 17,240,829 17,479,597 Revenue Over/(Under) Expenditures (1,050,077) (25,781) (220,089) Ending Fund Balance 33,811 863,799 THE CITY OF SAN ANGELO, TEXAS Schedule of Revenues and Expenditures Fiscal Year through July 31, 2018 2011A Tax/Revenue C.O. - Fund 514 Debt Payments Through 2024 For Airport, Ft. Concho, and Parks Improvements Page 10
  • 13.
    Previous Inception Current MonthYTD Over/(Under) Years to Dept Budget Actual W/Enc Budget Activity Date Beginning Fund Balance 5,180,490 5,180,490 REVENUES: C.O. Proceeds 51 - - - - 13,260,000 13,260,000 Reoffering Premium 51 - - - - 381,008 381,008 Replacement Proceeds 51 - - - - 1,000,000 1,000,000 Interest Income 51 - 13,256 72,295 72,295 121,510 193,805 Total Revenues - 13,256 72,295 72,295 14,762,518 14,834,813 EXPENDITURES: Police Communications Upgrade 1110 116,356 10,000 59,000 (57,356) 1,443,646 1,502,646 Public Safety Radio 1501 51 796,688 - 775,319 (21,369) 5,077,152 5,852,471 Fire Station 4 9000 51 3,145,940 127,016 3,088,597 (57,343) 120,221 3,208,818 Fire Training Center 9010 51 - - - - 2,800,001 2,800,001 Issue Costs 9900 51 - - - - 141,008 141,008 Total Expenditures 4,058,984 137,016 3,922,916 (136,068) 9,582,028 13,504,944 Revenue Over/(Under) Expenditures (4,058,984) (123,760) (3,850,621) Ending Fund Balance 1,121,506 1,329,869 Debt Payments Through 2035 THE CITY OF SAN ANGELO, TEXAS Schedule of Revenues and Expenditures Fiscal Year through July 31, 2018 2015 Certificate of Obligation - Fund 517 For Public Safety Facilities and Communication Upgrades Page 11
  • 14.
    Previous Inception Current MonthYTD Over/(Under) Years to Dept Budget Actual W/Enc Budget Activity Date Beginning Fund Balance 11,922,225 11,922,225 REVENUES: C.O. Proceeds 51 - - - - 15,615,000 15,615,000 Reoffering Premium 51 - - - - 538,531 538,531 Interest Income 51 - 30,507 181,508 181,508 194,072 375,580 Total Revenues - 30,507 181,508 181,508 16,347,603 16,529,111 EXPENDITURES: Street Construction 3200 11,728,153 212,867 11,666,597 (61,556) 4,271,847 15,938,444 Issue Costs 9900 51 - - - - 153,531 153,531 Total Expenditures 11,728,153 212,867 11,666,597 (61,556) 4,425,378 16,091,975 Revenue Over/(Under) Expenditures (11,728,153) (182,360) (11,485,089) Ending Fund Balance 194,072 437,136 Debt Payments Through 2036 THE CITY OF SAN ANGELO, TEXAS Schedule of Revenues and Expenditures Fiscal Year through July 31, 2018 2016 Streets Certificate of Obligation - Fund 519 For Street Improvements Page 12
  • 15.
    Previous Inception Current MonthYTD Over/(Under) Years to Dept Budget Actual W/Enc Budget Activity Date Beginning Fund Balance 1,764,580 1,764,580 REVENUES: C.O. Proceeds 52 - - - - 2,185,000 2,185,000 Reoffering Premium 52 - - - - 31,365 31,365 Interest Income 52 - 4,515 25,381 25,381 8,695 34,076 Total Revenues - 4,515 25,381 25,381 2,225,060 2,250,441 EXPENDITURES: Communications Software 1500 1,755,886 - 785,230 (970,656) 404,115 1,189,345 Issue Costs 9900 52 - - - - 56,365 56,365 Total Expenditures 1,755,886 - 785,230 (970,656) 460,480 1,245,710 Revenue Over/(Under) Expenditures (1,755,886) 4,515 (759,849) Ending Fund Balance 8,694 1,004,731 Debt Payments through 2024 THE CITY OF SAN ANGELO, TEXAS Schedule of Revenues and Expenditures Fiscal Year through July 31, 2018 2017 Communications Certificate of Obligation - Fund 523 For Communications Upgrades Page 13
  • 16.
    Previous Inception Current MonthYTD Over/(Under) Years to Dept Budget Actual W/Enc Budget Activity Date Beginning Fund Balance - - REVENUES: C.O. Proceeds 52 16,500,000 - 16,500,000 - - 16,500,000 Reoffering Premium 52 167,856 - 167,856 - - 167,856 Interest Income 52 - - - - - - Total Revenues 16,667,856 - 16,667,856 - - 16,667,856 EXPENDITURES: Street Construction 3200 16,504,106 - 3,413,702 (13,090,404) - 3,413,702 Issue Costs 9900 52 163,750 - 163,750 - - 163,750 Total Expenditures 16,667,856 - 3,577,452 (13,090,404) - 3,577,452 Revenue Over/(Under) Expenditures - - 13,090,404 Ending Fund Balance - 13,090,404 Debt Payments through 2038 THE CITY OF SAN ANGELO, TEXAS Schedule of Revenues and Expenditures Fiscal Year through July 31, 2018 2018 Streets Certificate of Obligation - Fund 526 For Street Improvements Page 14
  • 17.
    83% of Year Lapsed OriginalCurrent Month YTD YTD Over/(Under) % Dept Budget Budget Actual Total W/Enc Budget Realized Beginning Fund Balance 6,123,376 6,123,376 6,123,376 REVENUES: Water Sales 26 23,708,262 23,708,262 2,746,485 20,353,308 20,353,308 (3,354,954) 86% Lake Use Revenues 378,717 378,717 107,807 412,949 412,949 34,232 109% Billing and Collection 2,395,324 2,395,324 215,520 1,842,115 1,842,115 (553,209) 77% Paving Cuts 26 20,000 20,000 9,850 49,775 49,775 29,775 249% Taps and Connections 325,000 325,000 35,140 239,767 239,767 (85,233) 74% Other Operating Revenues 37,500 37,500 107 28,272 28,272 (9,228) 75% Ford Ranch Lease 26 295,570 295,570 - 286,904 286,904 (8,666) 97% Ford Ranch Other 26 - - 375 3,831 3,831 3,831 0% Farm Lease 26 14,127 14,127 - 14,127 14,127 - 100% Transfers In 390,381 390,381 42,750 338,804 338,804 (51,577) 87% Interest 39,545 39,545 15,669 96,445 96,445 56,900 244% Total Revenues 27,604,426 27,604,426 3,173,703 23,666,297 23,666,297 (3,938,129) 86% EXPENDITURES: Administration 4000 4,193,974 4,267,198 366,000 3,566,068 3,587,318 (679,880) 84% Conservation 4002 122,705 122,705 4,688 66,881 66,881 (55,824) 55% Insurance 4501 367,304 367,304 27,678 306,948 306,948 (60,356) 84% Billing/Collection 1700 1,155,338 1,166,185 90,127 754,833 771,792 (394,393) 66% Supply (1) 3,158,434 3,282,695 144,678 2,297,118 2,659,766 (622,929) 81% Pecan Creek 4160 26 6,800 11,378 - - - (11,378) 0% Treatment 4200 3,651,840 3,969,139 217,320 2,544,610 3,223,619 (745,520) 81% Treatment - Lab 4201 525,111 544,250 51,672 440,835 459,710 (84,540) 84% Distribution 4301 2,978,817 2,824,376 161,551 1,808,499 1,875,306 (949,070) 66% Distribution - Utilities 4302 1,304,431 1,356,381 82,115 944,776 945,964 (410,417) 70% New Services 4401 26 100,000 100,000 - 96,910 96,910 (3,090) 97% New Fire Hydrants 4402 26 50,000 50,000 - 3,144 3,144 (46,856) 6% Meter Replacements 4403 26 200,000 200,000 - 95,317 95,317 (104,683) 48% O.C. Fisher Contract 4115 26 65,000 65,000 - 50,094 50,094 (14,906) 77% Water Main Extension 4404 26 50,000 50,000 - 12,706 12,706 (37,294) 25% Transfers (Net) 4503 6,376,274 7,403,848 616,988 6,169,873 6,169,873 (1,233,975) 83% Capital Outlay 4400 2,437,217 3,075,324 71,769 752,727 1,602,415 (1,472,909) 52% Total Expenditures 26,743,245 28,855,783 1,834,586 19,911,339 21,927,763 (6,928,020) 76% Revenue Over/(Under) Expenditures 861,181 (1,251,357) 1,339,117 3,754,958 1,738,534 Ending Fund Balance 6,984,557 4,872,019 7,861,910 (1): 4102,4108,4109,4110,4111,4112,4113,4114 THE CITY OF SAN ANGELO, TEXAS Schedule of Revenues and Expenditures Fiscal Year through July 31, 2018 Water Enterprise - Fund 260 Page 15
  • 18.
    83% of Year Lapsed OriginalCurrent Month YTD YTD Over/(Under) % Dept Budget Budget Actual Total W/Enc Budget Realized Beginning Fund Balance 19,060 19,060 19,060 REVENUES: Transfer In 11,474,221 11,474,221 747,851 9,978,517 9,978,517 (1,495,704) 87% Interest Income - - - 31,970 31,970 31,970 0% Total Revenues 11,474,221 11,474,221 747,851 10,010,487 10,010,487 (1,463,734) 87% EXPENDITURES: Principal 5301 26 8,231,960 8,231,960 - 8,231,960 8,231,960 - 100% Interest 5301 26 3,236,552 3,236,552 - 1,634,187 1,634,187 (1,602,365) 50% Issue Costs 5301 26 5,709 5,612 - (1,020) (1,020) (6,632) -18% Total Expenditures 11,474,221 11,474,124 - 9,865,127 9,865,127 (1,608,997) 86% Revenue Over/(Under) Expenditures - 97 747,851 145,360 145,360 Ending Fund Balance 19,060 19,157 164,420 THE CITY OF SAN ANGELO, TEXAS Schedule of Revenues and Expenditures Fiscal Year through July 31, 2018 Water Debt Service - Fund 261 Page 16
  • 19.
    83% of Year Lapsed OriginalCurrent Month YTD YTD Over/(Under) % Dept Budget Budget Actual Total W/Enc Budget Realized Beginning Fund Balance 7,856,537 7,856,537 7,856,537 REVENUES: 512‐4021‐343.10‐00 Water Sales 51 3,233,211 3,233,211 389,767 2,801,910 2,801,910 (431,301) 87% Water Sales - CIP 51 1,454,659 1,454,659 123,467 1,231,198 1,231,198 (223,461) 85% Transfer from Dev Corp 51 200,000 200,000 12,227 33,656 33,656 (166,344) 17% Interest Income 95,076 95,076 20,103 137,914 137,914 42,838 145% Total Revenues 4,982,946 4,982,946 545,564 4,204,678 4,204,678 (778,268) 84% EXPENDITURES: Transfers Out - Debt Service 1994 51 1,570,373 1,570,373 130,864 1,308,644 1,308,644 (261,729) 83% Transfers Out - Franchise Fee 4100 51 234,394 234,394 25,662 201,655 201,655 (32,739) 86% Water Line Supply Projects 4100 51 2,978,179 7,598,296 455,337 1,104,117 7,598,296 - 100% West Texas Water Partnership 4100 51 - 200,000 4,725 33,230 33,230 (166,770) 17% Consultants - Watermaster 4128 51 200,000 200,000 - 191,631 191,631 (8,369) 96% Total Expenditures 4,982,946 9,803,063 616,588 2,839,277 9,333,456 (469,607) 95% Revenue Over/(Under) Expenditures - (4,820,117) (71,024) 1,365,401 (5,128,778) Ending Fund Balance 7,856,537 3,036,420 2,727,759 THE CITY OF SAN ANGELO, TEXAS Schedule of Revenues and Expenditures Fiscal Year through July 31, 2018 Water Line/Supply Capital Projects - Fund 512 Page 17
  • 20.
    83% of Year Lapsed PreviousInception Current Month YTD Over/(Under) Years to Dept Budget Actual W/Enc Budget Activity Date Beginning Fund Balance 2,214,077 2,214,077 REVENUES: Interest - 5,672 44,115 44,115 530,686 574,801 C.O. Proceeds 51 666,552 - 665,303 (1,249) 118,355,409 119,020,712 Total Revenues 666,552 5,672 709,418 42,866 118,886,095 119,595,513 EXPENDITURES: Easements/Property Damage 4150 51 419,826 - - (419,826) 106,865 106,865 Engineering 4157 51 568,472 90,958 568,472 - 16,773,489 17,341,961 Well Field Pipelines 4152 51 3,083 - - (3,083) 3,026,918 3,026,918 30 " Transmission Main 4153 51 - - - - 38,681,022 38,681,022 Well Field Pumps 4154 51 - - - - 12,831,038 12,831,038 Well Field Pump Station 4155 51 1,344,420 - - (1,344,420) 1,617,139 1,617,139 Well Field Expansion 4158 51 - - - - 7,668,888 7,668,888 Treatment Plant 4156 51 - - - - 27,132,194 27,132,194 Well Field Expansion #2 4159 51 124,049 - - (124,049) 9,640,252 9,640,252 Issue Costs 9900 - - - - 172,251 172,251 Total Expenditures 2,459,850 90,958 568,472 (1,891,378) 117,650,056 118,218,528 Revenue Over/(Under) Expenditures (1,793,298) (85,286) 140,946 Ending Fund Balance 420,779 2,355,023 Revenues Previous Years Activity 118,886,095 Current Year Budget 666,552 Less Interest Earned (530,686) TOTAL 119,021,961 THE CITY OF SAN ANGELO, TEXAS Schedule of Revenues and Expenditures Fiscal Year through July 31, 2018 Hickory Water Supply - Fund 516 Page 18
  • 21.
    83% of Year Lapsed OriginalCurrent Month YTD YTD Over/(Under) % Dept Budget Budget Actual Total W/Enc Budget Realized Beginning Fund Balance 14,181,387 14,181,387 14,181,387 TRUST ACTIVITY REVENUES: Interest Income 206,138 206,138 28,533 186,766 186,766 (19,372) 91% Lake Lease Income 64 32,882 32,882 - - - (32,882) 0% Total Revenues 239,020 239,020 28,533 187,416 187,416 (51,604) 78% EXPENDITURES: Transfers Out 1994 64 185,524 185,524 25,679 168,090 168,090 (17,434) 91% Total Expenditures 185,524 185,524 25,679 168,090 168,090 (17,434) 91% Revenue Over/(Under) Expenditures 53,496 53,496 2,854 19,326 19,326 LAKE LOT SALES ACTIVITY REVENUES: Sale of Fixed Assets 64 700,000 700,000 26,566 427,289 427,289 (272,711) 61% Total Revenues 700,000 700,000 26,566 427,289 427,289 (272,711) 61% EXPENDITURES: Professional Serv/Selling Exp. 0320 64 50,000 50,000 2,600 11,900 12,600 (37,400) 25% Total Expenditures 50,000 50,000 2,600 11,900 12,600 (37,400) 25% Revenue Over/(Under) Expenditures 650,000 650,000 23,966 415,389 414,689 Revenue Over/(Under) Expenditures 703,496 703,496 26,820 434,715 434,015 Ending Fund Balance 14,884,883 14,884,883 14,615,402 THE CITY OF SAN ANGELO, TEXAS Schedule of Revenues and Expenditures Fiscal Year through July 31, 2018 Lake Nasworthy - Fund 640 Page 19
  • 22.
    83% of Year Lapsed OriginalCurrent Month YTD YTD Over/(Under) % Dept Budget Budget Actual Total W/Enc Budget Realized Beginning Fund Balance 10,262,151 10,262,151 10,262,151 REVENUES: Sewer Fees 27 13,013,231 13,013,231 1,243,678 11,554,123 11,554,123 (1,459,108) 89% Farm Use Revenues 203,806 203,806 1,000 226,784 226,784 22,978 111% Paving Cuts 27 20,000 20,000 9,300 57,500 57,500 37,500 288% Taps and Connections 27 20,000 20,000 4,200 19,910 19,910 (90) 100% Miscellaneous 20,000 20,000 4,612 17,662 17,662 (2,338) 88% Interest 115,396 115,396 26,259 173,838 173,838 58,442 151% Total Revenues 13,392,433 13,392,433 1,289,049 12,049,817 12,049,817 (1,342,616) 90% EXPENDITURES: Wastewater Collection 5000 1,471,970 1,500,684 106,457 908,030 940,291 (560,393) 63% Wastewater Treatment 5100&5101 2,801,877 2,941,792 198,180 1,994,025 2,171,325 (770,467) 74% Insurance 5501&5502 143,328 143,328 13,482 136,128 136,128 (7,200) 95% New Services 5401 27 25,000 25,000 - 7,576 7,576 (17,424) 30% Sewer Main Extension 5402 27 24,177 24,177 176 6,621 6,621 (17,556) 27% Capital Outlay 5400 1,529,859 6,095,771 24,087 1,899,774 4,675,978 (1,419,793) 77% Administration Services 5500 1,796,981 1,796,981 167,711 1,603,324 1,603,324 (193,657) 89% Transfers Out 5503 3,845,656 3,845,656 320,471 3,204,713 3,204,713 (640,943) 83% Total Expenditures 11,638,848 16,373,389 830,564 9,760,191 12,745,956 (3,627,433) 78% Revenue Over/(Under) Expenditures 1,753,585 (2,980,956) 458,485 2,289,626 (696,139) Ending Fund Balance 12,015,736 7,281,195 9,566,012 THE CITY OF SAN ANGELO, TEXAS Schedule of Revenues and Expenditures Fiscal Year through July 31, 2018 Water Reclamation - Fund 270 Page 20
  • 23.
    83% of Year Lapsed OriginalCurrent Month YTD YTD Over/(Under) % Dept Budget Budget Actual Total W/Enc Budget Realized Beginning Fund Balance 246,317 246,317 246,317 REVENUES: Interest - - 601 3,585 3,585 3,585 0% Transfers In 4,014,333 4,014,333 334,528 3,345,277 3,345,277 (669,056) 83% Total Revenues 4,014,333 4,014,333 335,129 3,348,862 3,348,862 (665,471) 83% EXPENDITURES: Principal on Debt 5302 27 3,186,400 3,186,400 - 3,186,400 3,186,400 - 100% Interest on Debt 5302 27 818,524 818,524 - 433,160 433,160 (385,364) 53% Issue Costs 5302 27 9,409 9,409 - (8,941) (8,941) (18,350) -95% Total Expenditures 4,014,333 4,014,333 - 3,610,619 3,610,619 (403,714) 90% Revenue Over/(Under) Expenditures - - 335,129 (261,757) (261,757) Ending Fund Balance 246,317 246,317 (15,440) THE CITY OF SAN ANGELO, TEXAS Schedule of Revenues and Expenditures Fiscal Year through July 31, 2018 Water Reclamation Debt Service - Fund 271 Page 21
  • 24.
    83% of Year Lapsed OriginalCurrent Month YTD YTD Over/(Under) % Dept Budget Budget Actual Total W/Enc Budget Realized Beginning Fund Balance 7,492,832 7,492,832 7,492,832 REVENUES: Interest Income 78,506 78,506 19,173 133,416 133,416 54,910 170% Sewer Charges 52 1,727,496 1,727,496 147,281 1,468,370 1,468,370 (259,126) 85% Transfer from Development Corp 52 - - - (733) (733) (733) 0% Total Revenues 1,806,002 1,806,002 166,454 1,601,053 1,601,053 (204,949) 89% EXPENDITURES: Property Improvement-Sewer Line Ext. 5400 1,346,093 6,744,852 - 68,822 5,350,200 (1,394,652) 79% Franchise Fee 5500 52 86,375 86,375 7,364 73,418 73,418 (12,957) 85% Transfer to Debt Service 1994 52 373,534 373,534 31,128 311,278 311,278 (62,256) 83% Total Expenditures 1,806,002 7,204,761 38,492 453,518 5,734,896 (1,469,865) 80% Revenue Over/(Under) Expenditures - (5,398,759) 127,962 1,147,535 (4,133,843) Ending Fund Balance 7,492,832 2,094,073 3,358,989 THE CITY OF SAN ANGELO, TEXAS Schedule of Revenues and Expenditures Fiscal Year through July 31, 2018 Water Reclamation Capital Projects - Fund 520 Page 22
  • 25.
    83% of Year Lapsed OriginalCurrent Month YTD YTD Over/(Under) % Dept Budget Budget Actual Total W/Enc Budget Realized Beginning Fund Balance 3,485,406 3,485,406 3,485,406 REVENUES: Surcharges 619,106 619,106 56,762 544,902 544,902 (74,204) 88% Landfill Host Fees 23 350,000 350,000 33,838 315,006 315,006 (34,994) 90% Landfill Lease 23 582,690 582,690 48,558 485,580 485,580 (97,110) 83% Farm Lease 23 19,760 19,760 - 14,413 14,413 (5,347) 73% Interest Income 39,258 39,258 7,076 50,759 50,759 11,501 129% Total Revenues 1,610,814 1,610,814 146,234 1,410,660 1,410,660 (200,154) 88% EXPENDITURES: Personnel 3700 261,999 274,572 16,026 183,032 183,032 (91,540) 67% Maintenance 3700 11,800 13,300 594 6,429 6,429 (6,871) 48% Contract Services 3700 161,726 190,226 1,918 83,890 103,352 (86,874) 54% Supplies 3700 11,820 11,820 123 3,314 3,314 (8,506) 28% Transfers 3700 255,000 255,000 21,250 212,500 212,500 (42,500) 83% Capital Projects 3700 458,469 450,932 10,975 23,842 31,010 (419,922) 7% Professional Services 3702 23 150,000 199,500 - 81,102 155,581 (43,919) 78% Total Expenditures 1,310,814 1,395,350 50,886 594,109 695,218 (700,132) 50% Revenue Over/(Under) Expenditures 300,000 215,464 95,348 816,551 715,442 Ending Fund Balance 3,785,406 3,700,870 4,200,848 THE CITY OF SAN ANGELO, TEXAS Schedule of Revenues and Expenditures Fiscal Year through July 31, 2018 Solid Waste Enterprise - Fund 230 Page 23
  • 26.
    83% of Year Lapsed OriginalCurrent Month YTD YTD Over/(Under) % Dept Budget Budget Actual Total W/Enc Budget Realized Beginning Fund Balance 3,126,616 3,126,616 3,126,616 REVENUES: Storm Water Fee 24 2,786,000 2,786,000 232,546 2,280,524 2,280,524 (505,476) 82% Miscellaneous 100,000 100,000 7 346 346 (99,654) 0% Transfers In from General 24 95,000 95,000 7,917 79,167 79,167 (15,833) 83% Interest Income 42,154 42,154 8,000 55,573 55,573 13,419 132% Total Revenues 3,023,154 3,023,154 248,470 2,415,610 2,415,610 (607,544) 80% EXPENDITURES: Personnel 5800 1,313,538 1,331,638 94,696 931,828 931,828 (399,810) 70% Maintenance 5800 491,475 568,888 9,806 278,560 363,256 (205,632) 64% Supplies 5800 116,900 117,400 16,406 67,341 67,634 (49,766) 58% Other 5800 48,100 48,100 1,829 12,339 12,339 (35,761) 26% Transfers 5800 359,239 359,239 29,961 297,741 297,741 (61,498) 83% Capital Outlay 5800 582,800 1,864,487 2,553 89,498 270,553 (1,593,934) 15% Contingencies 5800 24 111,102 55,502 - - - (55,502) 0% Total Expenditures 3,023,154 4,345,254 155,251 1,677,307 1,943,351 (2,401,903) 45% Revenue Over/(Under) Expenditures - (1,322,100) 93,219 738,303 472,259 Ending Fund Balance 3,126,616 1,804,516 3,598,875 THE CITY OF SAN ANGELO, TEXAS Schedule of Revenues and Expenditures Fiscal Year through July 31, 2018 Storm Water - Fund 240 Page 24
  • 27.
    83% of Year Lapsed OriginalCurrent Month YTD YTD Over/(Under) % Dept Budget Budget Actual Actual W/Enc Budget Realized Beginning Fund Balance 148,222 148,222 148,222 REVENUES: Leases/Rentals 1,010,758 1,010,758 81,026 887,314 887,314 (123,444) 88% Concessions 358,100 358,100 25,138 307,569 307,569 (50,531) 86% Charges for Service 22 52,682 52,682 4,784 46,467 46,467 (6,215) 88% Interest Income 1,172 1,172 379 2,752 2,752 1,580 235% Other Income 51,380 51,380 333 29,323 29,323 (22,057) 57% Total Revenues 1,474,092 1,474,092 111,660 1,273,425 1,273,425 (200,667) 86% EXPENDITURES: Personnel 3901 784,271 784,271 108,821 636,469 636,469 (147,802) 81% Administration 3901 359,209 410,749 16,304 294,244 363,857 (46,892) 89% Supplies 3901 67,383 59,197 3,788 49,542 50,310 (8,887) 85% Maintenance 3901 74,969 72,653 1,493 66,751 69,525 (3,128) 96% Utilities 3901 188,260 188,260 12,697 129,628 131,322 (56,938) 70% Total Expenditures 1,474,092 1,515,130 143,103 1,176,634 1,251,483 (263,647) 83% Revenue Over/(Under) Expenditures - (41,038) (31,443) 96,791 21,942 Ending Fund Balance 148,222 107,184 170,164 THE CITY OF SAN ANGELO, TEXAS Schedule of Revenues and Expenditures Fiscal Year through July 31, 2018 Airport Operating - Fund 220 Page 25
  • 28.
    83% of Year Lapsed OriginalCurrent Month YTD YTD Over/(Under) % Dept Budget Budget Actual Total W/Enc Budget Realized Beginning Fund Balance 1,192,865 1,192,865 1,192,865 REVENUES: Interest Income 16,086 16,086 3,052 20,643 20,643 4,557 128% PFC Revenue 52 256,500 256,500 38,120 211,807 211,807 (44,693) 83% Total Revenues 272,586 272,586 41,172 232,450 232,450 (40,136) 85% EXPENDITURES: Operations 3901 52 - 132,212 - 61,757 132,212 - 100% Transfers Out 1994 52 272,586 272,586 - - - (272,586) 0% Total Expenditures 272,586 404,798 - 61,757 132,212 (272,586) 33% Revenue Over/(Under) Expenditures - (132,212) 41,172 170,693 100,238 Ending Fund Balance 1,192,865 1,060,653 1,293,103 THE CITY OF SAN ANGELO, TEXAS Schedule of Revenues and Expenditures Fiscal Year through July 31, 2018 Airport PFC - Fund 529 Page 26
  • 29.
    83% of Year Lapsed OriginalCurrent Month YTD YTD Over/(Under) % Budget Budget Actual Total W/Enc Budget Realized Beginning Fund Balance 1,093,871 1,093,871 1,093,871 Grant 33 - 2012 Projects Revenue: FAA Grant 53 - - - - - - 0% Revenue: PFC Match 53 213,884 213,884 - - - (213,884) 0% Expenditure: Buildings 53 133,049 133,049 - - 66,080 (66,969) 50% Revenue Over/(Under) Expenditures 80,835 80,835 - - (66,080) (146,915) Grant 34 - 2016 Projects Revenue: FAA Grant 53 13,951 10,351 - - - (10,351) 0% Taxiway Reconfiguration Design 53 4,001 - - - - - 0% Revenue Over/(Under) Expenditures 9,950 10,351 - - - (10,351) Grant 35 - Taxiway Reconfiguration Revenue: FAA Grant 53 3,229,017 3,229,017 338,011 2,437,472 2,437,472 (791,545) 75% Revenue: PFC Match 53 358,779 358,779 - - - (358,779) 0% Taxiway Reconfiguration 53 3,299,701 3,299,701 317,518 2,548,618 3,299,700 (1) 100% Professional Services 53 288,095 288,095 14,844 174,528 288,095 - 100% Revenue Over/(Under) Expenditures - - 5,649 (285,674) (1,150,323) (1,150,323) Grant 36 - ARFF Truck & Pavement Plan Revenue: FAA Grant 53 603,175 603,175 (52,245) 57,812 57,812 (545,363) 10% Revenue: PFC Match 53 67,019 67,019 - - - (67,019) 0% Taxiway Reconfiguration 53 64,235 64,235 - 64,235 64,235 - 100% Professional Services 53 605,959 605,959 - - 605,959 - 100% Revenue Over/(Under) Expenditures - - (52,245) (6,423) (612,382) (612,382) Total Revenues 4,485,825 4,482,225 285,766 2,495,284 2,495,284 Less: Total Expenditures 4,395,040 4,391,039 332,362 2,787,381 4,324,069 Revenue Over/(Under) Expenditures 90,785 91,186 (46,596) (292,097) (1,828,785) Ending Fund Balance 1,184,656 1,185,057 (734,914) THE CITY OF SAN ANGELO, TEXAS Schedule of Revenues and Expenditures Fiscal Year through July 31, 2018 Airport FAA Projects - Fund 530 Page 27
  • 30.
    83% of Year Lapsed OriginalCurrent Month YTD YTD Over/(Under) % Dept Budget Budget Actual Total W/Enc Budget Realized Beginning Fund Balance 152,498 152,498 152,498 CHASE BUILDING REVENUES: Rent 1,061,000 1,061,000 82,809 840,840 840,840 (220,160) 79% EXPENDITURES: Personnel 1908 122,952 122,952 10,214 104,711 104,711 (18,241) 85% Professional Services 1908 130,772 131,522 10,412 109,957 126,957 (4,565) 97% Utilities 1908 104,548 106,048 8,867 79,883 82,831 (23,217) 78% Maintenance 1908 24,049 25,881 2,158 21,866 23,868 (2,013) 92% Rent of Land & Buildings 1908 20 188,348 188,348 15,696 156,957 156,957 (31,391) 83% Capital Improvements 1908 20 50,000 50,000 - - - (50,000) 0% Supplies 1908 2,650 2,650 180 1,384 1,384 (1,266) 52% Debt Principal & Interest 1908 51,472 51,472 - 48,062 48,062 (3,410) 93% Total Expenditures 674,791 678,873 47,527 522,820 544,770 (134,103) 80% Revenue Over/(Under) Expenditures 386,209 382,127 35,282 318,020 296,070 ANNEX BUILDING REVENUES: Rent 20 229,000 229,000 - 171,946 171,946 (57,054) 75% EXPENDITURES: Professional Services 1909 23,100 23,100 1,800 19,329 23,100 - 100% Utilities 1909 30,750 31,250 2,574 23,655 24,303 (6,947) 78% Maintenance 1909 15,680 19,680 1,436 14,797 16,592 (3,088) 84% Rent of Land & Buildings 1909 20 107,000 107,000 8,917 89,167 89,167 (17,833) 83% Debt Principal & Interest 1909 120,101 120,101 - 112,144 112,144 (7,957) 93% Total Expenditures 296,631 301,131 14,727 259,092 265,306 (35,825) 88% Revenue Over/(Under) Expenditures (67,631) (72,131) (14,727) (87,146) (93,360) Interest Income 3,998 3,998 1,627 4,018 4,018 20 101% Capital Expense 1999 20 322,576 313,994 - - 2,719 (311,275) 1% Revenue Over/(Under) Expenditures - - 22,182 234,892 204,009 Ending Fund Balance 152,498 152,498 356,507 THE CITY OF SAN ANGELO, TEXAS Schedule of Revenues and Expenditures Fiscal Year through July 31, 2018 State Office Building (Operations) - Fund 201 Page 28
  • 31.
    83% of Year Lapsed OriginalCurrent Month YTD YTD Over/(Under) % Dept Budget Budget Actual Total W/Enc Budget Realized Beginning Fund Balance 515,265 515,265 515,265 REVENUES: Advertising 20 29,000 29,000 - 17,441 17,441 (11,559) 60% Athletic Programs 20 3,700 3,700 228 1,416 1,416 (2,284) 38% Rentals 20 20,000 20,000 9,223 22,642 22,642 2,642 113% Concessions 20 10,000 10,000 2,037 6,929 6,929 (3,071) 69% Program Registration 20 98,000 98,000 3,958 67,120 67,120 (30,880) 68% General Fund Transfer 20 701,728 701,728 58,477 584,773 584,773 (116,955) 83% Hotel Occupancy Tax Transfer 20 50,000 50,000 4,167 41,666 41,666 (8,334) 83% Interest Income 5,009 5,009 1,318 9,558 9,558 4,549 191% Total Revenues 917,437 917,437 79,408 751,545 751,545 (165,892) 82% EXPENDITURES: Parks Maintenance Personnel 6019 375,477 375,477 24,763 279,717 279,717 (95,760) 74% Maintenance & Utilities 372,024 372,024 12,025 189,615 204,466 (167,558) 55% Capital 20 - 293,521 170,488 174,567 251,464 (42,057) 86% Other Operating 72,113 72,113 1,878 29,603 29,700 (42,413) 41% Total Parks Maintenance 819,614 1,113,135 209,154 673,502 765,347 (347,788) 69% Recreation Performance Personnel 6101 14,750 14,750 1,514 7,092 7,092 (7,658) 48% Operating Expenditures 83,073 83,073 3,878 31,725 31,725 (51,348) 38% Total Recreation Performance 97,823 97,823 5,392 38,817 38,817 (59,006) 40% Special Events Expenditures 6119 20 - 20,000 - - - (20,000) 0% Total Special Events - 20,000 - - - (20,000) 0% Total Expenditures 917,437 1,230,958 214,546 712,319 804,164 (406,794) 65% Revenue Over/(Under) Expenditures - (313,521) (135,138) 39,226 (52,619) Ending Fund Balance 515,265 201,744 462,646 THE CITY OF SAN ANGELO, TEXAS Schedule of Revenues and Expenditures Fiscal Year through July 31, 2018 Texas Bank Sports Complex - Fund 203 Page 29
  • 32.
    83% of Year Lapsed OriginalCurrent Month YTD YTD Over/(Under) % Dept Budget Budget Actual Total W/Enc Budget Realized Beginning Fund Balance 734,043 734,043 734,043 REVENUES: Transfer from Hotel Occupancy Tax Fund 41 891,600 1,185,600 - 1,130,149 1,130,149 (55,451) 95% EXPENDITURES: Coliseum 6601 Revenues 238,500 238,500 7,550 225,489 225,489 (13,011) 95% Expenditures 228,051 228,051 15,029 169,134 176,763 (51,288) 78% Revenue Over/(Under) Expenditures 10,449 10,449 (7,479) 56,355 48,726 38,277 Civic Events Concessions Revenues 6607 41 40,000 40,000 1,482 40,826 40,826 826 102% Revenue Over/(Under) Expenditures 40,000 40,000 1,482 40,826 40,826 826 Auditorium 6602 Revenues - - - 2,208 2,208 2,208 0% Expenditures - - - - - - 0% Revenue Over/(Under) Expenditures - - - 2,208 2,208 2,208 East Reception Room 6609 Revenues - - - 3,570 3,570 3,570 0% Expenditures - - - - - - 0% Revenue Over/(Under) Expenditures - - - 3,570 3,570 3,570 Civic Events Riverstage 6605 Revenues 22,500 22,500 750 12,363 12,363 (10,137) 55% Expenditures 30,917 30,917 1,262 13,475 13,867 (17,050) 45% Revenue Over/(Under) Expenditures (8,417) (8,417) (512) (1,112) (1,504) 6,913 Convention Center 6603 Revenues 209,750 209,750 12,543 181,239 181,239 (28,511) 86% Expenditures 161,364 174,906 10,540 102,720 109,534 (65,372) 63% Revenue Over/(Under) Expenditures 48,386 34,844 2,003 78,519 71,705 36,861 Farmers Market/Pavilion/Paseo Grounds Revenues 6606 16,200 16,200 1,538 12,066 12,066 (4,134) 74% Expenditures 18,300 25,599 256 13,221 14,364 (11,235) 56% Revenue Over/(Under) Expenditures (2,100) (9,399) 1,282 (1,155) (2,298) 7,101 Non-Departmental 6604 Payroll Expenditures 772,267 772,267 58,875 615,294 615,294 (156,973) 80% Administration 251,546 240,685 12,941 177,688 186,150 (54,535) 77% Capital & Maintenance 6699 8,333 474,908 26,196 99,594 432,994 (41,914) 91% Non-Departmental Expenditures 1,032,146 1,487,860 98,012 892,576 1,234,438 (253,422) Other/Capital/Transfers 6604 Interest 32,228 32,228 1,878 13,450 13,450 (18,778) 42% Advertising Revenue 41 20,000 20,000 - 14,075 14,075 (5,925) 70% Other Revenues 52,228 52,228 1,878 27,525 27,525 Revenue Over/(Under) Expenditures - (182,555) (99,358) 444,309 86,469 Ending Fund Balance 734,043 551,488 820,512 THE CITY OF SAN ANGELO, TEXAS Schedule of Revenues and Expenditures Fiscal Year through July 31, 2018 Civic Events - Fund 410 Page 30
  • 33.
    83% of Year Lapsed OriginalCurrent Month YTD YTD Over/(Under) % Dept Budget Budget Actual Total W/Enc Budget Realized Beginning Fund Balance 239,395 239,395 239,395 REVENUES: Rental Income 415,000 415,000 35,462 353,731 353,731 (61,269) 85% Admission Fees 42 14,000 14,000 1,112 11,843 11,843 (2,157) 85% Merchandise Sales 22,250 22,250 1,692 18,362 18,362 (3,888) 83% Special Events 128,100 128,100 3,125 87,126 87,126 (40,974) 68% Memberships 42 50,000 50,000 680 42,830 42,830 (7,170) 86% Citizens Contributions 42 5,000 5,000 1,685 4,810 4,810 (190) 96% Other Income 13,050 13,050 - 6,429 6,429 (6,621) 49% General Fund Transfer 42 356,388 356,388 29,699 296,990 296,990 (59,398) 83% Hotel Occupancy Tax Transfer 42 50,000 50,000 4,167 41,666 41,666 (8,334) 83% Interest Income 42 3,867 3,867 613 4,303 4,303 436 111% Total Revenues 1,057,655 1,057,655 78,235 868,090 868,090 (189,565) 82% EXPENDITURES: Personnel 6301 733,073 733,073 65,086 576,969 576,969 (156,104) 79% Supplies 6301 16,569 17,174 1,377 13,145 13,145 (4,029) 77% Maintenance 6301 52,622 52,622 2,677 48,623 52,476 (146) 100% Events 6302-6 62,891 62,626 901 50,352 54,581 (8,045) 87% Capital 6308 3,000 3,000 - 2,727 2,727 (273) 91% Utilities 6301 105,000 105,450 6,686 70,538 70,629 (34,821) 67% Other 6304-5 84,500 83,710 4,168 51,435 60,897 (22,813) 73% Total Expenditures 1,057,655 1,057,655 80,895 813,789 831,424 (226,231) 79% Revenue Over/(Under) Expenditures - - (2,660) 54,301 36,666 Ending Fund Balance 239,395 239,395 276,061 THE CITY OF SAN ANGELO, TEXAS Schedule of Revenues and Expenditures Fiscal Year through July 31, 2018 Fort Concho - Fund 420 Page 31
  • 34.
    83% of Year Lapsed OriginalCurrent Month YTD YTD Over/(Under) % Dept Budget Budget Actual Total W/Enc Budget Realized Beginning Fund Balance (74,582) (74,582) (74,582) REVENUES: Charges for Sales and Service 283,900 283,900 47,575 271,350 271,350 (12,550) 96% Contributions from Trust 44 50,000 50,000 3,020 37,429 37,429 (12,571) 75% General Fund Transfer 44 86,734 86,734 7,228 72,278 72,278 (14,456) 83% Interest Income 44 2,000 2,000 193 1,626 1,626 (374) 81% Service Set-up Charges 44 5,000 5,000 - 325 325 (4,675) 7% Total Revenues 427,634 427,634 58,016 383,008 383,008 (44,626) 90% EXPENDITURES: Personnel 6400 263,331 282,531 22,383 237,724 237,724 (44,807) 84% Supplies 6400 7,810 9,810 949 7,548 7,548 (2,262) 77% Maintenance 6400 33,757 30,757 1,592 21,588 21,679 (9,078) 70% Utilities 6400 52,951 33,751 1,334 14,959 15,048 (18,703) 45% Other 6400 57,785 58,785 5,293 42,231 44,781 (14,004) 76% Columbarium 6400 44 - 37,983 - - - (37,983) 0% Total Expenditures 415,634 453,617 31,551 324,050 326,780 (126,837) 72% Revenue Over/(Under) Expenditures 12,000 (25,983) 26,465 58,958 56,228 Ending Fund Balance (62,582) (100,565) (18,354) THE CITY OF SAN ANGELO, TEXAS Schedule of Revenues and Expenditures Fiscal Year through July 31, 2018 Fairmount Cemetery - Fund 440 Page 32
  • 35.
    83% of Year Lapsed OriginalCurrent Month YTD YTD Over/(Under) % Dept Budget Budget Actual Total W/Enc Budget Realized Beginning Fund Balance 587,650 587,650 587,650 Transportation Revenues 103 205,528 592,488 - 125,809 125,809 (466,679) 21% Expenditures 2100 205,528 556,782 19,826 186,748 186,748 (370,034) 34% Revenue Over/(Under) Expenditures - 35,706 (19,826) (60,939) (60,939) MLK TEP Project Revenues 103 - 1,040,283 58,950 717,008 717,008 (323,275) 69% Expenditures 3200 103 - 1,040,283 - - - (1,040,283) 0% Revenue Over/(Under) Expenditures - - 58,950 717,008 717,008 Parks Improvements Revenues 103 - 353,250 - - - (353,250) 0% Expenditures 6000 103 - 353,250 - - - (353,250) 0% Revenue Over/(Under) Expenditures 103 - - - - - NOAA Rainwater Capture Grant Revenues 103 - - - - - - 0% Expenditures 6003 103 - 1,218 - - 1,218 - 100% Revenue Over/(Under) Expenditures - (1,218) - - (1,218) Nutrition Revenues 271,264 271,264 21,588 204,357 204,357 (66,907) 75% Expenditures 6700 271,264 271,264 21,532 196,552 205,539 (65,725) 76% Revenue Over/(Under) Expenditures - - 56 7,805 (1,182) Nursing Revenues 139,474 139,474 11,308 115,797 115,797 (23,677) 83% Expenditures 7001 139,474 139,474 12,688 94,775 95,617 (43,857) 69% Revenue Over/(Under) Expenditures - - (1,380) 21,022 20,180 EHS & RLHO Grant Revenues 199,433 199,433 11,814 160,476 160,476 (38,957) 80% Expenditures 7201 & 7202 199,433 305,677 18,103 139,840 140,052 (165,625) 46% Revenue Over/(Under) Expenditures - (106,244) (6,289) 20,636 20,424 PHEP Revenues 101,682 101,682 3,053 58,676 58,676 (43,006) 58% Expenditures 7203 101,682 101,682 4,830 69,847 69,847 (31,835) 69% Revenue Over/(Under) Expenditures - - (1,777) (11,171) (11,171) PHEP - Local Match Revenues 103 10,030 10,030 836 8,358 8,358 (1,672) 83% Expenditures 7204 10,030 10,030 836 8,358 8,358 (1,672) 83% Revenue Over/(Under) Expenditures - - - - - Texas Healthy Communities Revenues 103 50,000 50,000 - 8,936 8,936 (41,064) 18% Expenditures 7600 50,000 50,000 1,114 44,256 44,256 (5,744) 89% Revenue Over/(Under) Expenditures - - (1,114) (35,320) (35,320) THE CITY OF SAN ANGELO, TEXAS Schedule of Revenues and Expenditures Fiscal Year through July 31, 2018 Intergovernmental - Fund 103 Page 33
  • 36.
    83% of Year Lapsed OriginalCurrent Month YTD YTD Over/(Under) % Dept Budget Budget Actual Total W/Enc Budget Realized Beginning Fund Balance 587,650 587,650 587,650 THE CITY OF SAN ANGELO, TEXAS Schedule of Revenues and Expenditures Fiscal Year through July 31, 2018 Intergovernmental - Fund 103 Women Infant & Children Grant Revenues 103 854,620 848,998 109,892 499,853 499,853 (349,145) 59% Expenditures 7700 854,620 848,998 68,755 665,718 669,140 (179,858) 79% Revenue Over/(Under) Expenditures - - 41,137 (165,865) (169,287) 1115 Waiver Revenues 137,500 137,500 (27,372) 167,072 167,072 29,572 122% Expenditures 7808 137,500 484,009 7,318 73,538 81,037 (402,972) 17% Revenue Over/(Under) Expenditures - (346,509) (34,690) 93,534 86,035 Social Services Revenues 126,170 126,170 8,014 100,975 100,975 (25,195) 80% Expenditures 7900 126,170 126,472 11,723 98,260 99,185 (27,287) 78% Revenue Over/(Under) Expenditures - (302) (3,709) 2,715 1,790 2017 State Justice Assist Grant Revenues 103 - 26,500 - 26,500 26,500 - 100% Expenditures 8725 103 - 26,500 - 26,500 26,500 - 100% Revenue Over/(Under) Expenditures - - - - - 2018 State Justice Assist Grant Revenues 103 - 98,938 98,938 98,938 98,938 - 100% Expenditures 8726 103 - 98,938 - 98,938 98,938 - 100% Revenue Over/(Under) Expenditures - - 98,938 - - Emergency Management Revenues 280,966 280,966 90,138 164,828 164,828 (116,138) 59% Expenditures 9200 280,966 280,966 9,239 152,619 157,565 (123,401) 56% Revenue Over/(Under) Expenditures - - 80,899 12,209 7,263 Miscellaneous Interest 103 - - 1,504 4,229 4,229 4,229 0% Revenue Over/(Under) Expenditures - (418,567) 212,699 614,683 586,632 Ending Fund Balance 587,650 169,083 1,174,282 Page 34
  • 37.
    83% of Year Lapsed OriginalCurrent Month YTD YTD Over/(Under) % Dept Budget Budget Actual Total W/Enc Budget Realized Beginning Fund Balance 137,111 137,111 137,111 REVENUES: HUD-CDBG 45 110,335 110,335 - 6,649 6,649 (103,686) 6% Rehab Loans 45 78,071 77,798 110 560 560 (77,238) 1% Total Revenues 188,406 188,133 110 7,209 7,209 (180,924) 4% EXPENDITURES: Administration 2610 45 23,920 14,854 - - - (14,854) 0% Public Services: Rehab Grants and Loans 2621 9,428 9,030 - 1,986 1,986 (7,044) 22% Public Works: Health Dept - Code Enforcement 2630 45 12,616 10,744 - 10,514 10,514 (230) 98% Service Line Warranties 2660 45 10,645 6,987 - 525 525 (6,462) 8% Total Expenditures 56,609 41,615 - 13,025 13,025 (28,590) 31% Revenue Over/(Under) Expenditures 131,797 146,518 110 (5,816) (5,816) Ending Fund Balance 268,908 283,629 131,295 THE CITY OF SAN ANGELO, TEXAS Schedule of Revenues and Expenditures Fiscal Year through July 31, 2018 Community Development Block Grant - Prior Year - Fund 452 Page 35
  • 38.
    83% of Year Lapsed OriginalCurrent Month YTD YTD Over/(Under) % Dept Budget Budget Actual Total W/Enc Budget Realized Beginning Fund Balance - - - REVENUES: HUD-CDBG 45 688,898 688,898 - 275,284 275,284 (413,614) 40% Rehab Loans 45 32,000 32,000 191 1,923 1,923 (30,077) 6% Recaptured Funds 45 - - - 15,656 15,656 15,656 0% Total Revenues 720,898 720,898 191 292,863 292,863 (428,035) 41% EXPENDITURES: Administration 2610 142,341 142,341 11,421 99,361 99,383 (42,958) 70% Debt Service 2617 45 146,048 146,048 126,524 146,047 146,047 (1) 100% Rehab Administration 2620 126,659 126,659 10,465 99,976 100,098 (26,561) 79% Rehab Grants and Loans 2621 267,850 267,850 47,727 211,041 225,793 (42,057) 84% Health Dept Code Enforcement 2630 45 38,000 38,000 4,433 37,235 37,235 (765) 98% Total Expenditures 720,898 720,898 200,570 593,660 608,556 (112,342) 84% Revenue Over/(Under) Expenditures - - (200,379) (300,797) (315,693) Ending Fund Balance - - (315,693) THE CITY OF SAN ANGELO, TEXAS Schedule of Revenues and Expenditures Fiscal Year through July 31, 2018 Community Development Block Grant - Current Year - Fund 453 Page 36
  • 39.
    83% of Year Lapsed OriginalCurrent Month YTD YTD Over/(Under) % Dept Budget Budget Actual Total W/Enc Budget Realized Beginning Fund Balance 279,766 279,766 279,766 REVENUES: Grants 48 118,460 118,460 - 36,386 36,386 (82,074) 31% Misc Revenue 48 27,888 27,888 - - - (27,888) 0% Revit Loan Payments 48 110,193 109,937 40 230 230 (109,707) 0% Total Revenues 256,541 256,285 40 36,616 36,616 (219,669) 14% EXPENDITURES: Administration 2410 59,872 - - - - - 0% Contribution - MHMR 2440 48 7,245 7,245 707 3,818 7,245 - 100% Homebuyers Assistance Program 2440 48 25,450 25,450 - 25,450 25,450 - 100% Neighborhood Revitalization 2440 63,687 122,826 6,095 32,908 62,455 (60,371) 51% CHS Revitalization 2460 57,875 57,875 136 13,228 13,703 (44,172) 24% Total Expenditures 214,129 213,396 6,938 75,404 108,853 (104,543) 51% Revenue Over/(Under) Expenditures 42,412 42,889 (6,898) (38,788) (72,237) Ending Fund Balance 322,178 322,655 207,529 THE CITY OF SAN ANGELO, TEXAS Schedule of Revenues and Expenditures Fiscal Year through July 31, 2018 HOME Prior Year - Fund 482 Page 37
  • 40.
    83% of Year Lapsed OriginalCurrent Month YTD YTD Over/(Under) % Dept Budget Budget Actual Total W/Enc Budget Realized Beginning Fund Balance - - - REVENUES: Grants 48 254,111 249,197 - 135,470 135,470 (113,727) 54% Recaptured Funds 48 - - - 11,002 11,002 11,002 0% Sale of Assets 48 38,412 38,412 3,201 32,006 32,006 (6,406) 83% Miscellaneous 48 30,315 30,135 - 15,068 15,068 (15,067) 50% Revit Loan Payments 48 24,000 24,000 223 2,179 2,179 (21,821) 9% Total Revenues 346,838 341,744 3,424 195,725 195,725 (146,019) 57% EXPENDITURES: Administration 2410 96,730 95,867 2,824 25,959 25,959 (69,908) 27% Contribution - MHMR 2440 48 51,000 1,545 151 815 1,545 - 100% Homebuyers Assistance Program 2440 48 111,108 144,882 22,299 57,772 57,772 (87,110) 40% Galilee CDC 2420 48 88,000 99,450 - 99,450 99,450 - 100% Total Expenditures 346,838 341,744 25,274 183,996 184,726 (157,018) 54% Revenue Over/(Under) Expenditures - - (21,850) 11,729 10,999 Ending Fund Balance - - 10,999 THE CITY OF SAN ANGELO, TEXAS Schedule of Revenues and Expenses Fiscal Year through July 31, 2018 HOME Current Year - Fund 483 Page 38
  • 41.
    Carryover Current CurrentExpense Current Account Revenue Year Expense Year Budget Account Beginning Fund Balance Dept Balance Budget Contributions Budget Expense Balance Balance City Council - Entrance Esplanade 0100 9,647 - - 60 9,647 - 9,647 9,647 Visitor Center - Sculpture 0102 13,720 - - 60 13,719 - 13,719 13,720 Visitor Center - Memorial 0103 20 - - 60 22 - 22 20 Planning and Zoning 2000 225 - - 60 225 - 225 225 Keep San Angelo Beautiful 2010 60 986 - - 60 986 - 986 986 Water Conservation 4002 500 - - 60 500 - 500 500 Parks - Botanical and Agriculture 6000 60 12,025 3,000 775 60 12,024 217 11,807 12,583 Parks - Park Improvement 6003 60 5,000 25,000 25,000 60 30,000 23,697 6,303 6,303 Parks - Park Commission 6004 304 - - 60 303 - 303 304 Parks - Dog Park 6005 60 637 - - 60 636 636 - 1 Dr. Smith Memorial 6006 218 - - 60 218 218 - - Parks - Kids Kingdom Maintenance 6013 25 - - 60 25 25 - 0 Parks - Unidad Park Maintenance 6014 60 2,522 - - 60 2,521 - 2,521 2,522 Parks - Water Customer Donations 6025 60 4,941 - 492 60 4,940 - 4,940 5,433 Nature Center 6100 60 3,974 - 157 60 4,001 - 4,001 4,131 Recreation - Special Events 6100 60 35 - - 60 7 - 7 35 Recreation - Athletic Programs 6100 60 7,366 500 2,900 60 7,866 480 7,386 9,786 Recreation - Summer Meals 6105 9 - - 60 9 - 9 9 Recreation - Swimming Pool 6125 60 628 - 492 60 627 - 627 1,120 Recreation - Public Arts Commision 6140 60 266 - - 60 265 - 265 266 River Fest 6150 60 22,774 30,000 11,079 60 60,719 7,902 52,817 25,951 Auditorium Improvement 6602 60 - 25,466 53,208 60 25,466 - 25,466 53,208 Nutrition 67xx 1,361 - - 60 1,360 - 1,360 1,361 Animal Control 7803 60 7,046 - 748 60 7,045 3,327 3,718 4,467 Animal Control - Spay and Neuter 7805 60 8,959 - 10,556 60 12,703 11,595 1,108 7,920 Police Adminstration 8000 27 - - 60 27 - 27 27 Police - Gun Range 8001 60 - - 1,738 - - - 1,738 Canine Donations 8002 60 2,930 500 661 60 3,014 - 3,014 3,591 H.E.A.T. 8005 149 - - 60 149 - 149 149 Miscellaneous Police Donations 8007 60 804 500 615 60 803 - 803 1,419 Safety City 8008 60 1,264 - - 60 1,264 - 1,264 1,264 Police Memorial 8010 60 4,065 2,500 - 60 4,065 - 4,065 4,065 Police Week 8012 60 - 2,500 - 60 - - - - Police Pistol Team 8013 60 26 250 - 60 25 - 25 26 DREAM 8400 60 1,397 1,000 1,598 60 1,396 1,396 - 1,599 Fire Department Donations 9010 60 4,273 - - 60 4,272 - 4,272 4,273 Contingencies 0000 - - - 60 11,314 - 11,314 - Interest on Investments 0000 60 816 2,440 2,572 60 2,440 - 2,440 3,388 TOTAL 118,938 93,656 112,591 224,603 49,493 175,110 182,036 THE CITY OF SAN ANGELO, TEXAS Schedule of Revenues and Expenses Fiscal Year through July 31, 2018 Designated Revenue - Fund 601 Page 39
  • 42.
    83% of Year Lapsed OriginalCurrent Month YTD YTD Over/(Under) % Dept Budget Budget Actual Total W/Enc Budget Realized Beginning Fund Balance 1,497,523 1,497,523 1,497,523 Hotel Occupancy Tax REVENUES: Hotel Occupancy Tax 60 1,857,500 1,857,500 358,685 2,100,662 2,100,662 243,162 113% Interest 60 27,394 27,394 3,832 26,140 26,140 (1,254) 95% Total Revenues 1,884,894 1,884,894 362,517 2,126,802 2,126,802 241,908 113% EXPENDITURES: San Angelo Performing Arts Council 60 50,000 50,000 - 50,000 50,000 - 100% San Angelo Chamber of Commerce 60 865,000 865,000 72,083 720,833 720,833 (144,167) 83% San Angelo Cultural Affairs Council 60 92,875 92,875 12,418 86,866 86,866 (6,009) 94% Downtown San Angelo 60 37,500 37,500 - 18,750 37,500 - 100% Fort Concho 60 50,000 50,000 4,167 41,666 41,666 (8,334) 83% Civic Events 60 891,600 1,185,600 - 1,130,149 1,130,149 (55,451) 95% Texas Bank Sports Complex 60 50,000 50,000 4,167 41,666 41,666 (8,334) 83% Total Expenditures 2,036,975 2,330,975 92,835 2,089,930 2,108,680 (222,295) 90% Revenue Over/(Under) Expenditures (152,081) (446,081) 269,682 36,872 18,122 Ending Fund Balance 1,345,442 1,051,442 1,515,645 THE CITY OF SAN ANGELO, TEXAS Schedule of Revenues and Expenditures Fiscal Year through July 31, 2018 Hotel Occupancy Tax - Fund 605 Page 40
  • 43.
    83% of Year Lapsed OriginalCurrent Month YTD YTD Over/(Under) % Dept Budget Budget Actual Total W/Enc Budget Realized Beginning Fund Balance 572,031 572,031 572,031 REVENUES: Gas and Oil 2,755,865 2,755,865 216,731 1,010,795 1,010,795 (1,745,070) 37% Gas and Oil - Schools 30 1,365,289 1,365,289 17,783 517,143 517,143 (848,146) 38% Materials 1,315,321 1,315,321 757 1,318,456 1,318,456 3,135 100% Labor Charges 30 1,371,275 1,371,275 9 600,551 600,551 (770,724) 44% Fuel Tax Refund 30 16,668 16,668 1,379 12,233 12,233 (4,435) 73% Other Income 15,491 15,491 - 980 980 (14,511) 6% Rent 30 120,000 120,000 - 120,000 120,000 - 100% Interest Income - - 1,464 6,295 6,295 6,295 0% Total Revenues 6,959,909 6,959,909 238,123 3,586,453 3,586,453 (3,373,456) 52% EXPENDITURES: Personnel 1800 940,725 940,725 78,394 737,160 737,160 (203,565) 78% Gas and Oil 1800 4,128,653 4,128,653 116,968 1,451,844 2,834,858 (1,293,795) 69% Parts Contract 1800 30 160,000 160,000 - 92,887 156,000 (4,000) 98% Materials 1800 30 1,315,321 1,315,321 167,600 962,819 1,204,887 (110,434) 92% Utilities 1800 39,400 39,400 1,983 26,968 27,674 (11,726) 70% Maintenance 1800 53,093 51,093 596 33,292 34,446 (16,647) 67% Other 1800 217,507 225,710 15,744 153,845 200,047 (25,663) 89% Capital Outlay 1803 1899 54,093 47,890 3,139 39,369 39,369 (8,521) 82% Total Expenditures 6,908,792 6,908,792 384,424 3,498,184 5,234,441 (1,674,351) 76% Revenue Over/(Under) Expenditures 51,117 51,117 (146,301) 88,269 (1,647,988) Ending Fund Balance 623,148 623,148 (1,075,957) THE CITY OF SAN ANGELO, TEXAS Schedule of Revenues and Expenditures Fiscal Year through July 31, 2018 Fleet Services - Fund 301 Page 41
  • 44.
    83% of Year Lapsed OriginalCurrent Month YTD YTD Over/(Under) % Dept Budget Budget Actual Total W/Enc Budget Realized Beginning Fund Balance 184,949 184,949 184,949 REVENUES: Charges for Services 750,431 750,431 78,086 617,533 617,533 (132,898) 82% Total Revenues 750,431 750,431 78,086 617,533 617,533 (132,898) 82% EXPENDITURES: Radio Personnel 1110 86,989 86,989 6,386 56,853 56,853 (30,136) 65% Utilities 1110 7,050 7,050 489 4,994 4,994 (2,056) 71% Maintenance 1110 17,930 17,930 - 16,074 16,102 (1,828) 90% Other Operating 1110 46,975 46,975 1,678 18,586 28,206 (18,769) 60% Voice Over IP Personnel 1115 55,719 55,719 3,256 50,552 50,552 (5,167) 91% Contract Services 1115 30 47,000 47,000 - 35,549 35,549 (11,451) 76% Other Operating 1115 113,824 100,624 22,836 74,952 74,952 (25,672) 74% Technology Capital 1115 30 84,323 103,952 - 39,859 87,220 (16,732) 84% Cell Phones 1117 241,222 241,222 18,616 174,832 174,832 (66,390) 72% Telephone Landlines 1116 49,399 62,599 (14,895) 53,282 53,282 (9,317) 85% Total Expenditures 750,431 770,060 38,366 525,533 582,542 (187,518) 76% Revenue Over/(Under) Expenditures - (19,629) 39,720 92,000 34,991 Ending Fund Balance 184,949 165,320 219,940 THE CITY OF SAN ANGELO, TEXAS Schedule of Revenues and Expenditures Fiscal Year through July 31, 2018 Communications - Fund 305 Page 42
  • 45.
    83% of Year Lapsed OriginalCurrent Month YTD YTD Over/(Under) % Dept Budget Budget Actual Total W/Enc Budget Realized Beginning Fund Balance (19,109) (19,109) (19,109) CLINIC OPERATIONS REVENUES: Reimbursed Expenditures 1606 31 101,200 101,200 - 68,895 68,895 (32,305) 68% Total Revenues 101,200 101,200 - 68,895 68,895 (32,305) 68% EXPENDITURES: Operating Costs 1606 345,706 345,706 28,918 261,850 313,071 (32,635) 91% Total Expenditures 345,706 345,706 28,918 261,850 313,071 (32,635) 91% Revenue Over/(Under) Expenditures (244,506) (244,506) (28,918) (192,955) (244,176) (64,940) 100% GROUP MEDICAL REVENUES: Stop Loss Reimbursement 1620 310,000 310,000 18,875 124,895 124,895 (185,105) 40% City Contribution - Emp Premiums 1620 31 4,657,572 4,657,572 390,966 3,181,801 3,181,801 (1,475,771) 68% City Contribution - Retiree Premiums 1620 31 1,466,814 1,466,814 151,648 1,444,216 1,444,216 (22,598) 98% Employee/Dependent Premiums 1620 31 1,469,338 1,469,338 163,384 1,819,569 1,819,569 350,231 124% Retiree/Dependent/Other Premiums 1620 31 773,721 773,721 70,652 625,977 625,977 (147,744) 81% Total Revenues 8,677,445 8,677,445 795,525 7,196,458 7,196,458 (1,480,987) 83% EXPENDITURES: Personnel Costs 1620 122,165 132,738 13,938 117,871 117,871 (14,867) 89% Professional Services 1620 31 48,000 48,000 - 36,000 36,000 (12,000) 75% COBRA Administration 1620 31 17,250 17,250 2,205 13,125 15,509 (1,741) 90% Insurance Premiums 1620 31 96,000 96,000 2,195 17,520 21,813 (74,187) 23% Insurance Stop Loss 1620 31 1,000,000 1,000,000 65,720 583,595 583,595 (416,405) 58% Health Plan Claims 1620 31 6,624,730 6,614,157 556,170 5,396,021 5,396,021 (1,218,136) 82% Other Operating 1620 6,390 6,390 - 2,463 2,463 (3,927) 39% Administration Fee 1620 31 518,404 518,404 41,299 370,729 370,729 (147,675) 72% Total Expenditures 8,432,939 8,432,939 681,527 6,537,324 6,544,001 (1,888,938) 78% Revenue Over/(Under) Expenditures 244,506 244,506 113,998 659,134 652,457 Revenue Over/(Under) Expenditures - - 85,080 466,179 408,281 Ending Fund Balance (19,109) (19,109) 466,179 389,172 THE CITY OF SAN ANGELO, TEXAS Schedule of Revenues and Expenditures Fiscal Year through July 31, 2018 Employee Self-Insurance - Fund 310 Page 43
  • 46.
    83% of Year Lapsed OriginalCurrent Month YTD YTD Over/(Under) % Dept Budget Budget Actual Total W/Enc Budget Realized Beginning Fund Balance 741,977 741,977 741,977 REVENUES: Premium Contributions 32 523,154 523,154 37,870 378,700 378,700 (144,454) 72% Insurance Recovery 297,686 761,414 4,701 422,905 422,905 (338,509) 56% Interest Income 28,672 28,672 1,899 14,993 14,993 (13,679) 52% Total Revenues 849,512 1,313,240 44,470 816,598 816,598 (496,642) 62% EXPENDITURES: Prior Years Indemnity 1603 32 100,000 350,000 - 263,364 278,333 (71,667) 80% Self-Insured Losses 1603 32 123,846 123,846 4,190 7,706 7,706 (116,140) 6% Insurance Premiums 1603 126,699 126,699 (7,779) 82,233 82,233 (44,466) 65% Expected Claims Liability 1603 32 133,141 133,141 12,289 96,549 96,549 (36,592) 73% Claims Expense 1603 - 479,511 9,420 113,247 113,247 (366,264) 24% Administrative Services 1603 365,826 365,826 16,857 154,336 154,336 (211,490) 42% Total Expenditures 849,512 1,579,023 34,977 717,435 732,404 (846,619) 46% Revenue Over/(Under) Expenditures - (265,783) 9,493 99,163 84,194 Ending Fund Balance 741,977 476,194 826,171 THE CITY OF SAN ANGELO, TEXAS Schedule of Revenues and Expenditures Fiscal Year through July 31, 2018 Property and Casualty Insurance - Fund 320 Page 44
  • 47.
    83% of Year Lapsed OriginalCurrent Month YTD YTD Over/(Under) % Dept Budget Budget Actual Total W/Enc Budget Realized Beginning Fund Balance (856,170) (856,170) (856,170) REVENUES: Premium Contributions 33 1,350,667 1,350,667 113,547 1,137,305 1,137,305 (213,362) 84% Insurance Recovery 33 34,465 34,465 - - - (34,465) 0% Reimbursed Expenses 33 - - 75 320 320 320 0% Interest Income - - - 1,098 1,098 1,098 0% Total Revenues 1,385,132 1,385,132 113,622 1,138,723 1,138,723 (246,409) 82% EXPENDITURES: Risk Administration 1601 298,649 305,649 15,508 183,397 183,397 (122,252) 60% Prior Years' Indemnity 1604 33 10,000 6,500 - - - (6,500) 0% Prior Years' Medical 1604 33 10,000 6,500 - - - (6,500) 0% Current Year Indemnity 1604 33 131,383 131,383 1,675 58,147 58,490 (72,893) 45% Current Medical 1604 482,481 482,481 11,289 201,920 201,920 (280,561) 42% Claims Administration 1604 20,000 20,000 2,761 7,042 7,322 (12,678) 37% Total Expenditures 952,513 952,513 31,233 450,506 451,129 (501,384) 47% Revenue Over/(Under) Expenditures 432,619 432,619 82,389 688,217 687,594 Ending Fund Balance (423,551) (423,551) (168,576) THE CITY OF SAN ANGELO, TEXAS Schedule of Revenues and Expenditures Fiscal Year through July 31, 2018 Workers' Compensation - Fund 330 Page 45
  • 48.
    83% of Year Lapsed OriginalCurrent Month YTD Over/(Under) % Budget Budget Actual Total Budget Realized REVENUES: Income-Sales & Use Tax # 2,198,000 2,380,000 216,680 2,154,020 (225,980) 91% Interest on Investments # 23,000 23,000 28,339 169,612 146,612 737% Lease Income 85,250 74,965 13,093 59,935 (15,030) 80% Misc. Income # - - - 200 200 0% Gain on Sale of Assets # 250,000 250,000 - - (250,000) 0% Total Revenues 2,556,250 2,727,965 258,112 2,383,767 (344,198) 87% EXPENDITURES: Administrative # 137,274 161,474 14,540 71,437 (90,037) 44% Partner Affiliations 76,197 76,197 (16) 73,409 (2,788) 96% City Services # 433,566 433,566 - - (433,566) 0% Annual Report # 1,200 1,200 - 240 (960) 20% Industrial Park Ops & Maint 30,650 30,650 350 4,159 (26,491) 14% Outside Legal Services # 25,000 25,000 - 125 (24,875) 1% Marketing-Chamber of Commerce # 225,000 225,000 18,750 155,951 (69,049) 69% Business Ret & Exp Program # 696,000 324,765 9,734 12,515 (312,250) 4% Promotion (SADC Marketing) # 10,300 10,300 - 1,811 (8,489) 18% Business Resource Center 35,281 35,281 1,746 23,208 (12,073) 66% Business Factory # 93,873 94,373 2,019 51,285 (43,088) 54% Projects Martifer-Hirschfeld # 1,390,435 1,390,435 - - (1,390,435) 0% Blue Cross Blue Shield # 111,355 111,355 37,118 37,118 (74,237) 33% Air Service Marketing # - 60,000 5,000 39,045 (20,955) 65% MedHab # 796,250 796,250 - - (796,250) 0% DeCoty Coffee # 96,902 96,902 - 15,168 (81,734) 16% Time Clock Plus # 10,500 - - - - 0% TGC/GAFB # 633,000 633,000 - 624,601 (8,399) 99% Phase I Sewer Extension # 39,560 - - - - 0% Principle LED # 194,005 194,005 - 85,000 (109,005) 44% Phase II Sewer Line # 96,000 96,000 - - (96,000) 0% TXDOT Aside Program Grant # 100,000 100,000 - 39,500 (60,500) 40% CalTech # 583,999 583,999 - 1,100 (582,899) 0% Parkhill # - 280,000 5,836 191,624 (88,376) 68% Grant Works # 4,000 54,000 - 4,000 (50,000) 7% Houston Harte 45 3,000 103,000 - 46,643 (56,357) 45% Netco 45 190,000 60,000 - 50,000 (10,000) 83% Elite Solutions 45 - 40,260 - - (40,260) 0% GAFB 45 - 1,500,000 - - (1,500,000) 0% Industrial Park Phase II 45 - 2,000,000 - - (2,000,000) 0% Sunken Garden Design 45 - 75,000 - - (75,000) 0% Howard College Construction 45 - 168,000 - 39,970 (128,030) 24% Engine Pro Machine 45 - 5,975 - - (5,975) 0% Airport Hangar Repair 45 - 25,000 - - (25,000) 0% Future Projects 45 736,603 647,763 - - (647,763) 0% Capital Purchases # 31,612 31,612 - - (31,612) 0% Total Expenditures 6,781,562 10,470,362 95,077 1,567,909 (8,902,453) 15% Revenue Over/(Under) Expenditures (4,225,312) (7,742,397) 163,035 815,858 8,558,255 THE CITY OF SAN ANGELO, TEXAS Schedule of Revenues and Expenditures Fiscal Year through July 31, 2018 San Angelo Development Corporation - Economic Development Page 46
  • 49.
    83% of Year Lapsed OriginalCurrent Month YTD Over/(Under) % Budget Budget Actual Total Budget Realized REVENUES: Income-Sales & Use Tax # 5,652,000 6,120,000 557,178 5,538,912 (581,088) 91% Interest on Investments # 4,000 4,000 13,771 52,882 48,882 1322% Total Revenues 5,656,000 6,124,000 570,949 5,591,794 (532,206) 91% EXPENDITURES: Administrative 41 3,500 3,500 - 2,467 (1,033) 70% City Services # 144,522 144,522 - - (144,522) 0% Loan/Debt Service # 4,744,285 5,126,270 - - (5,126,270) 0% Projects Sports Facilities Maintenance # 291,061 285,353 - 285,353 - 100% Affordable Housing # 357,674 357,674 47,533 286,333 (71,341) 80% West Texas Water Partnership # 12,480 200,000 1,523 30,129 (169,871) 15% Red Arroyo SW Basin # 38,470 - - - - 0% Future Projects # 137,632 80,305 - - (80,305) 0% Total Expenditures 5,729,624 6,197,624 49,056 604,282 (5,593,342) 10% Revenue Over/(Under) Expenditures (73,624) (73,624) 521,893 4,987,512 5,061,136 THE CITY OF SAN ANGELO, TEXAS Schedule of Revenues and Expenditures Fiscal Year through July 31, 2018 San Angelo Development Corporation - Ballot Page 47