Download as PDF, PPTX


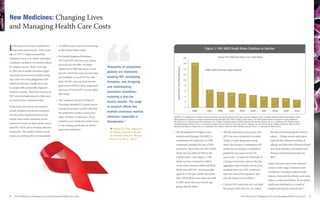


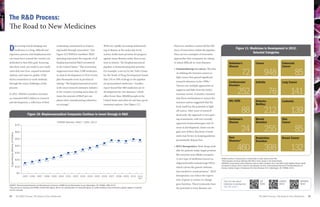


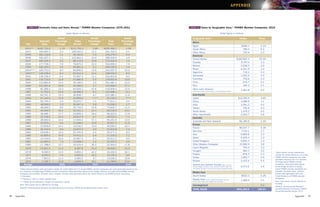

The 2012 Pharmaceutical Industry Profile highlights the significant roles of biopharmaceutical companies in advancing healthcare outcomes and the economy, emphasizing that drug development is a lengthy, costly process facing challenges primarily due to rising costs and regulatory demands. It reports that from 2001 to 2011, 3,406 medicines were approved, yet only about 20% of marketed drugs recoup their R&D costs, which rose to an estimated $1.2 billion by the early 2000s. The document also notes substantial investments in R&D, with $49.5 billion spent in 2011, reflecting the industry's commitment to innovation despite a competitive landscape heavily influenced by generic medications.


![ONFH[AVN HIP] -TRIPLE REGIME -A NOVAL SURGICAL CONCEPT .pptx](https://cdn.slidesharecdn.com/ss_thumbnails/onfhavnhip2026koaconcalicutdrgokuldevdrmashraf-260210064517-213ec005-thumbnail.jpg?width=640&height=640&fit=bounds)


