Download as PDF, PPTX
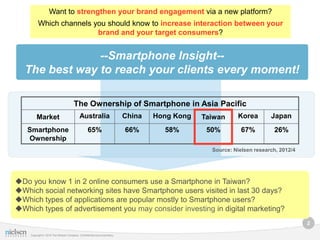
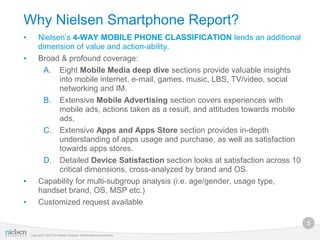
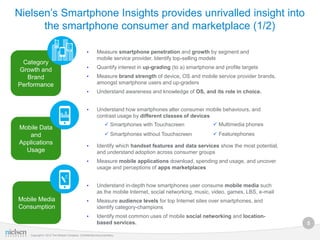
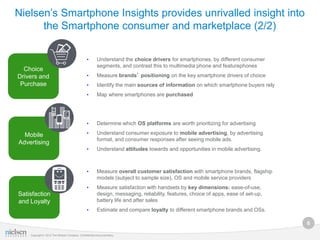
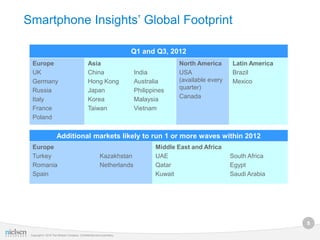
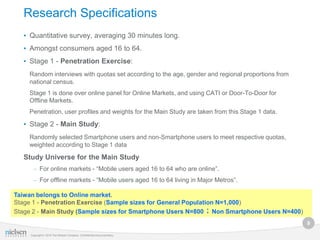
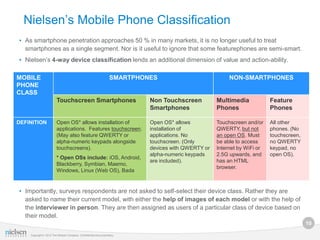

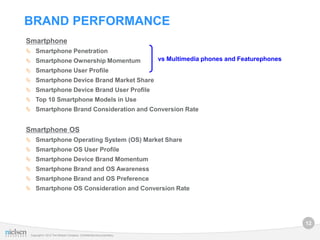

The document provides an overview of Nielsen's 2012 Taiwan smartphone report. Some key findings include: - Over 50% of Taiwanese own smartphones, with brands like Samsung and Apple popular. - Social media and games are most commonly used smartphone apps. - Mobile internet and video are frequently accessed on smartphones in Taiwan. - Taiwanese smartphone users are receptive to mobile advertising but prefer certain ad formats. The report will analyze smartphone usage trends, app and media consumption, brand performance, and consumer attitudes in Taiwan using Nielsen's research methodology and 4-way mobile phone classification system. It aims to provide insights for manufacturers, carriers, developers and marketers.


