2023 Global Report on Food Crises: Joint Analysis for Better Decisions
2012 Global Hunger Index
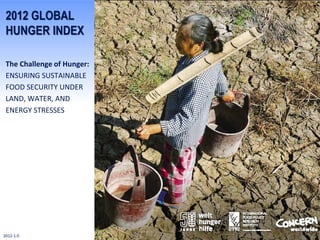
1. 2012 GLOBAL
HUNGER INDEX
The Challenge of Hunger:
ENSURING SUSTAINABLE
FOOD SECURITY UNDER
LAND, WATER, AND
ENERGY STRESSES
2012-1.0
2. Why a Global Hunger Index?
• To raise awareness of regional and country differences
in hunger
• To show progress over time
• To help learn from successes and failures in hunger
reduction
• To provide incentives to act and improve the
international ranking
• To focus on one major hunger-related topic every year
3. • Ranking is a powerful tool
• Other sectors use it
successfully too
• It gets public and professional
attention
• It can spur competition
• A special subject can be
highlighted
4. GHI measures three dimensions of hunger
• Undernourishment
• Child underweight
• Child mortality
Proportion of Prevalence of
Mortality rate of
+ +
the population underweight in
that is children under
children under
undernourished age five (in %)
GHI age five (in %)
(in %)
score =
3
5. Countries ranked on a 100 point scale
Minimum and maximum values not observed in practice
6. Summary: Background Facts and Key Findings (1)
• The 2012 Global Hunger Index (GHI) is calculated for 120
developing countries and countries in transition for which data
on the three indicators of hunger are available.
• This year’s GHI reflects data from 2005-2010—the most recent
country-level data available on the three GHI measures. It is thus
a snapshot of the recent past.
• The GHI combines three equally weighted indicators into one
score: the proportion of people who are undernourished, the
proportion of children under five who are underweight, and the
mortality rate of children younger than age five.
• An increase in a country’s GHI score indicates that the hunger
situation is worsening, while a decrease in the score indicates
improvement in the country’s hunger situation.
7. Summary: Background Facts and Key Findings (2)
• According to the GHI, hunger on a global scale remains “serious.”
Twenty countries have levels of hunger that are “alarming” or
“extremely alarming.”
• The 2012 world GHI fell by 26 percent from the 1990 world GHI,
from a score of 19.8 to 14.7.
• South Asia and Sub-Saharan Africa have the highest levels of
hunger with regional scores of 22.5 and 20.7, respectively.
• From the 1990 GHI to the 2012 GHI, 15 countries reduced their
scores by 50 percent or more.
• In terms of absolute progress, Angola, Bangladesh, Ethiopia,
Malawi, Nicaragua, Niger, and Vietnam saw the largest
improvements in their scores from the 1990 to 2012 GHI.
8. Summary: Background Facts and Key Findings (3)
• In terms of absolute progress, Angola, Bangladesh, Ethiopia,
Malawi, Nicaragua, Niger, and Vietnam saw the largest
improvements in their scores from the 1990 to 2012 GHI.
• Haiti’s GHI score fell about one quarter from 1990-2001, but most
of this improvement was reversed in subsequent years. The
devastating 2010 earthquake, although not fully captured by the
2012 GHI because of insufficient data, pushed Haiti back into the
category of “extremely alarming.”
• With the exception of North Korea, all the countries in which the
hunger situation worsened from the 1990 GHI to the 2012 GHI
are in Sub-Saharan Africa.
• More than 50 percent of the population is undernourished in
Burundi, Eritrea, and Haiti.
9. Good news, but …
• The GHI has declined somewhat since 1990,
but ...
… it remains “serious” with 14.7
• South Asia reduced its GHI score significantly
between 1990 an 1996, but ...
… could not maintain this rapid progress
• South Asia in the 1990s made more progress
than Sub-Saharan Africa, but …
… has fallen back since, its 2012 score now
higher than that of Sub-Saharan Africa
23. The centrality of land, water, and energy for
smallholders
Welthungerhilfe:
How pressure for land transforms rural
livelihoods in Sierra Leone
Concern Worldwide:
Land title and water in rural Tanzania:
Protecting the livelihoods of poor farmers
25. Responsible governance of natural resources:
Getting the policy frameworks right
• Secure land and water rights
• Phase out subsidies
• Create a macroeconomic enabling environment
26. Scaling up technical approaches:
Addressing the nexus
• Invest in agricultural production technologies that
support increased land, water, and energy
efficiency
• Foster approaches resulting in more efficient land,
water, and energy use along the value chain
• Prevent resource depletion by monitoring and
evaluating strategies in water, land, energy, and
agricultural systems
27. Addressing the drivers of natural resource scarcity:
Managing the risks
• Address demographic change, women’s access to
education and reproductive health
• Raise incomes, lower inequality, and promote
sustainable life-styles
• Mitigate and adapt to climate change through
agriculture
28. • Available in English,
German, Spanish, French,
and Italian
• Download from
www.ifpri.org
www.welthungerhilfe.de
www.concern.net
• Embed interactive world
hunger map
• Wikipedia and Google
Books
• Available as interactive
e-book for Kindle, iPad,
and mobile phone