Downloaded 15 times
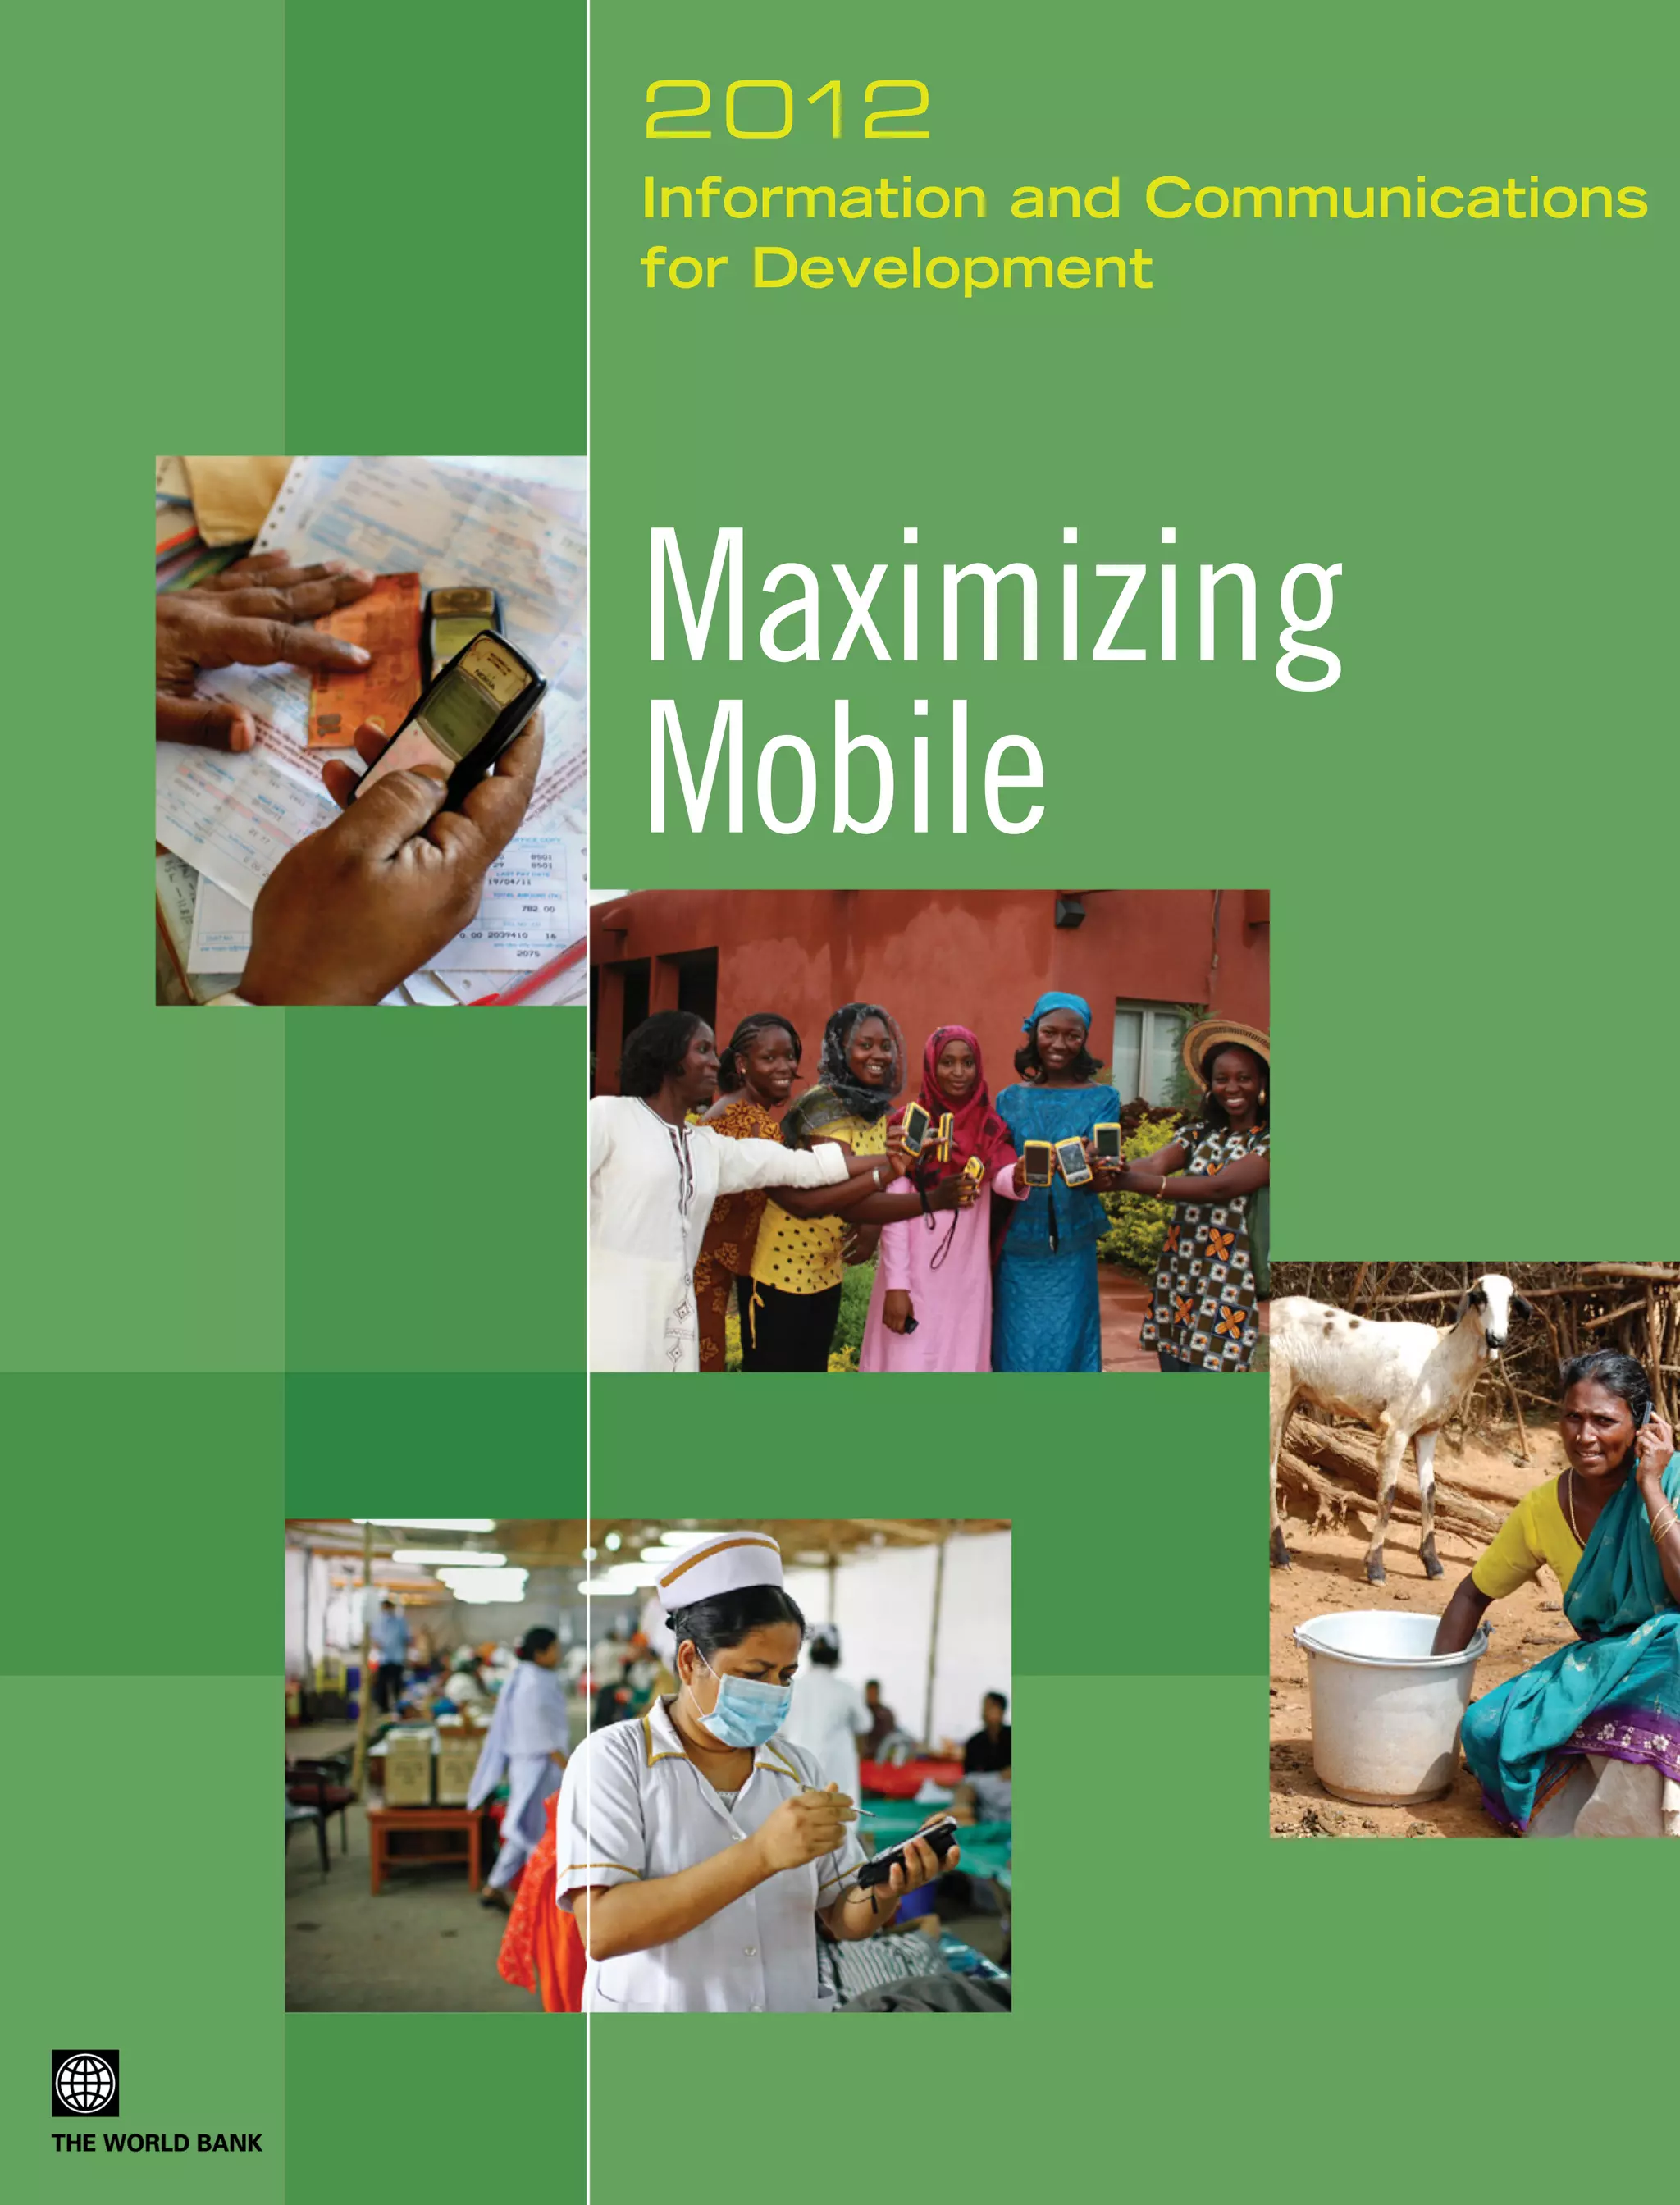


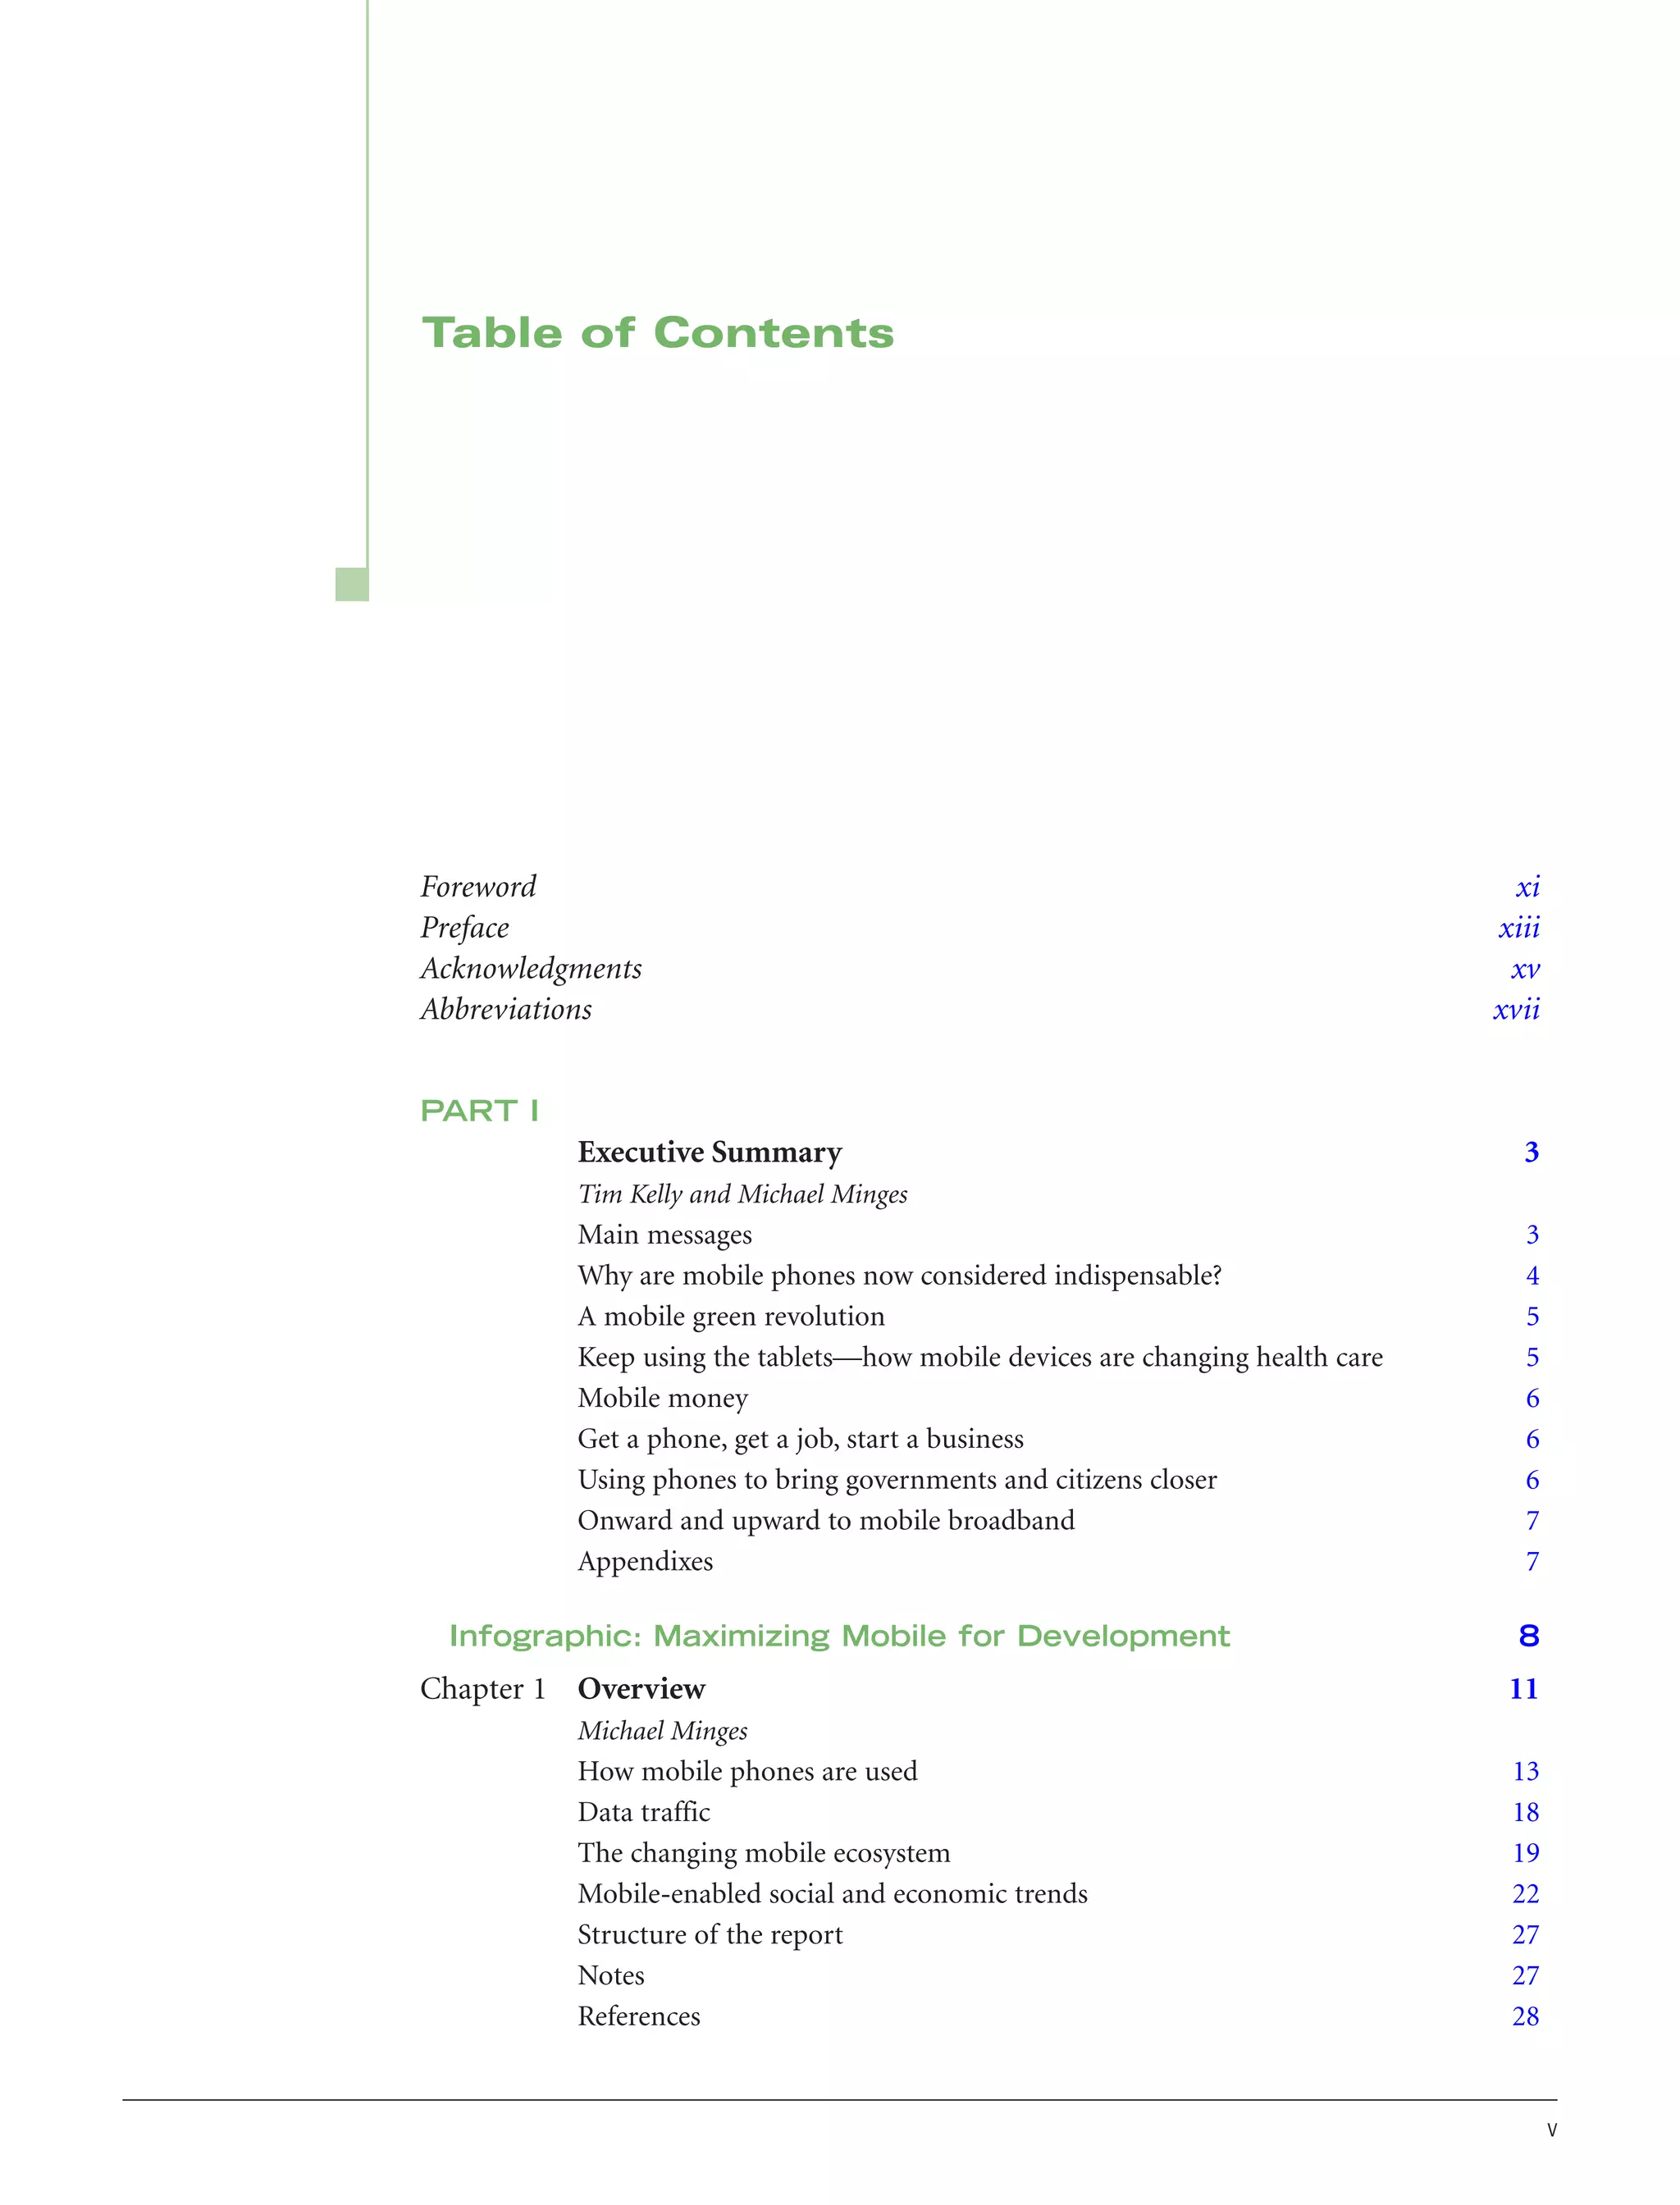
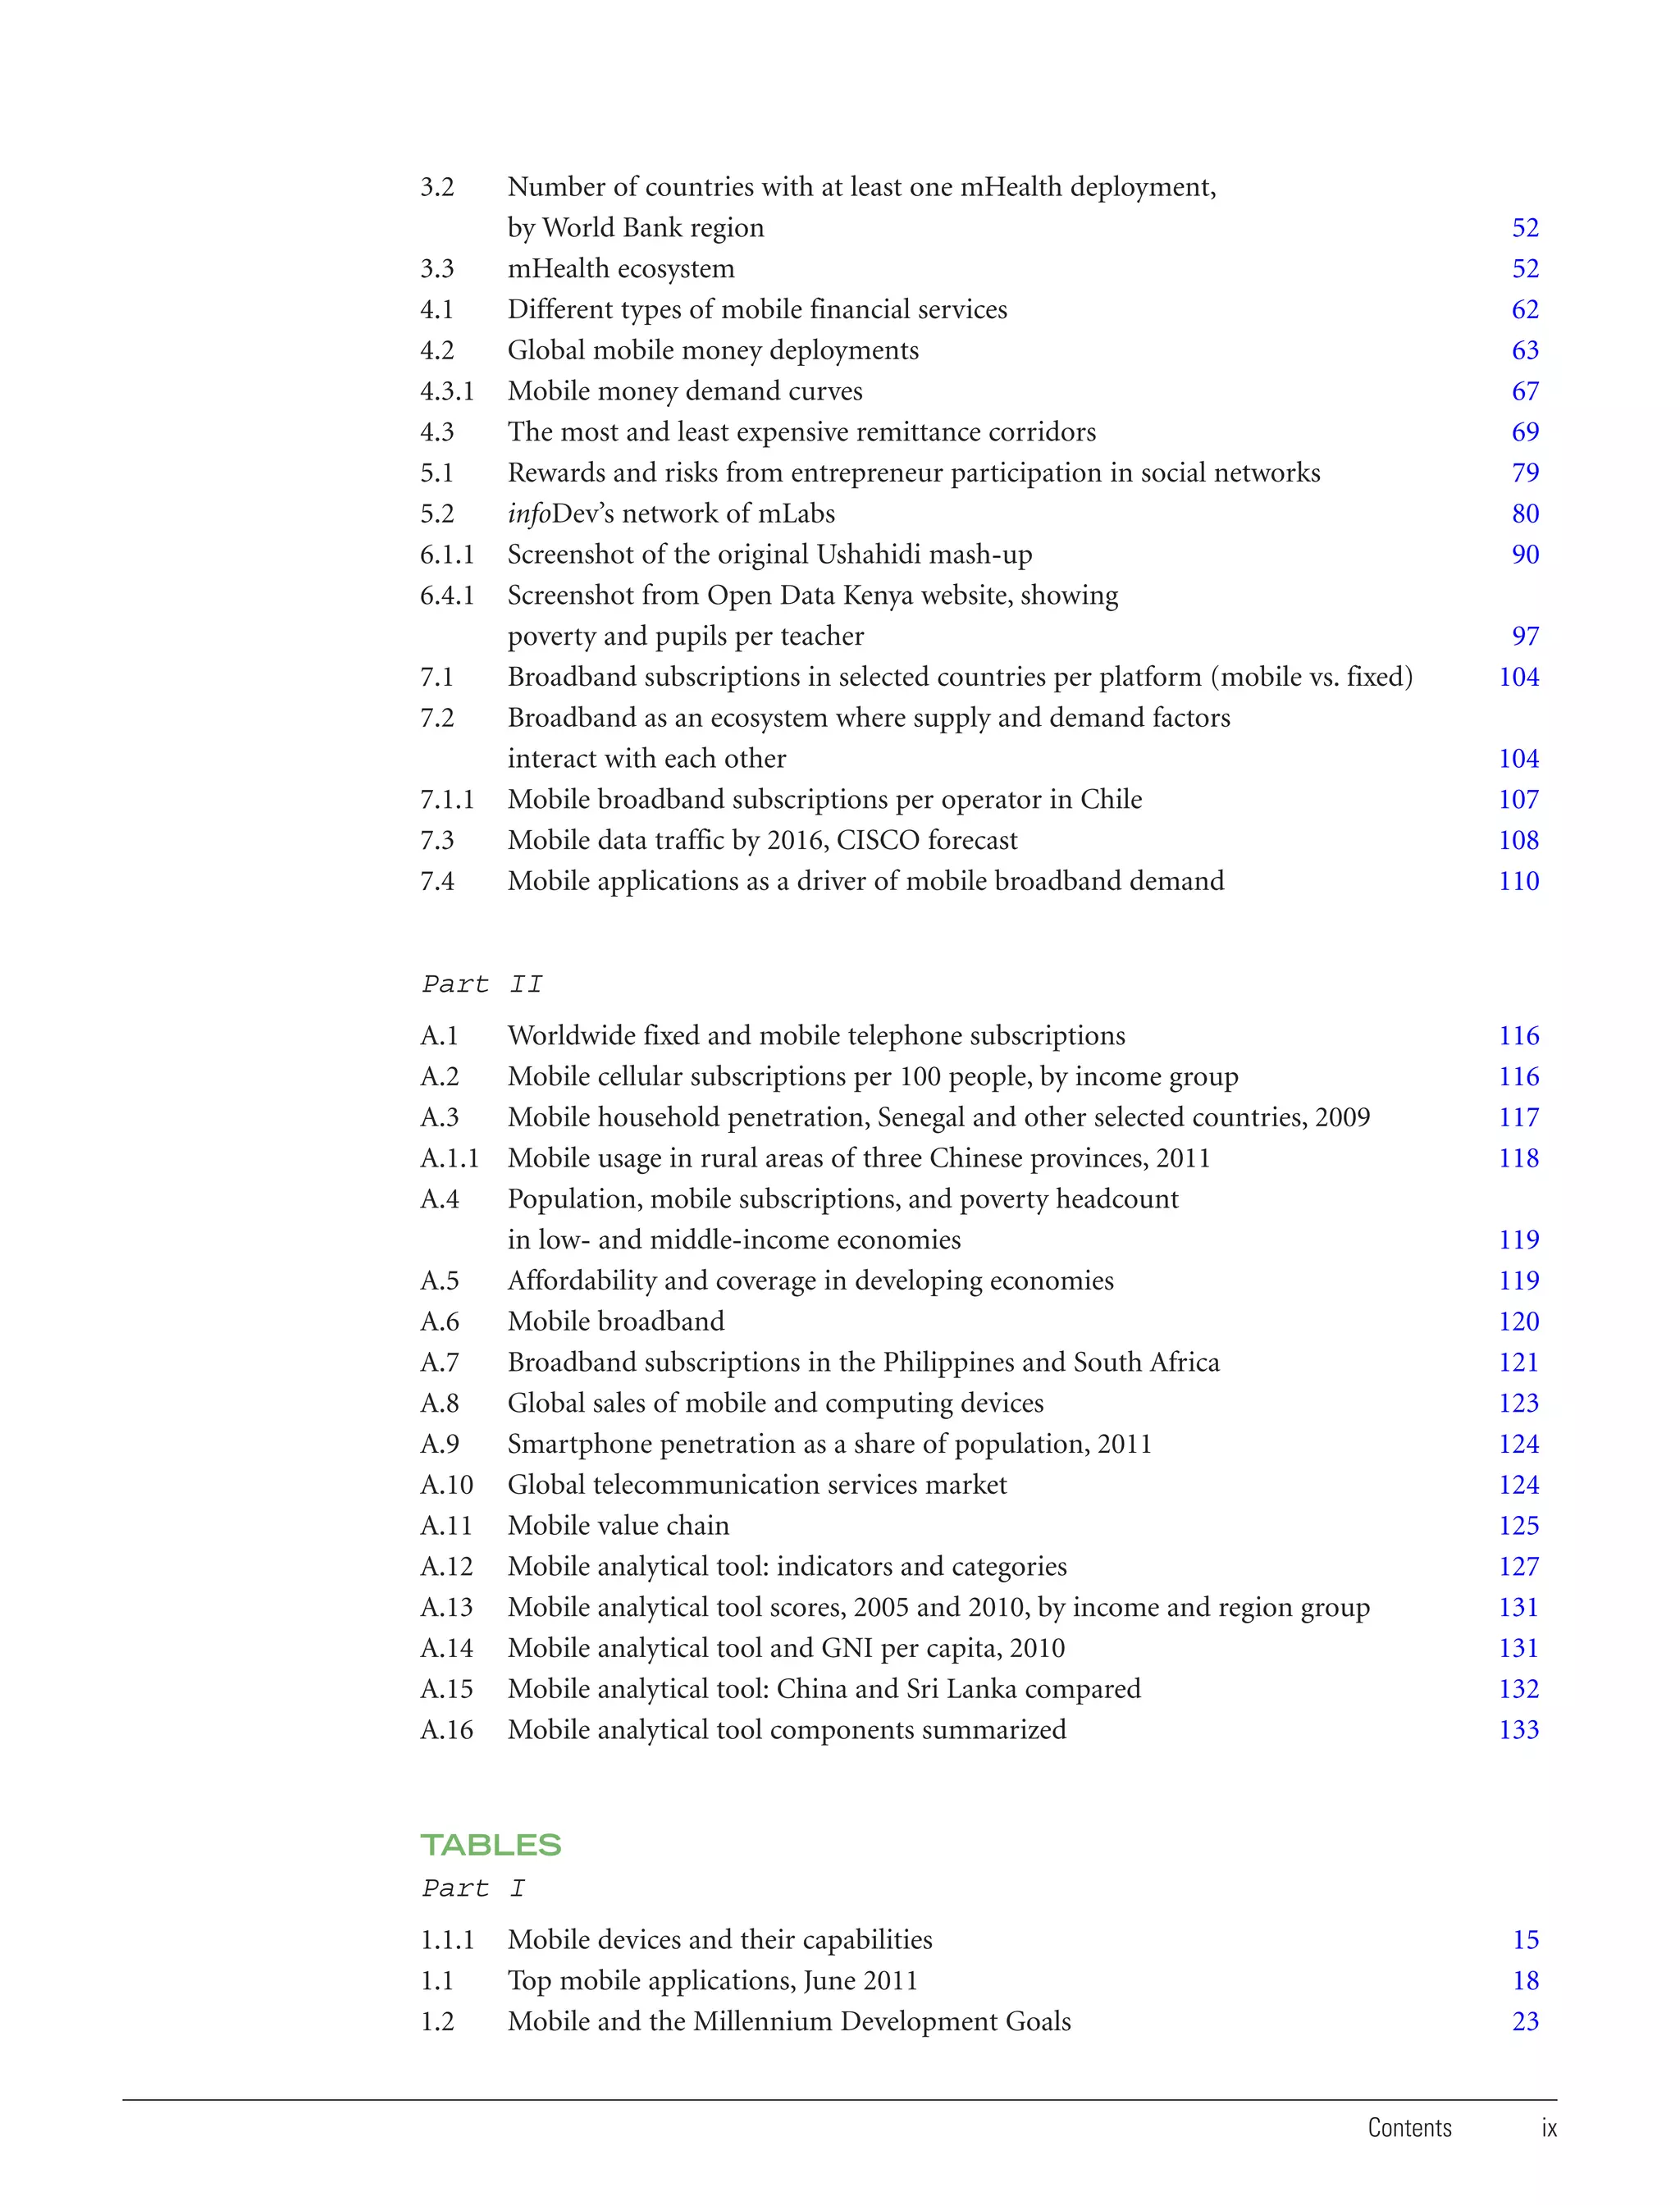


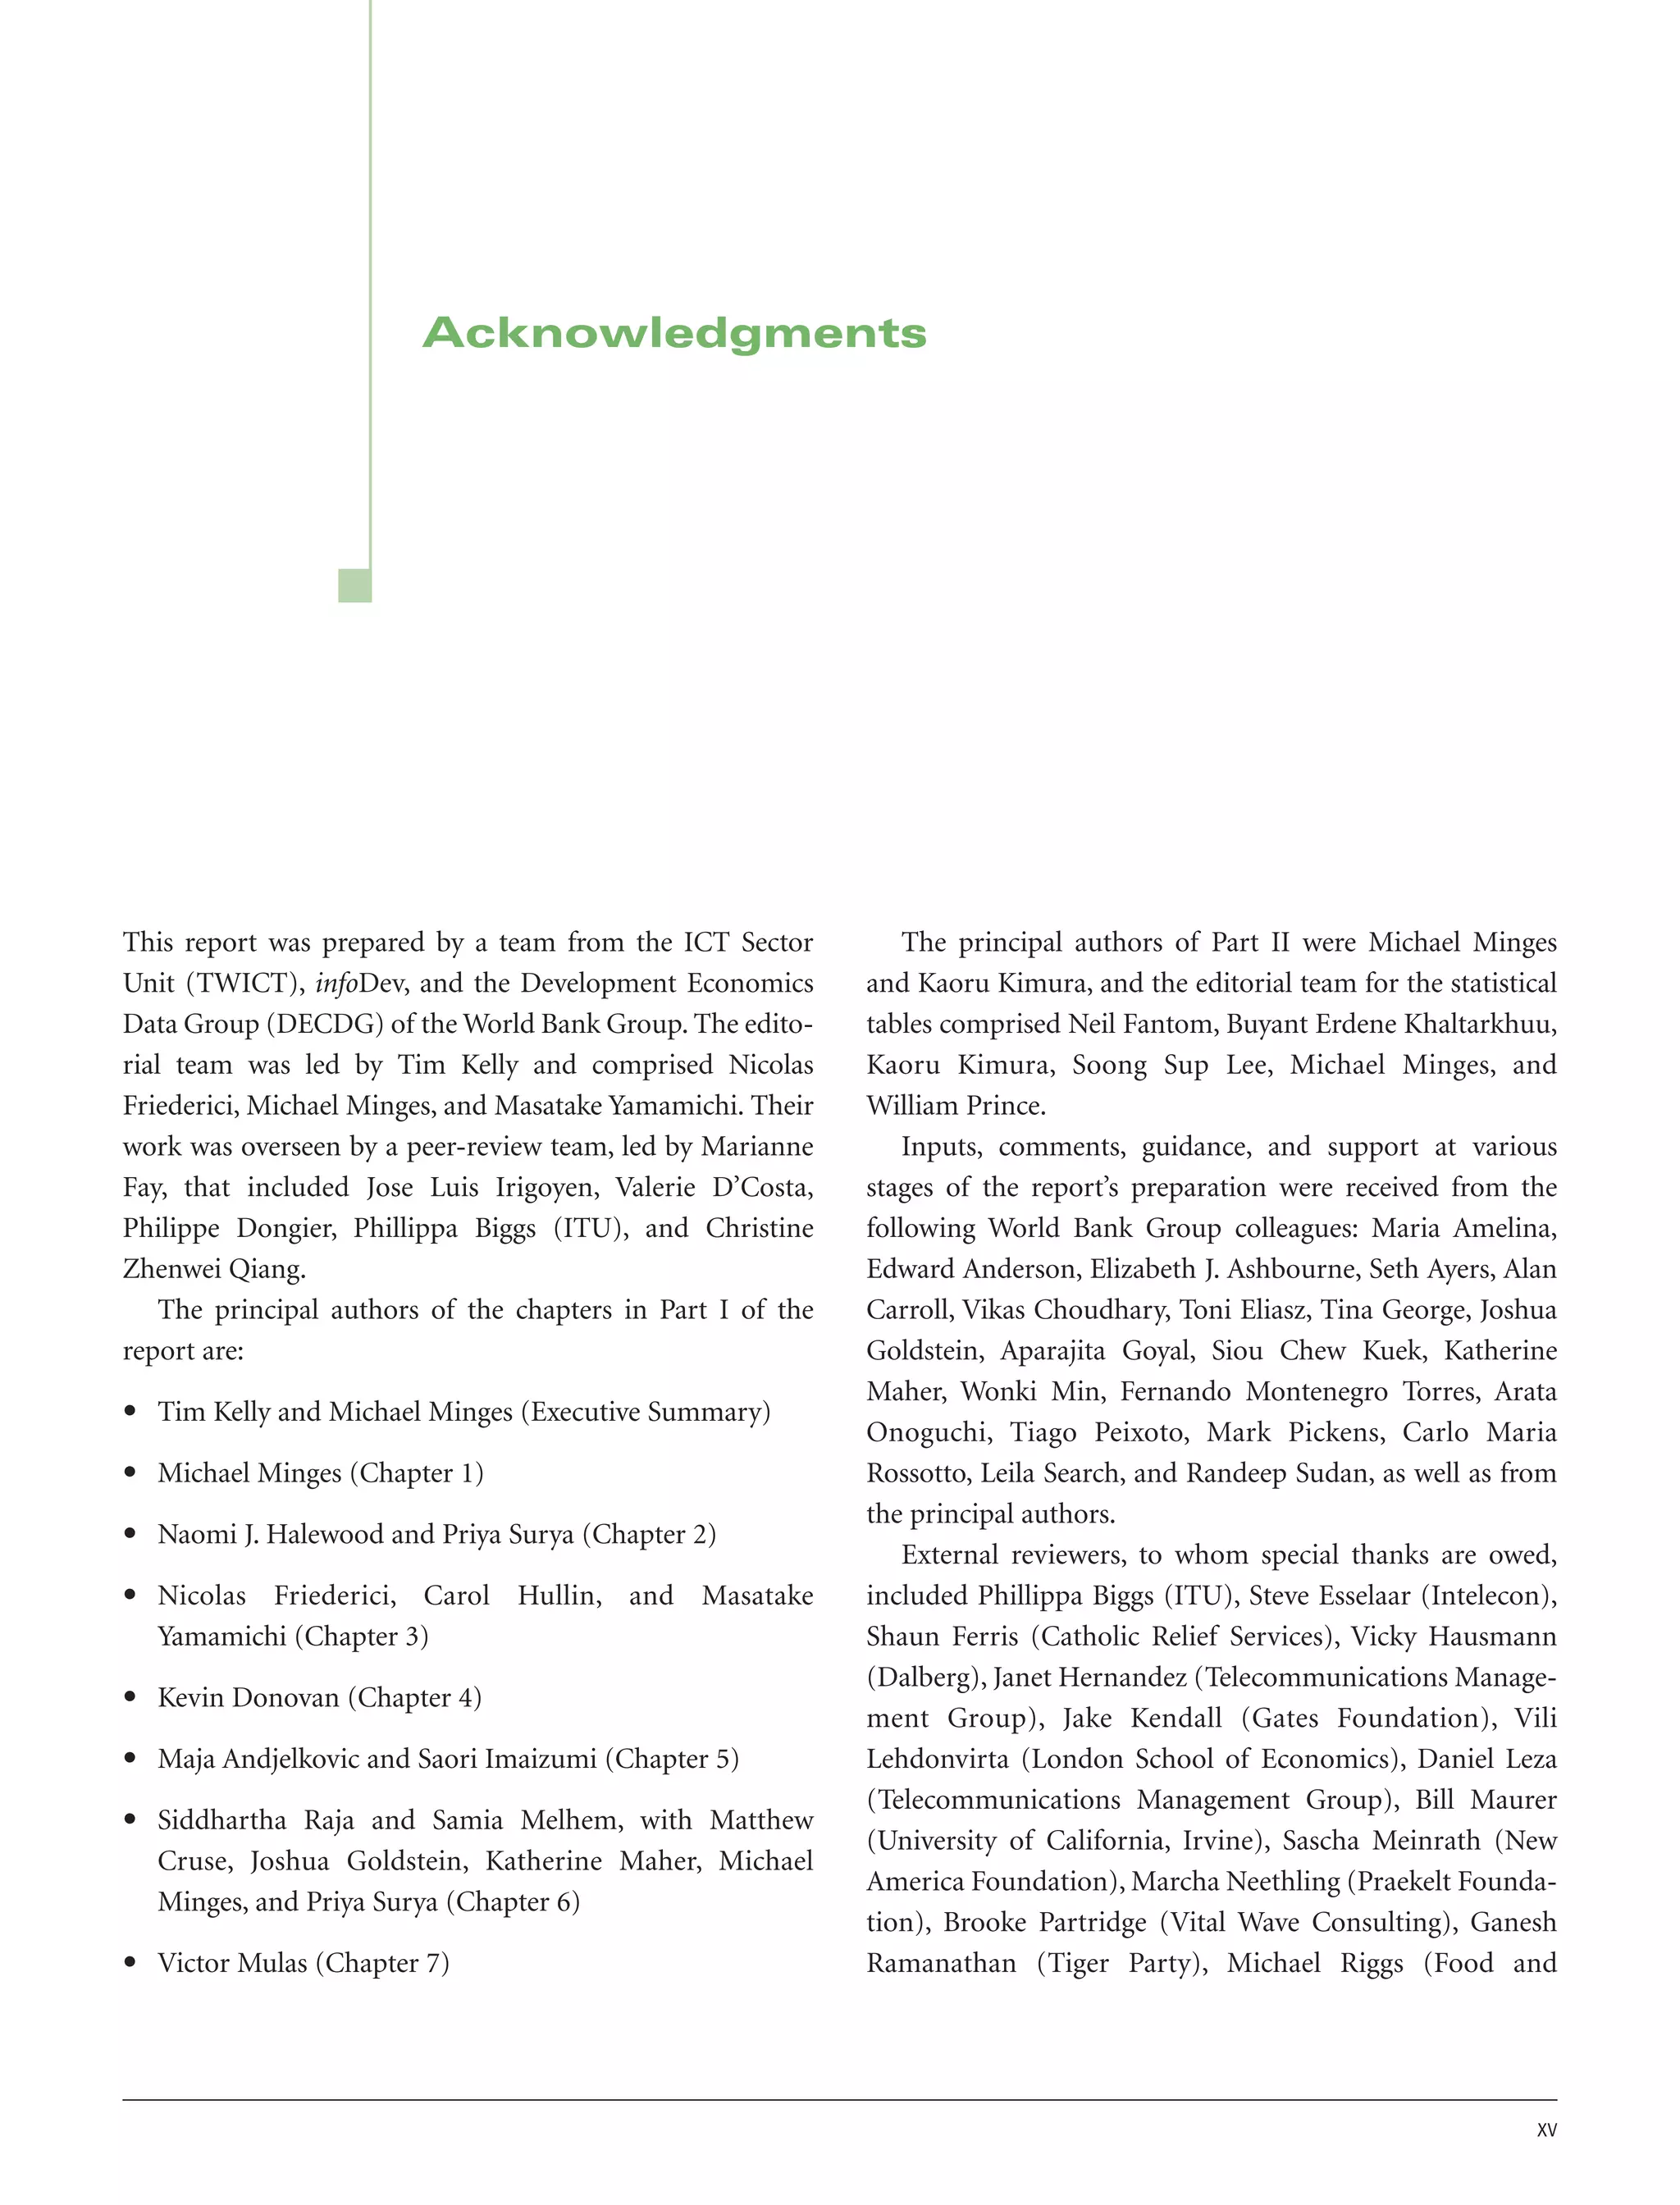
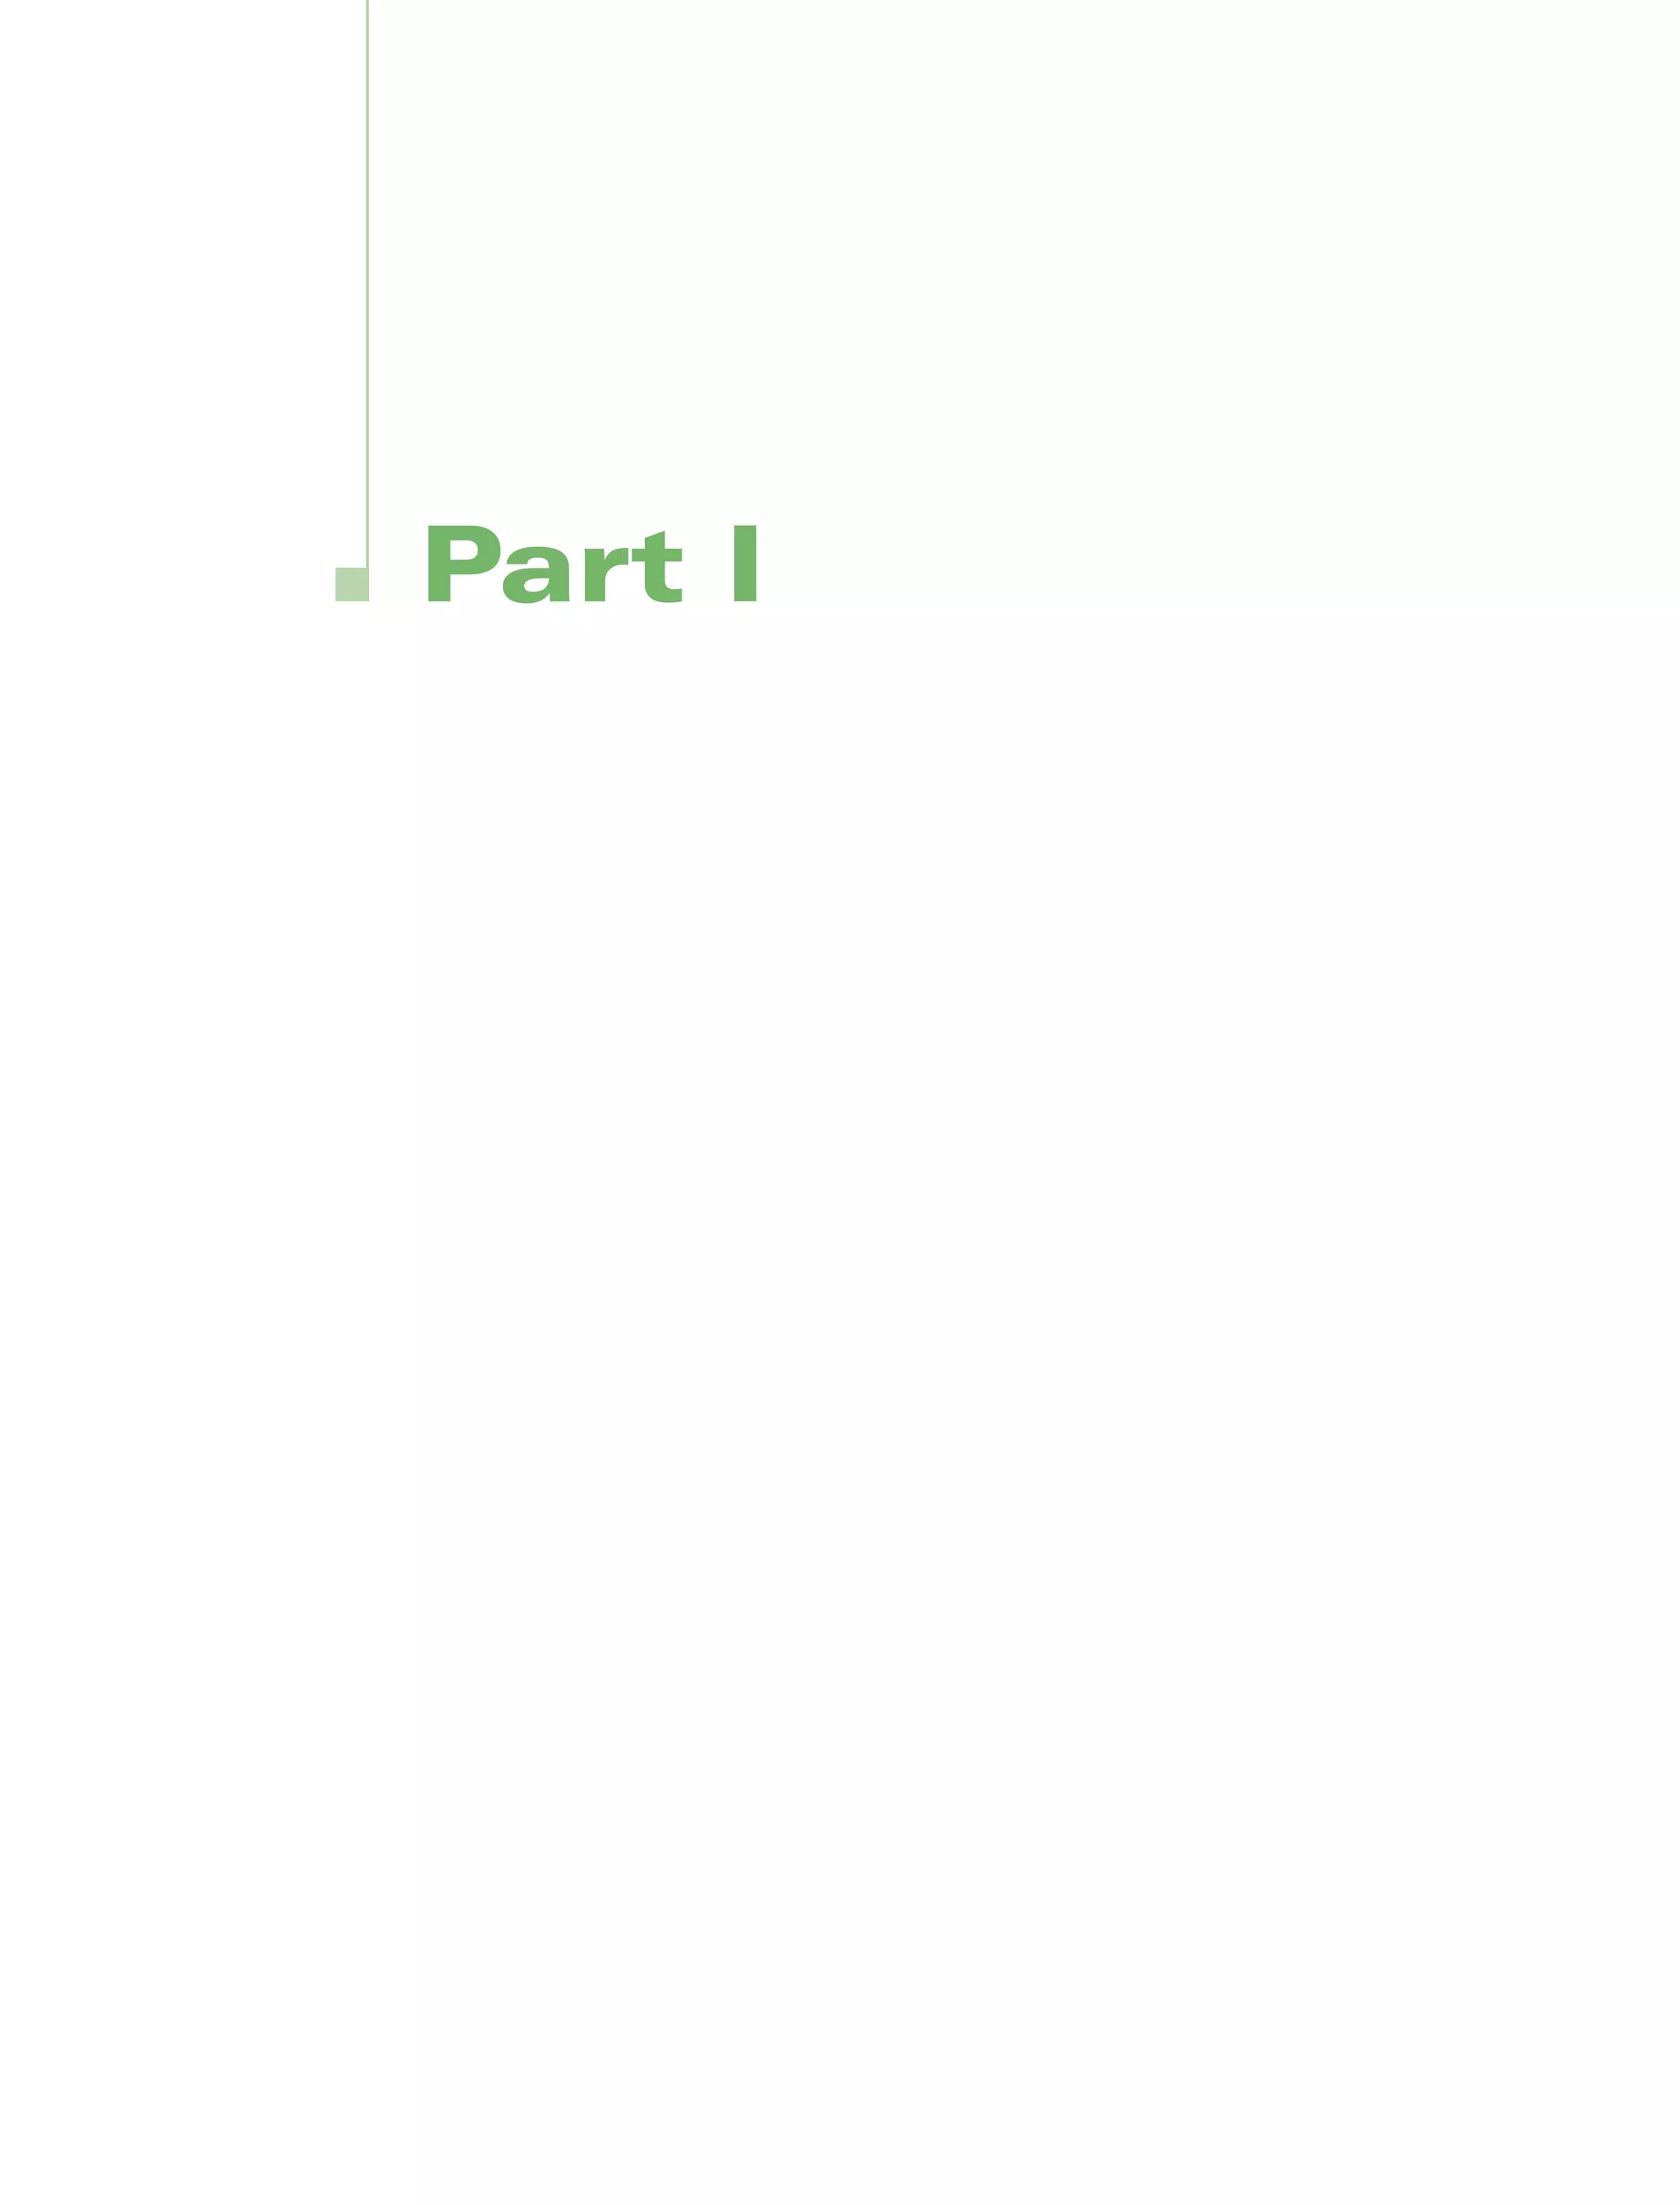

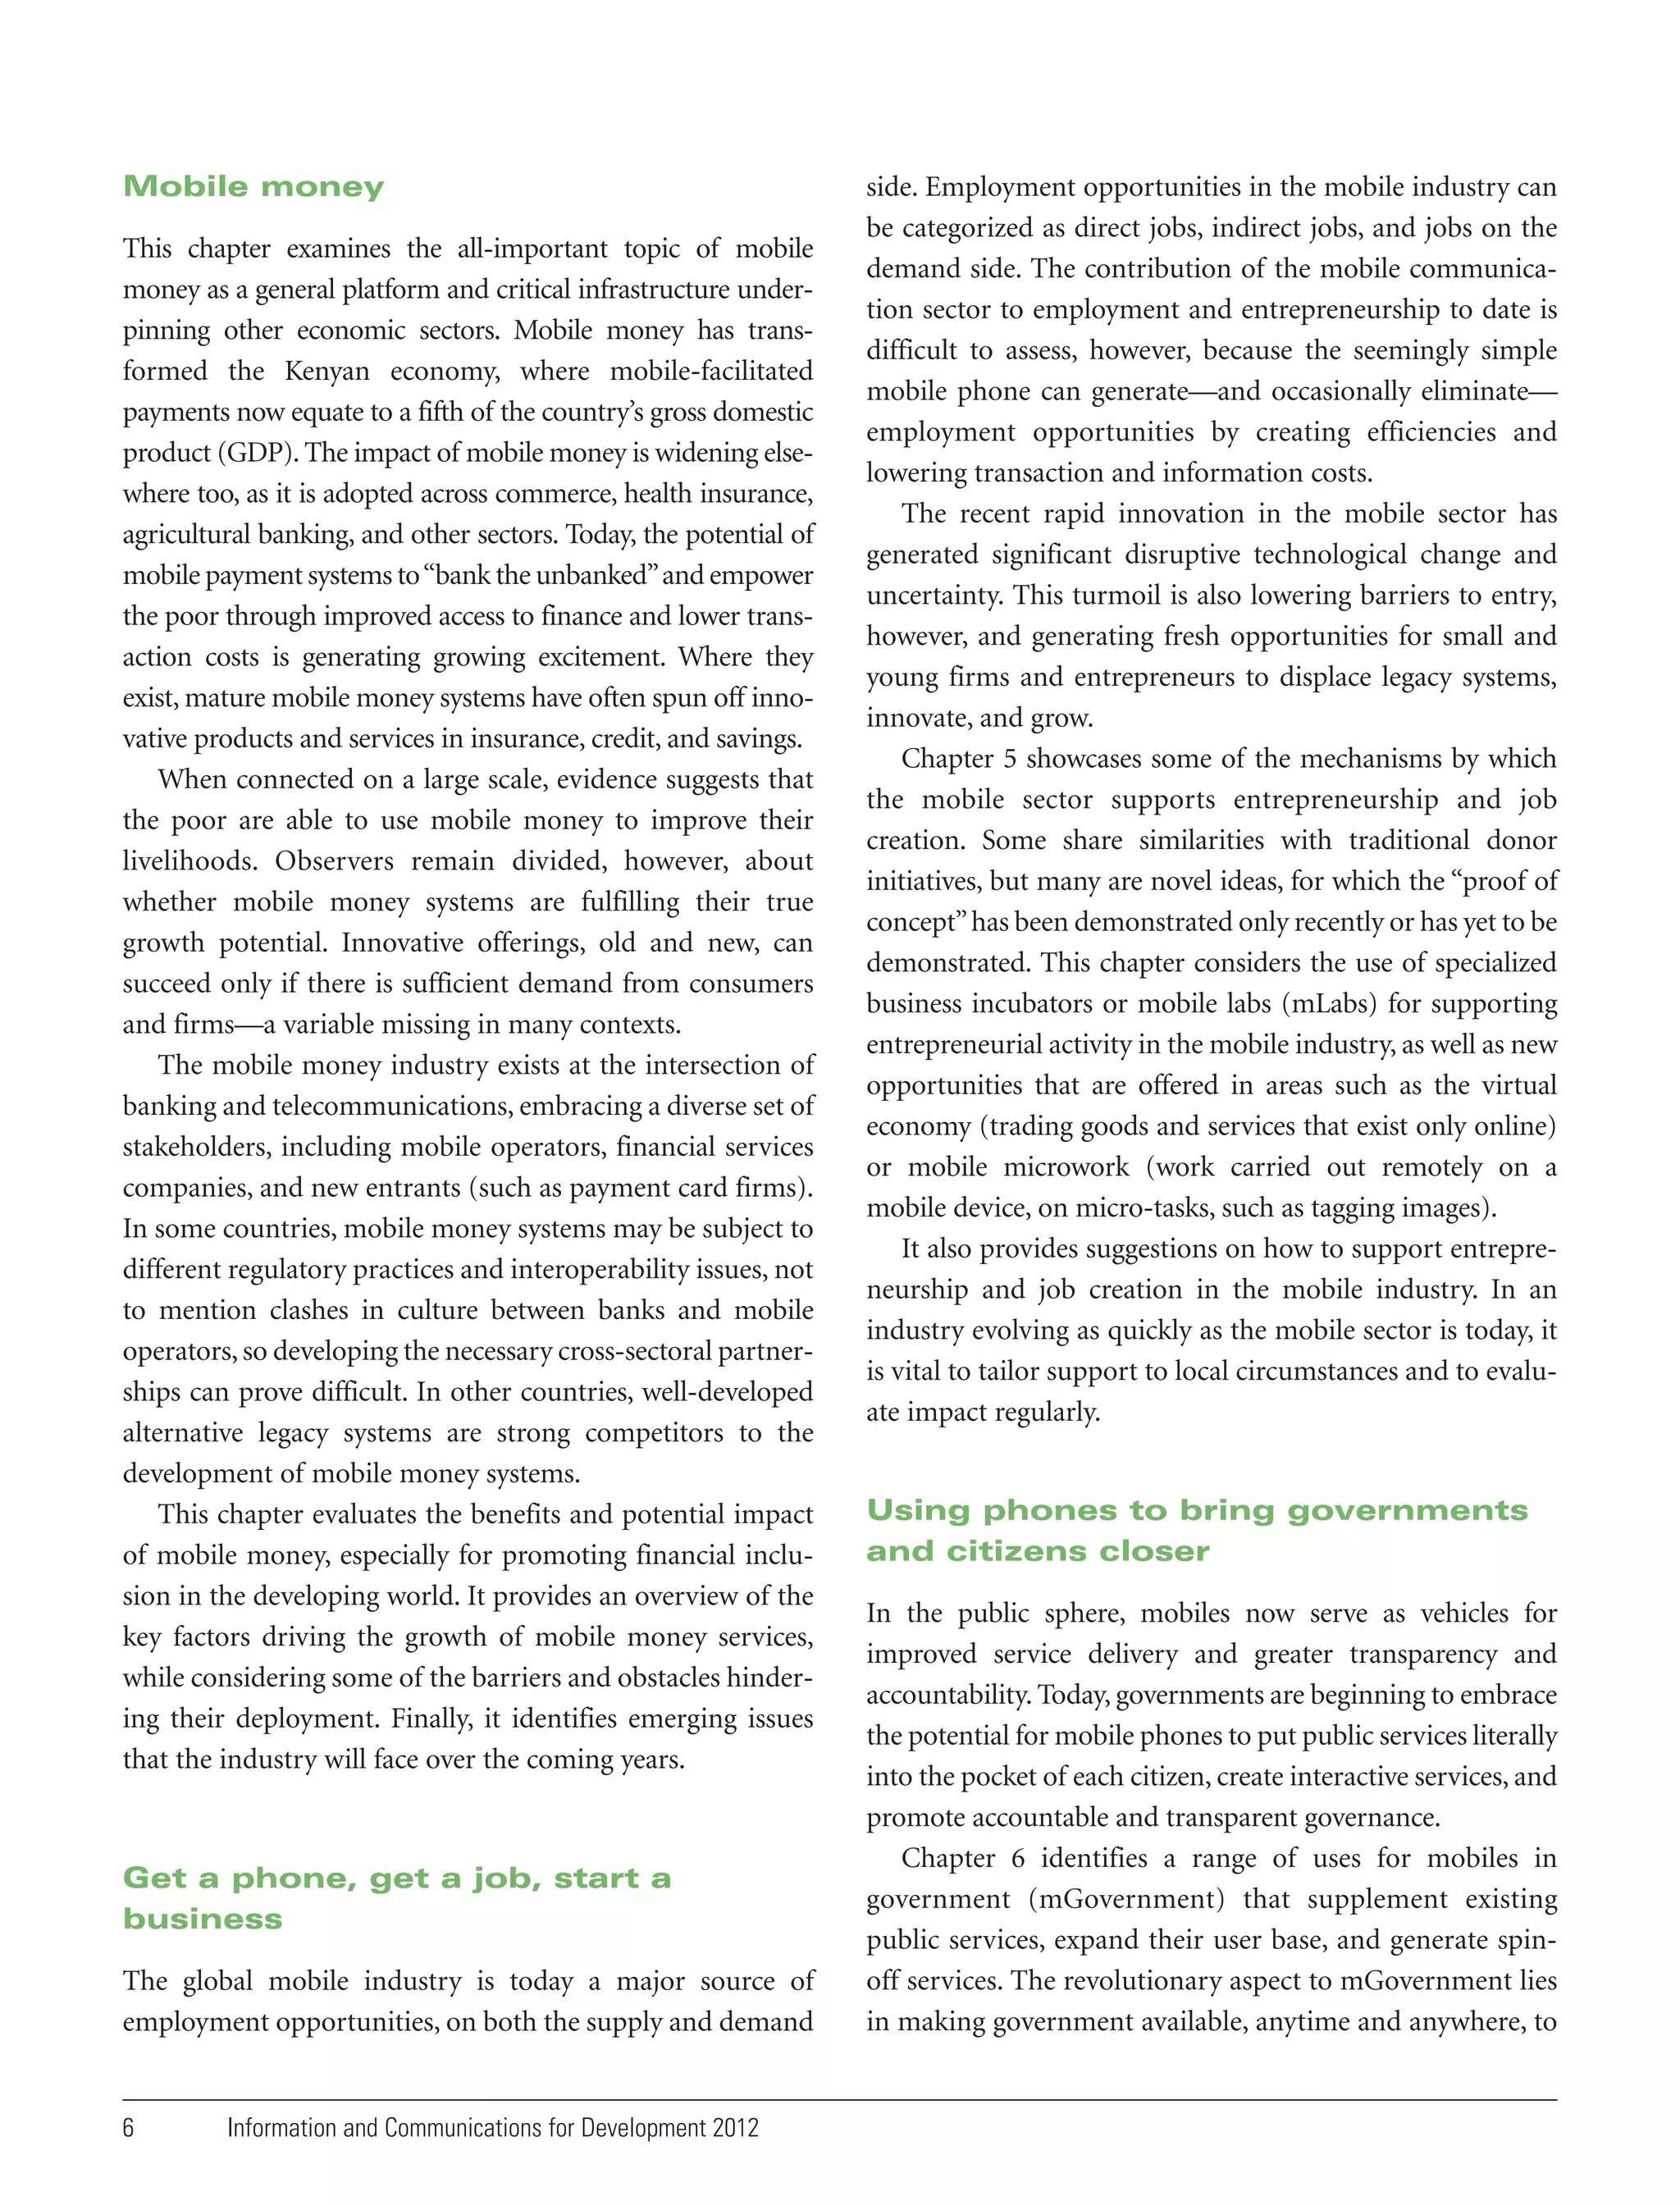

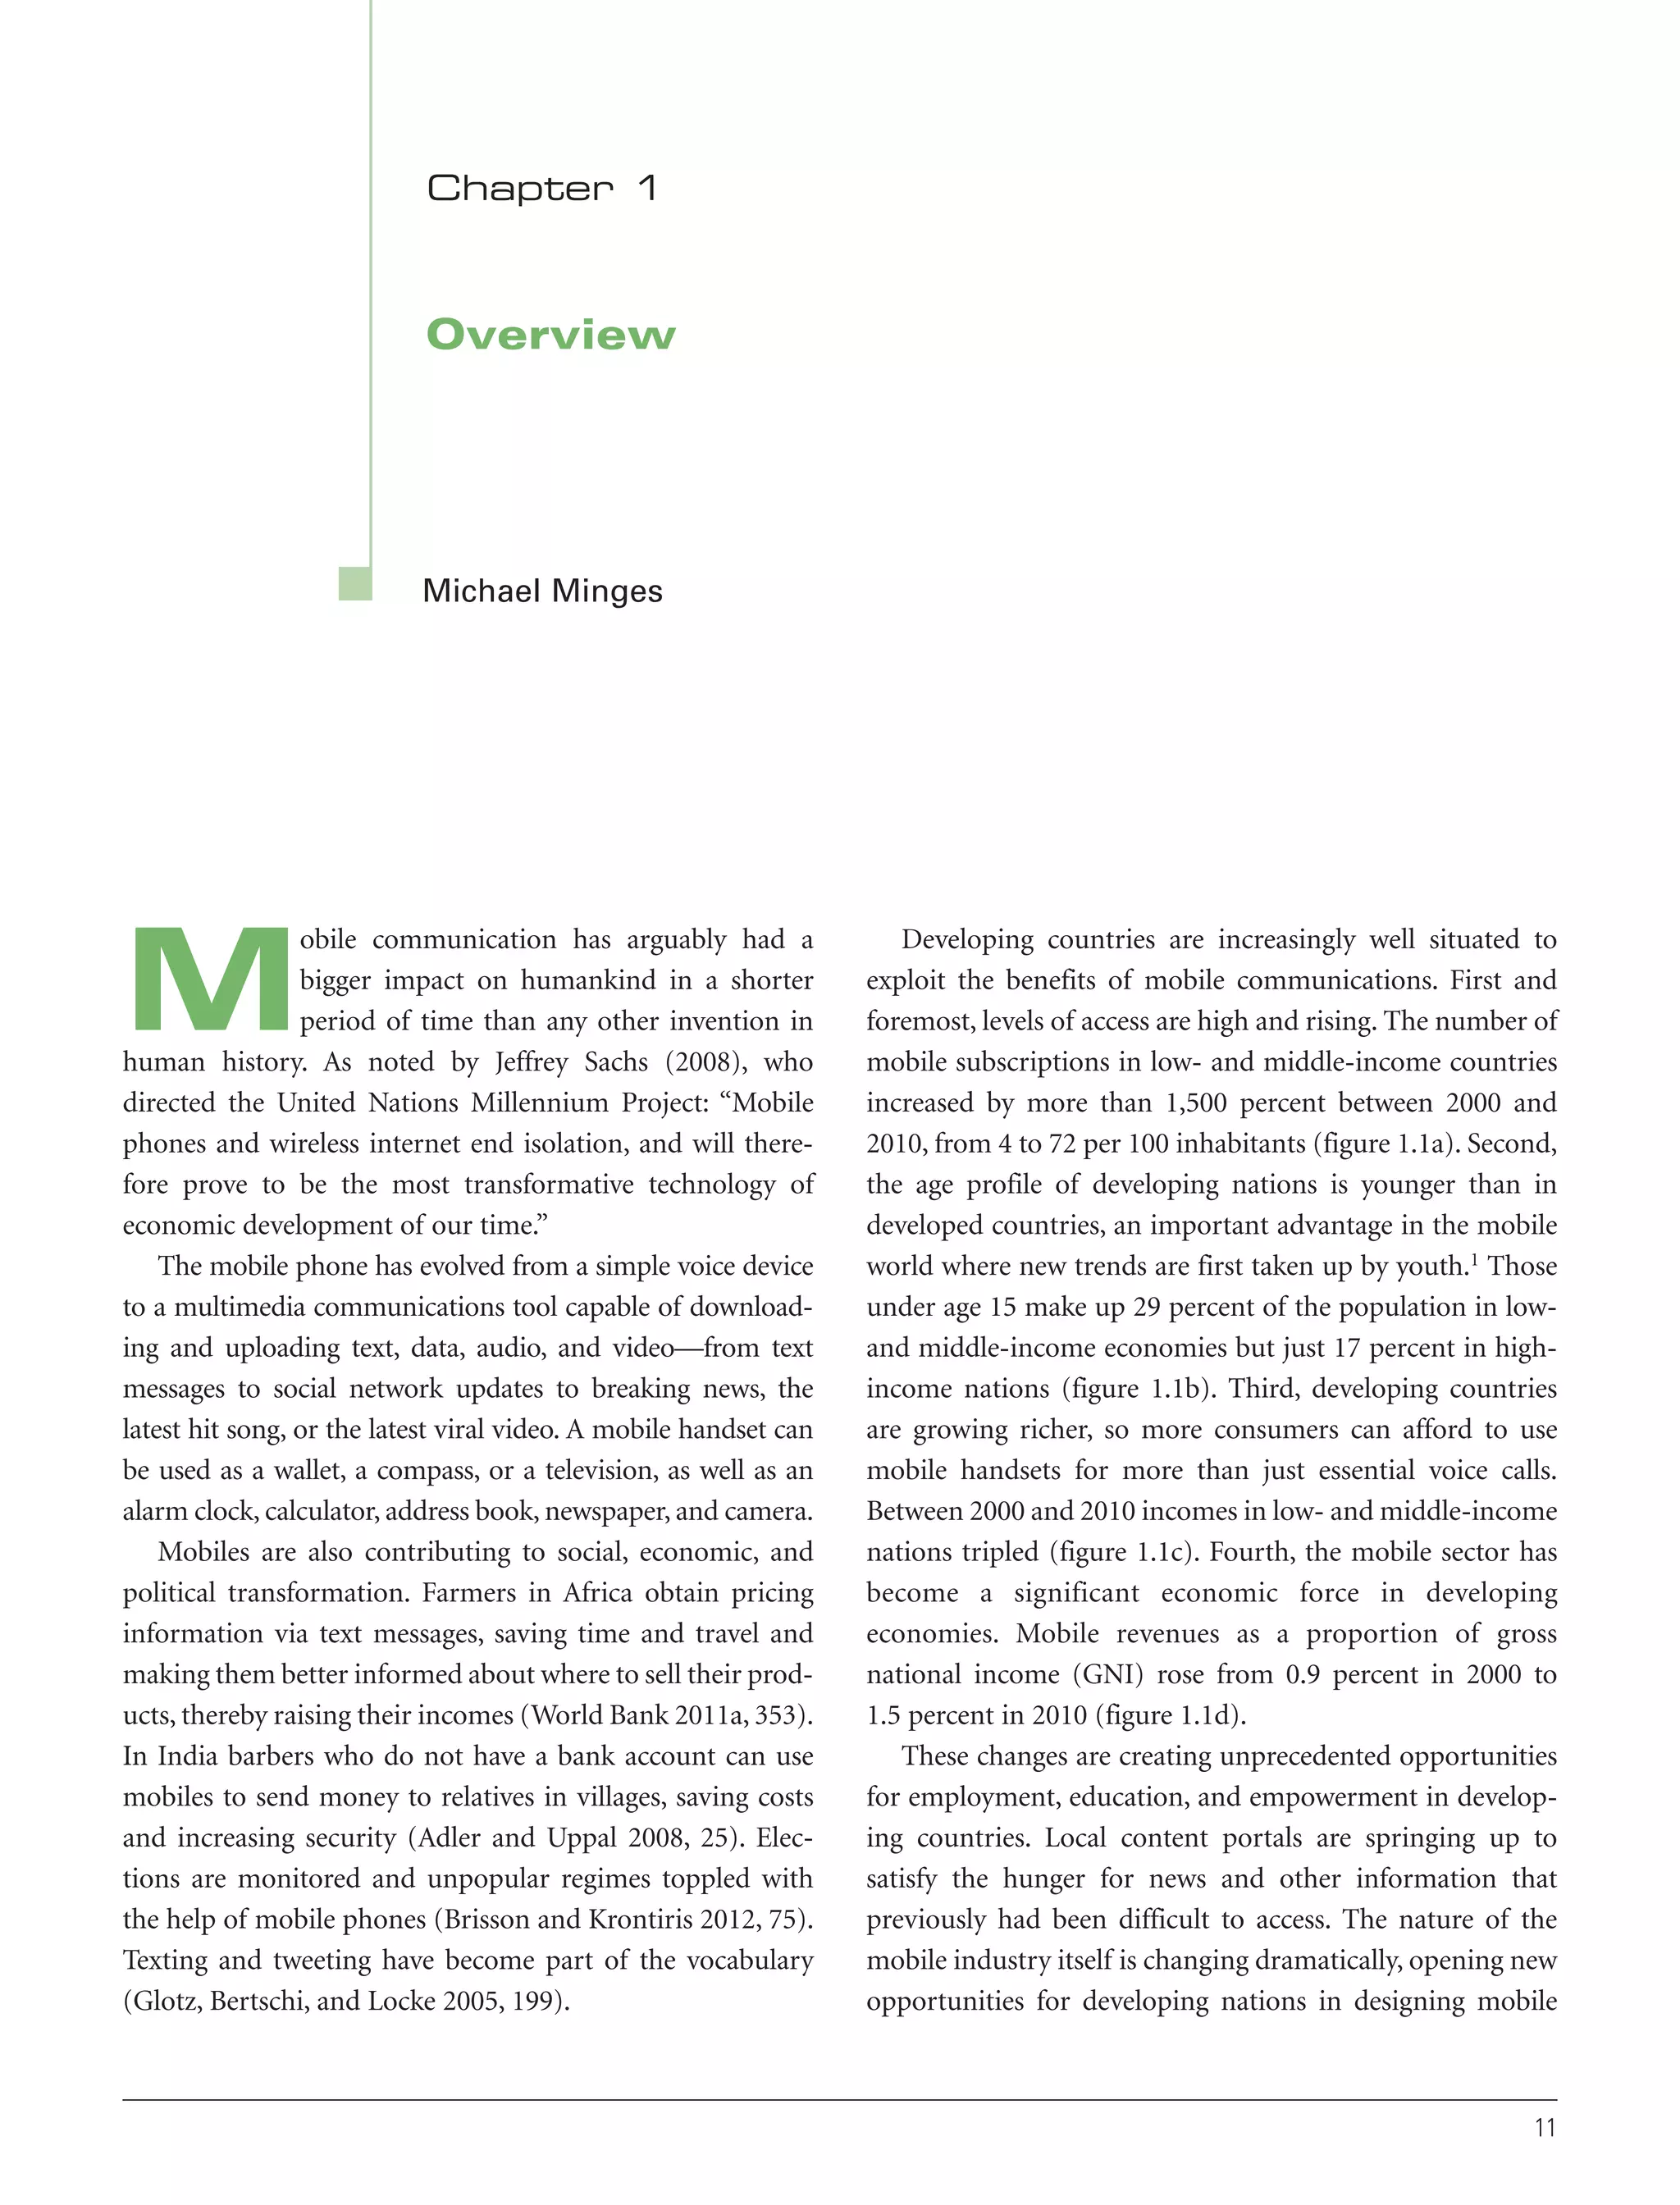
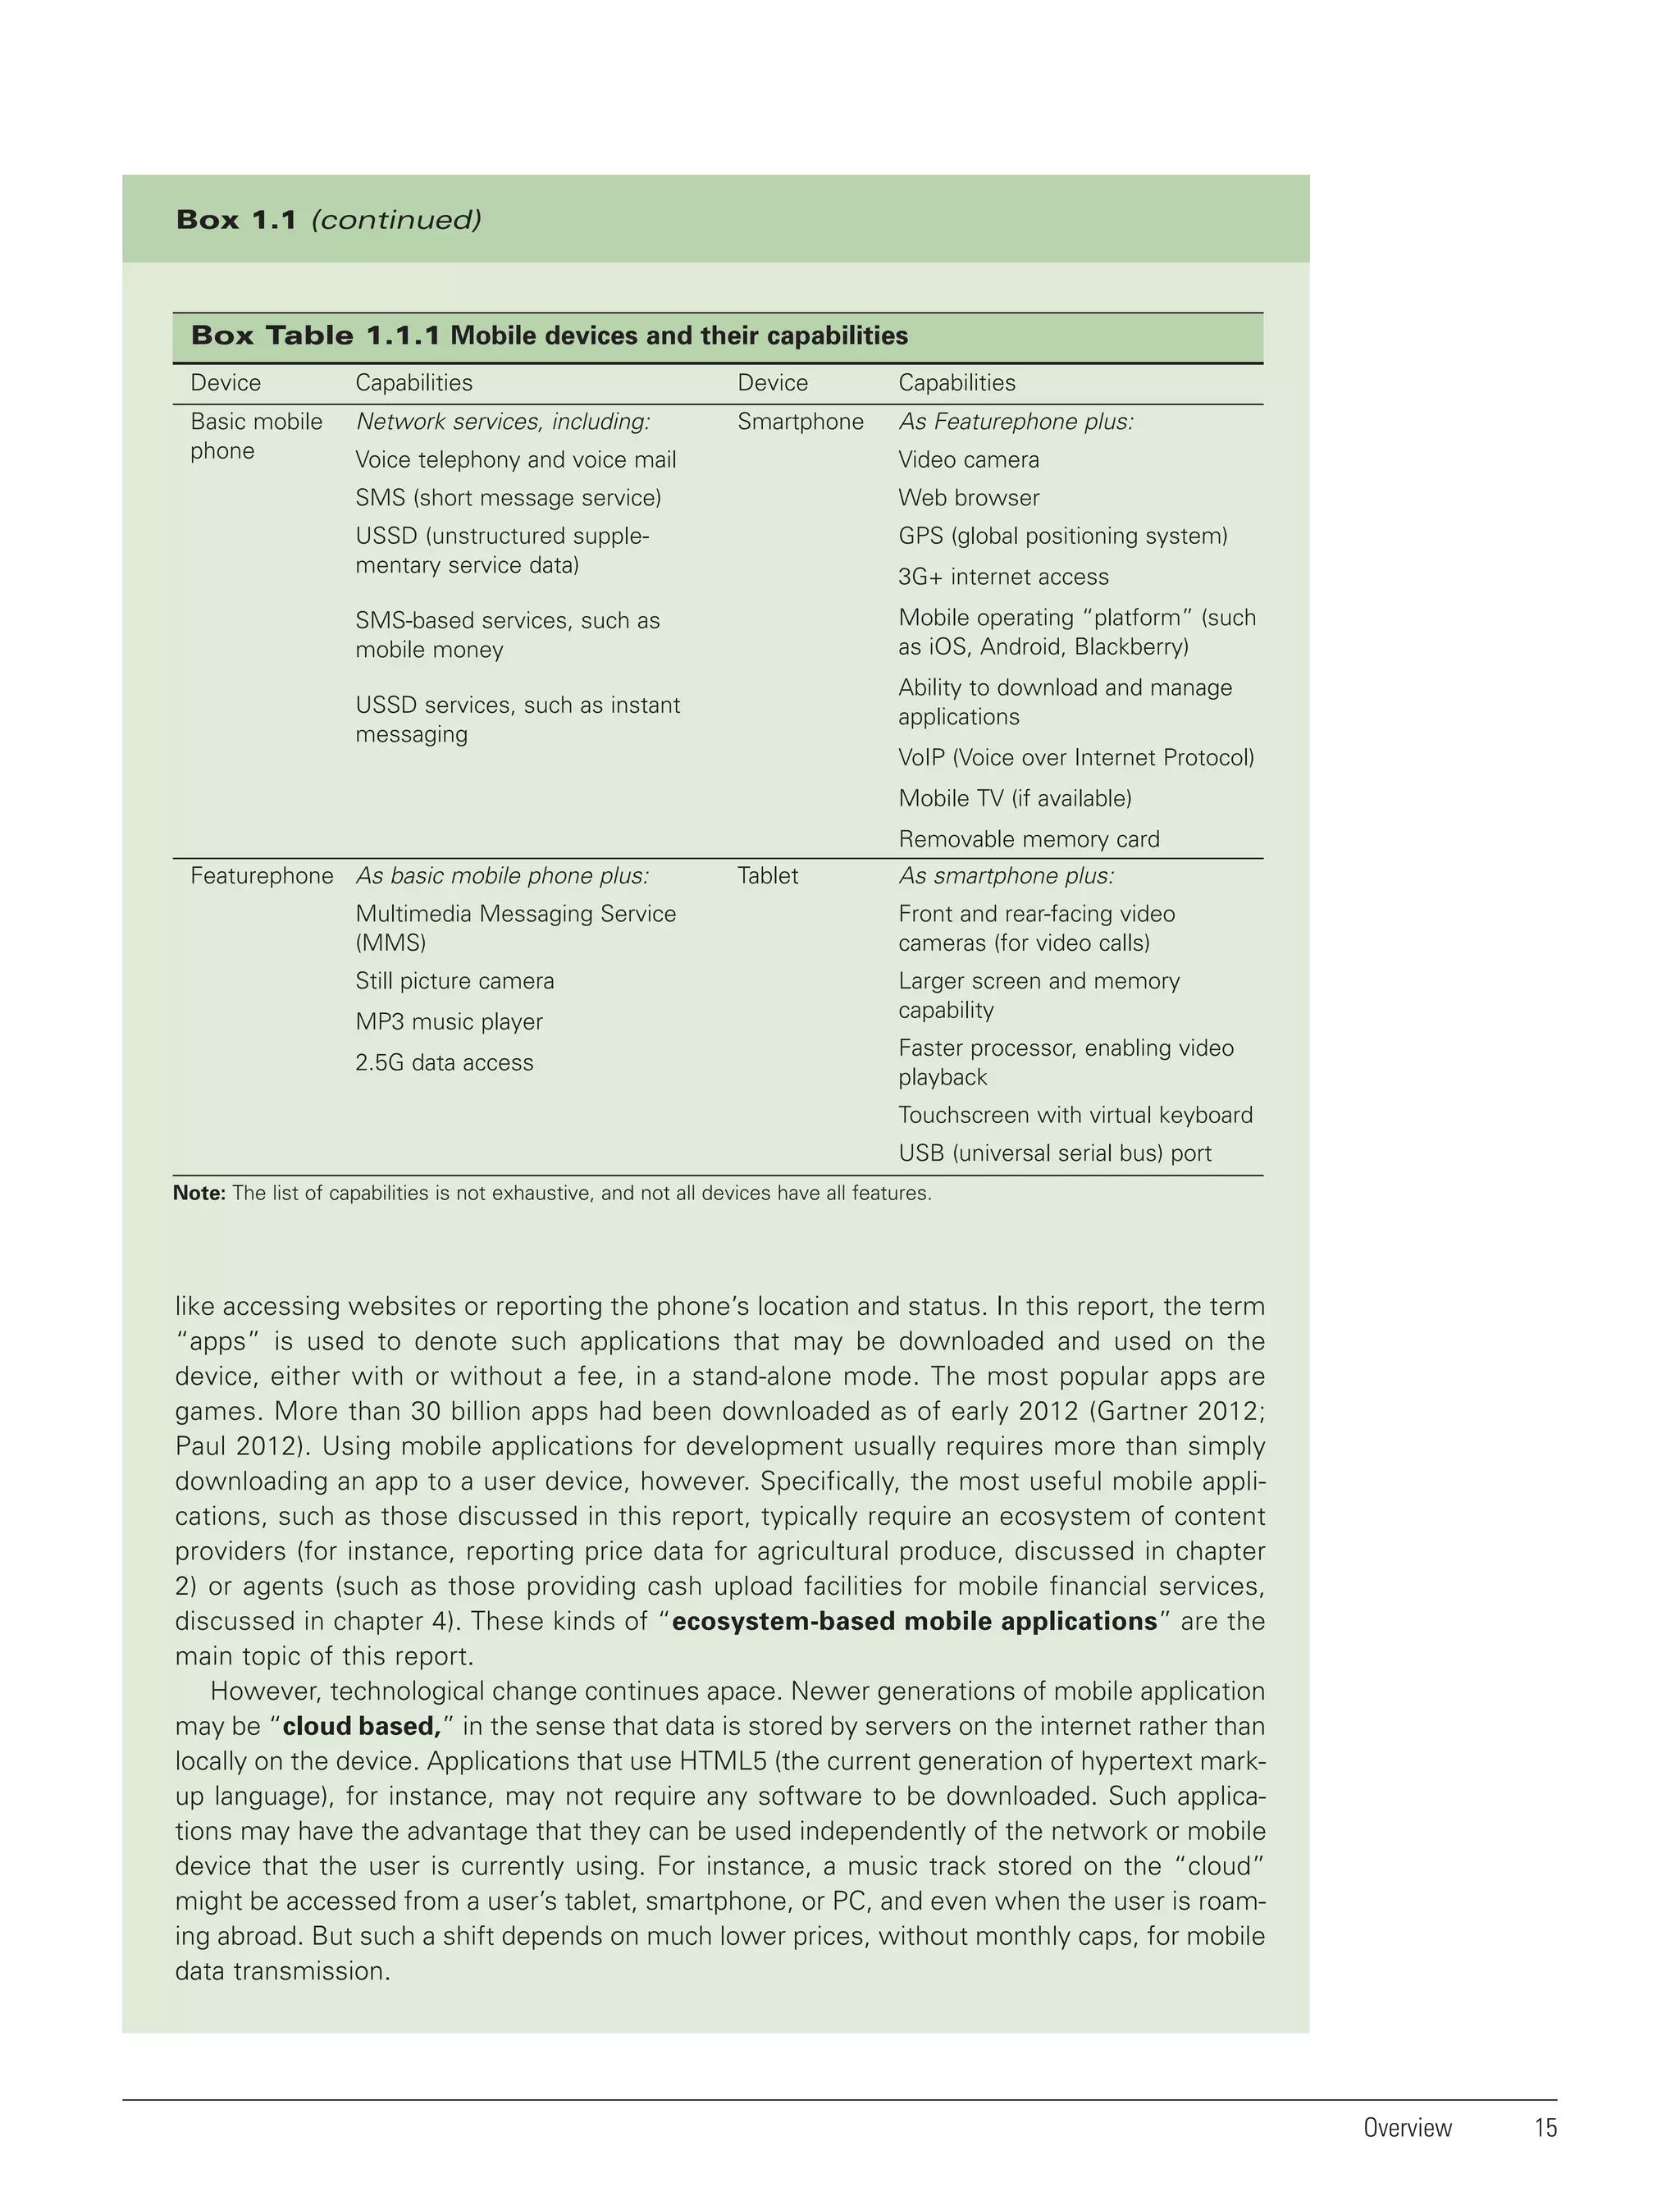
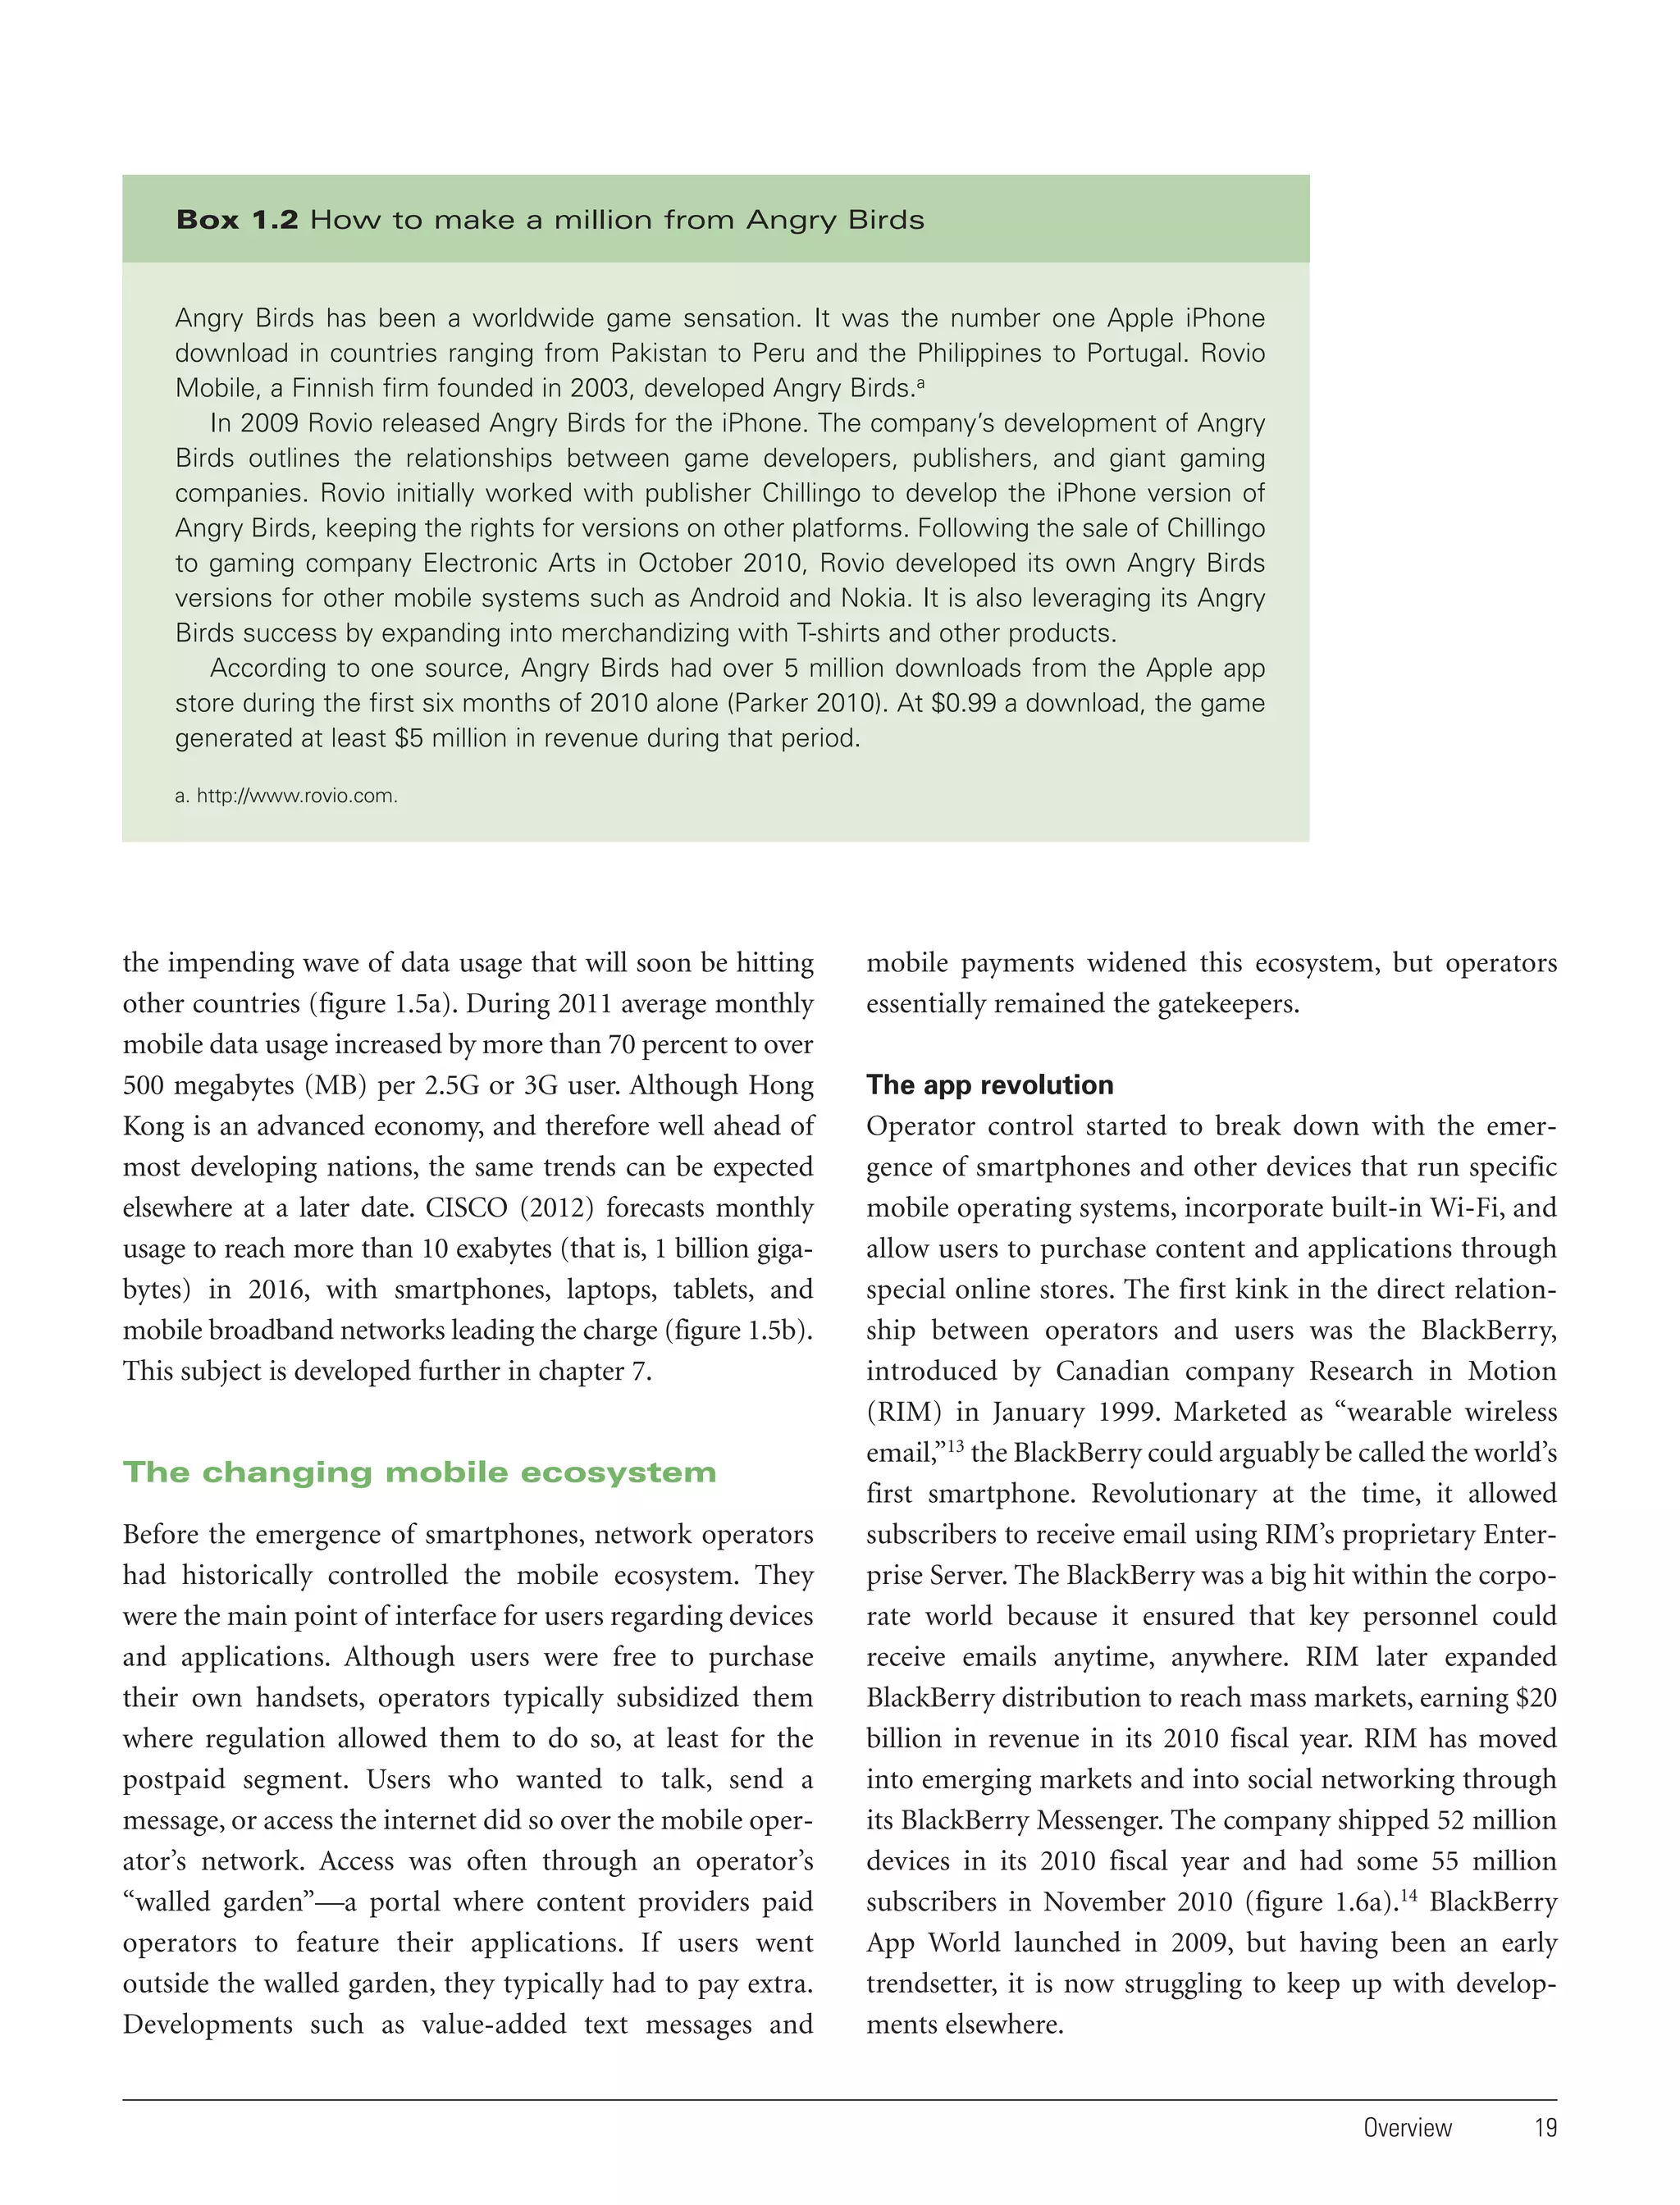
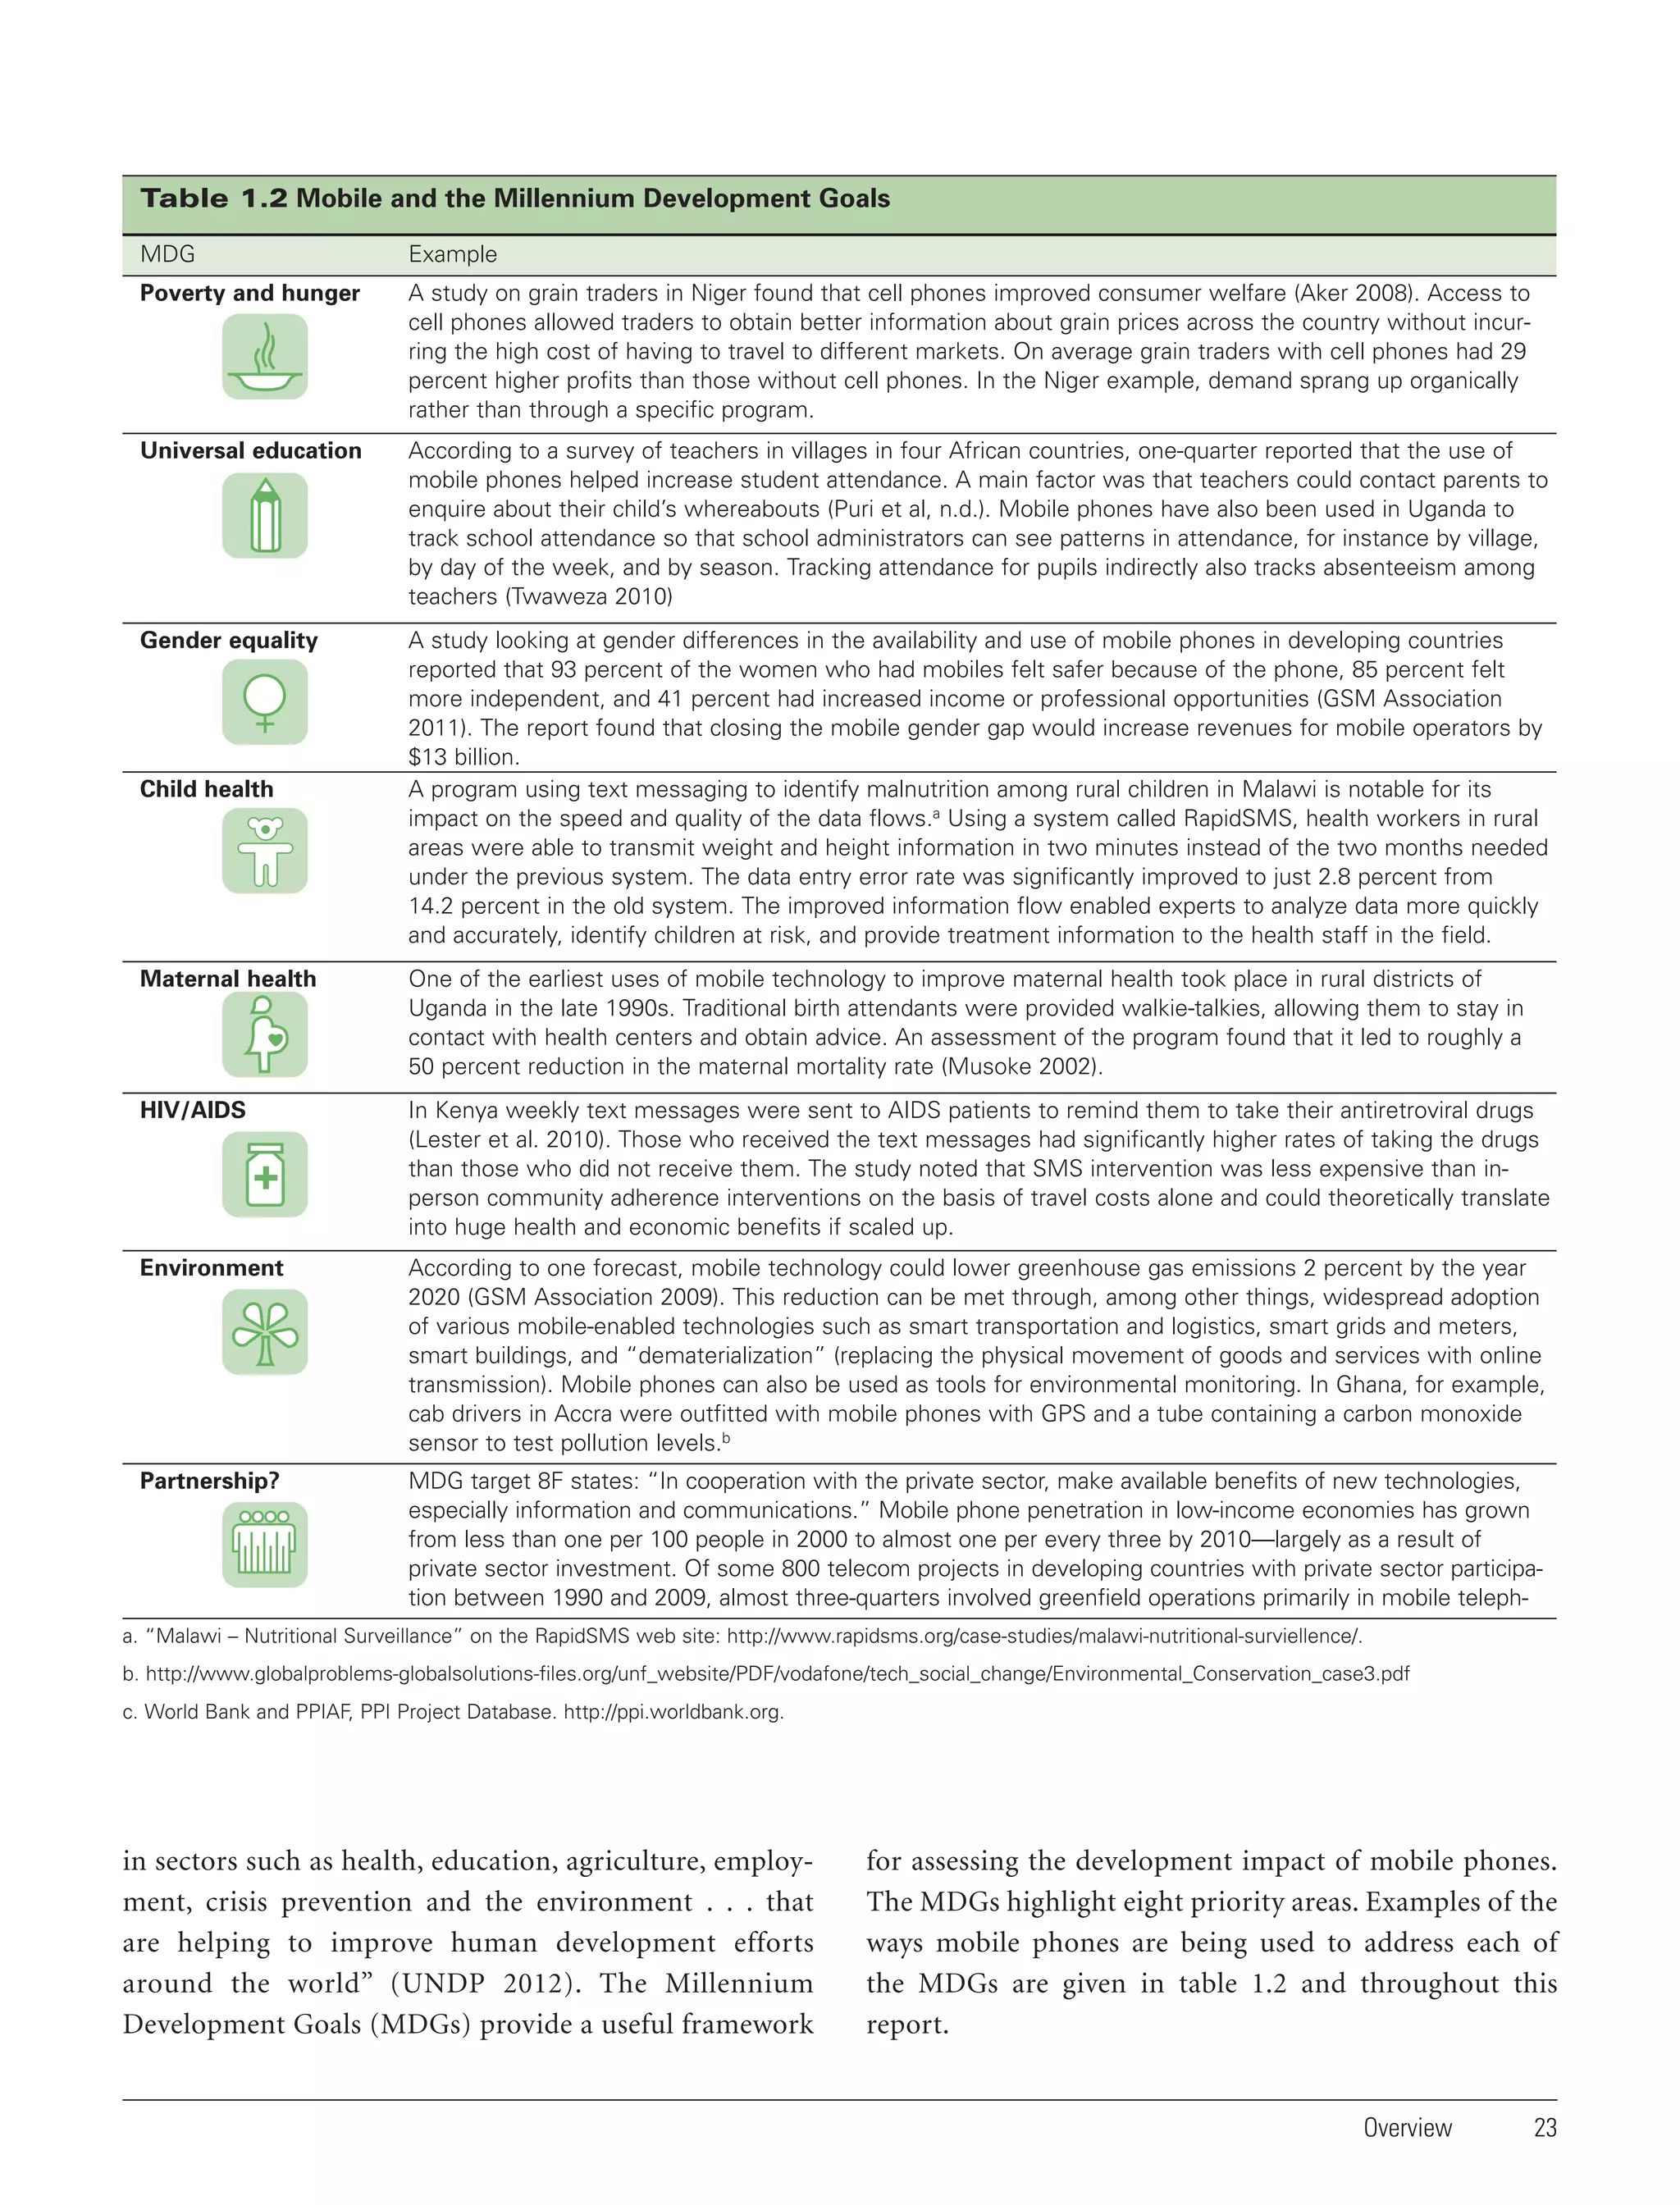
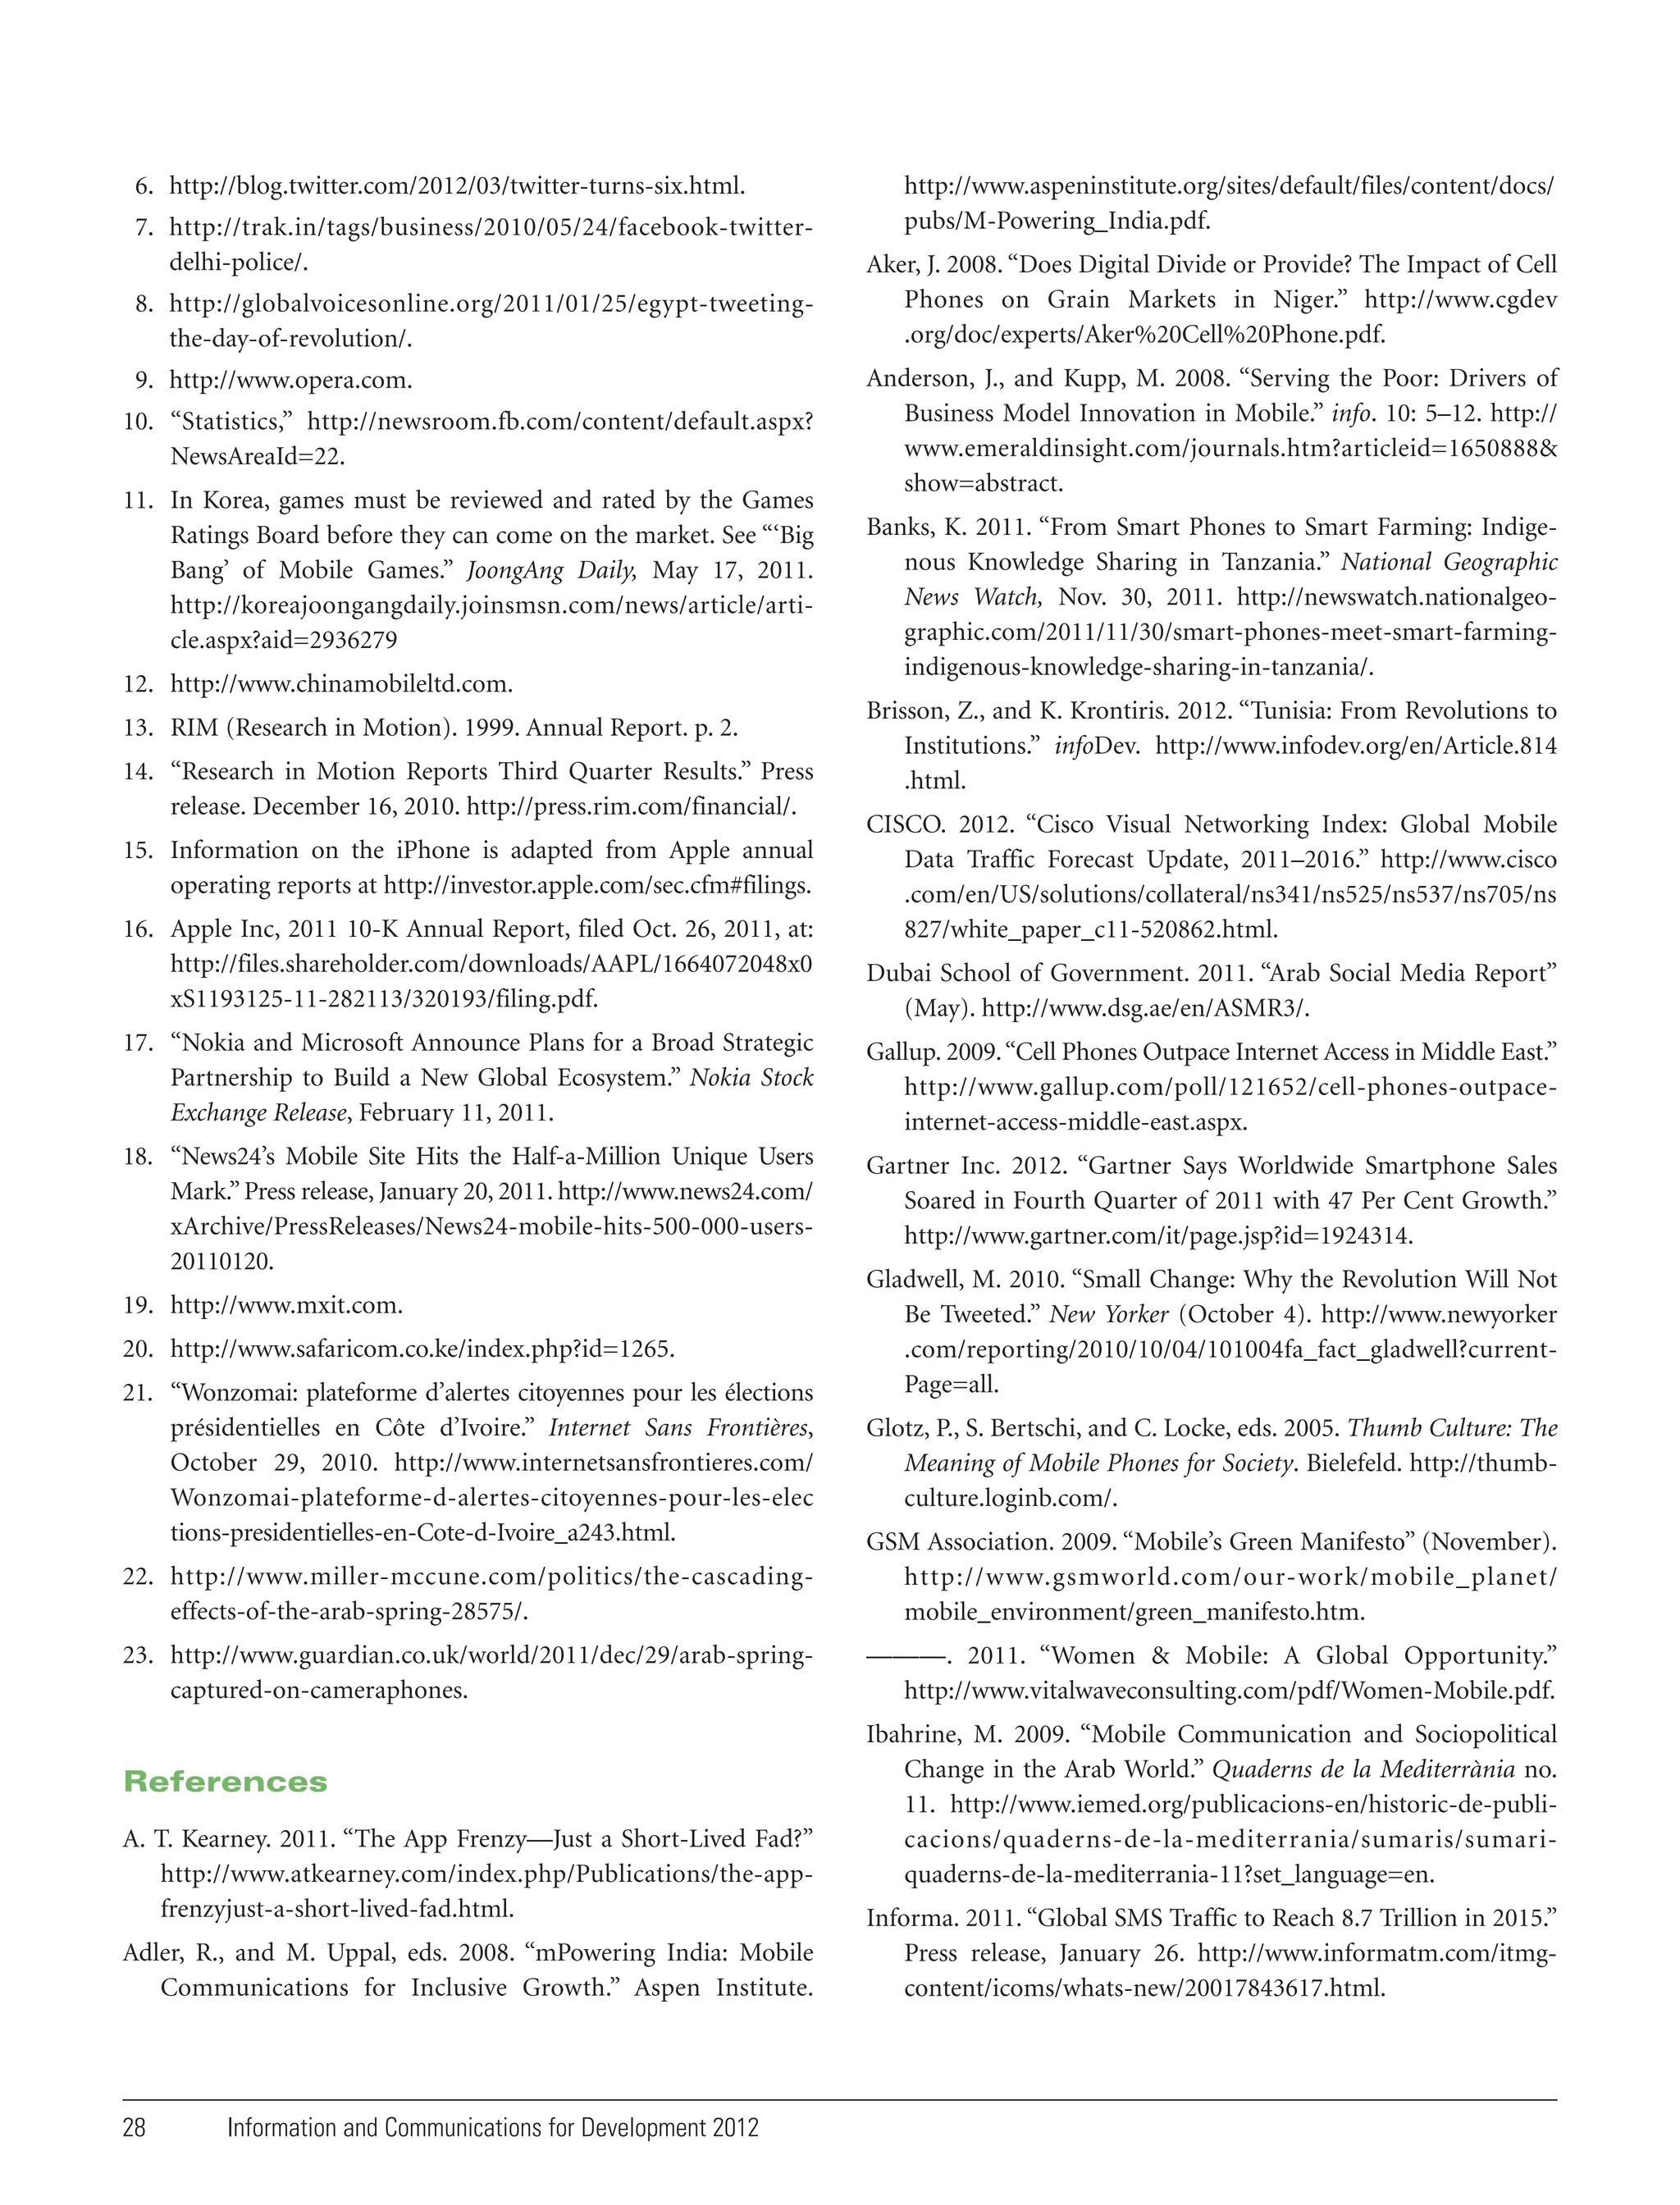
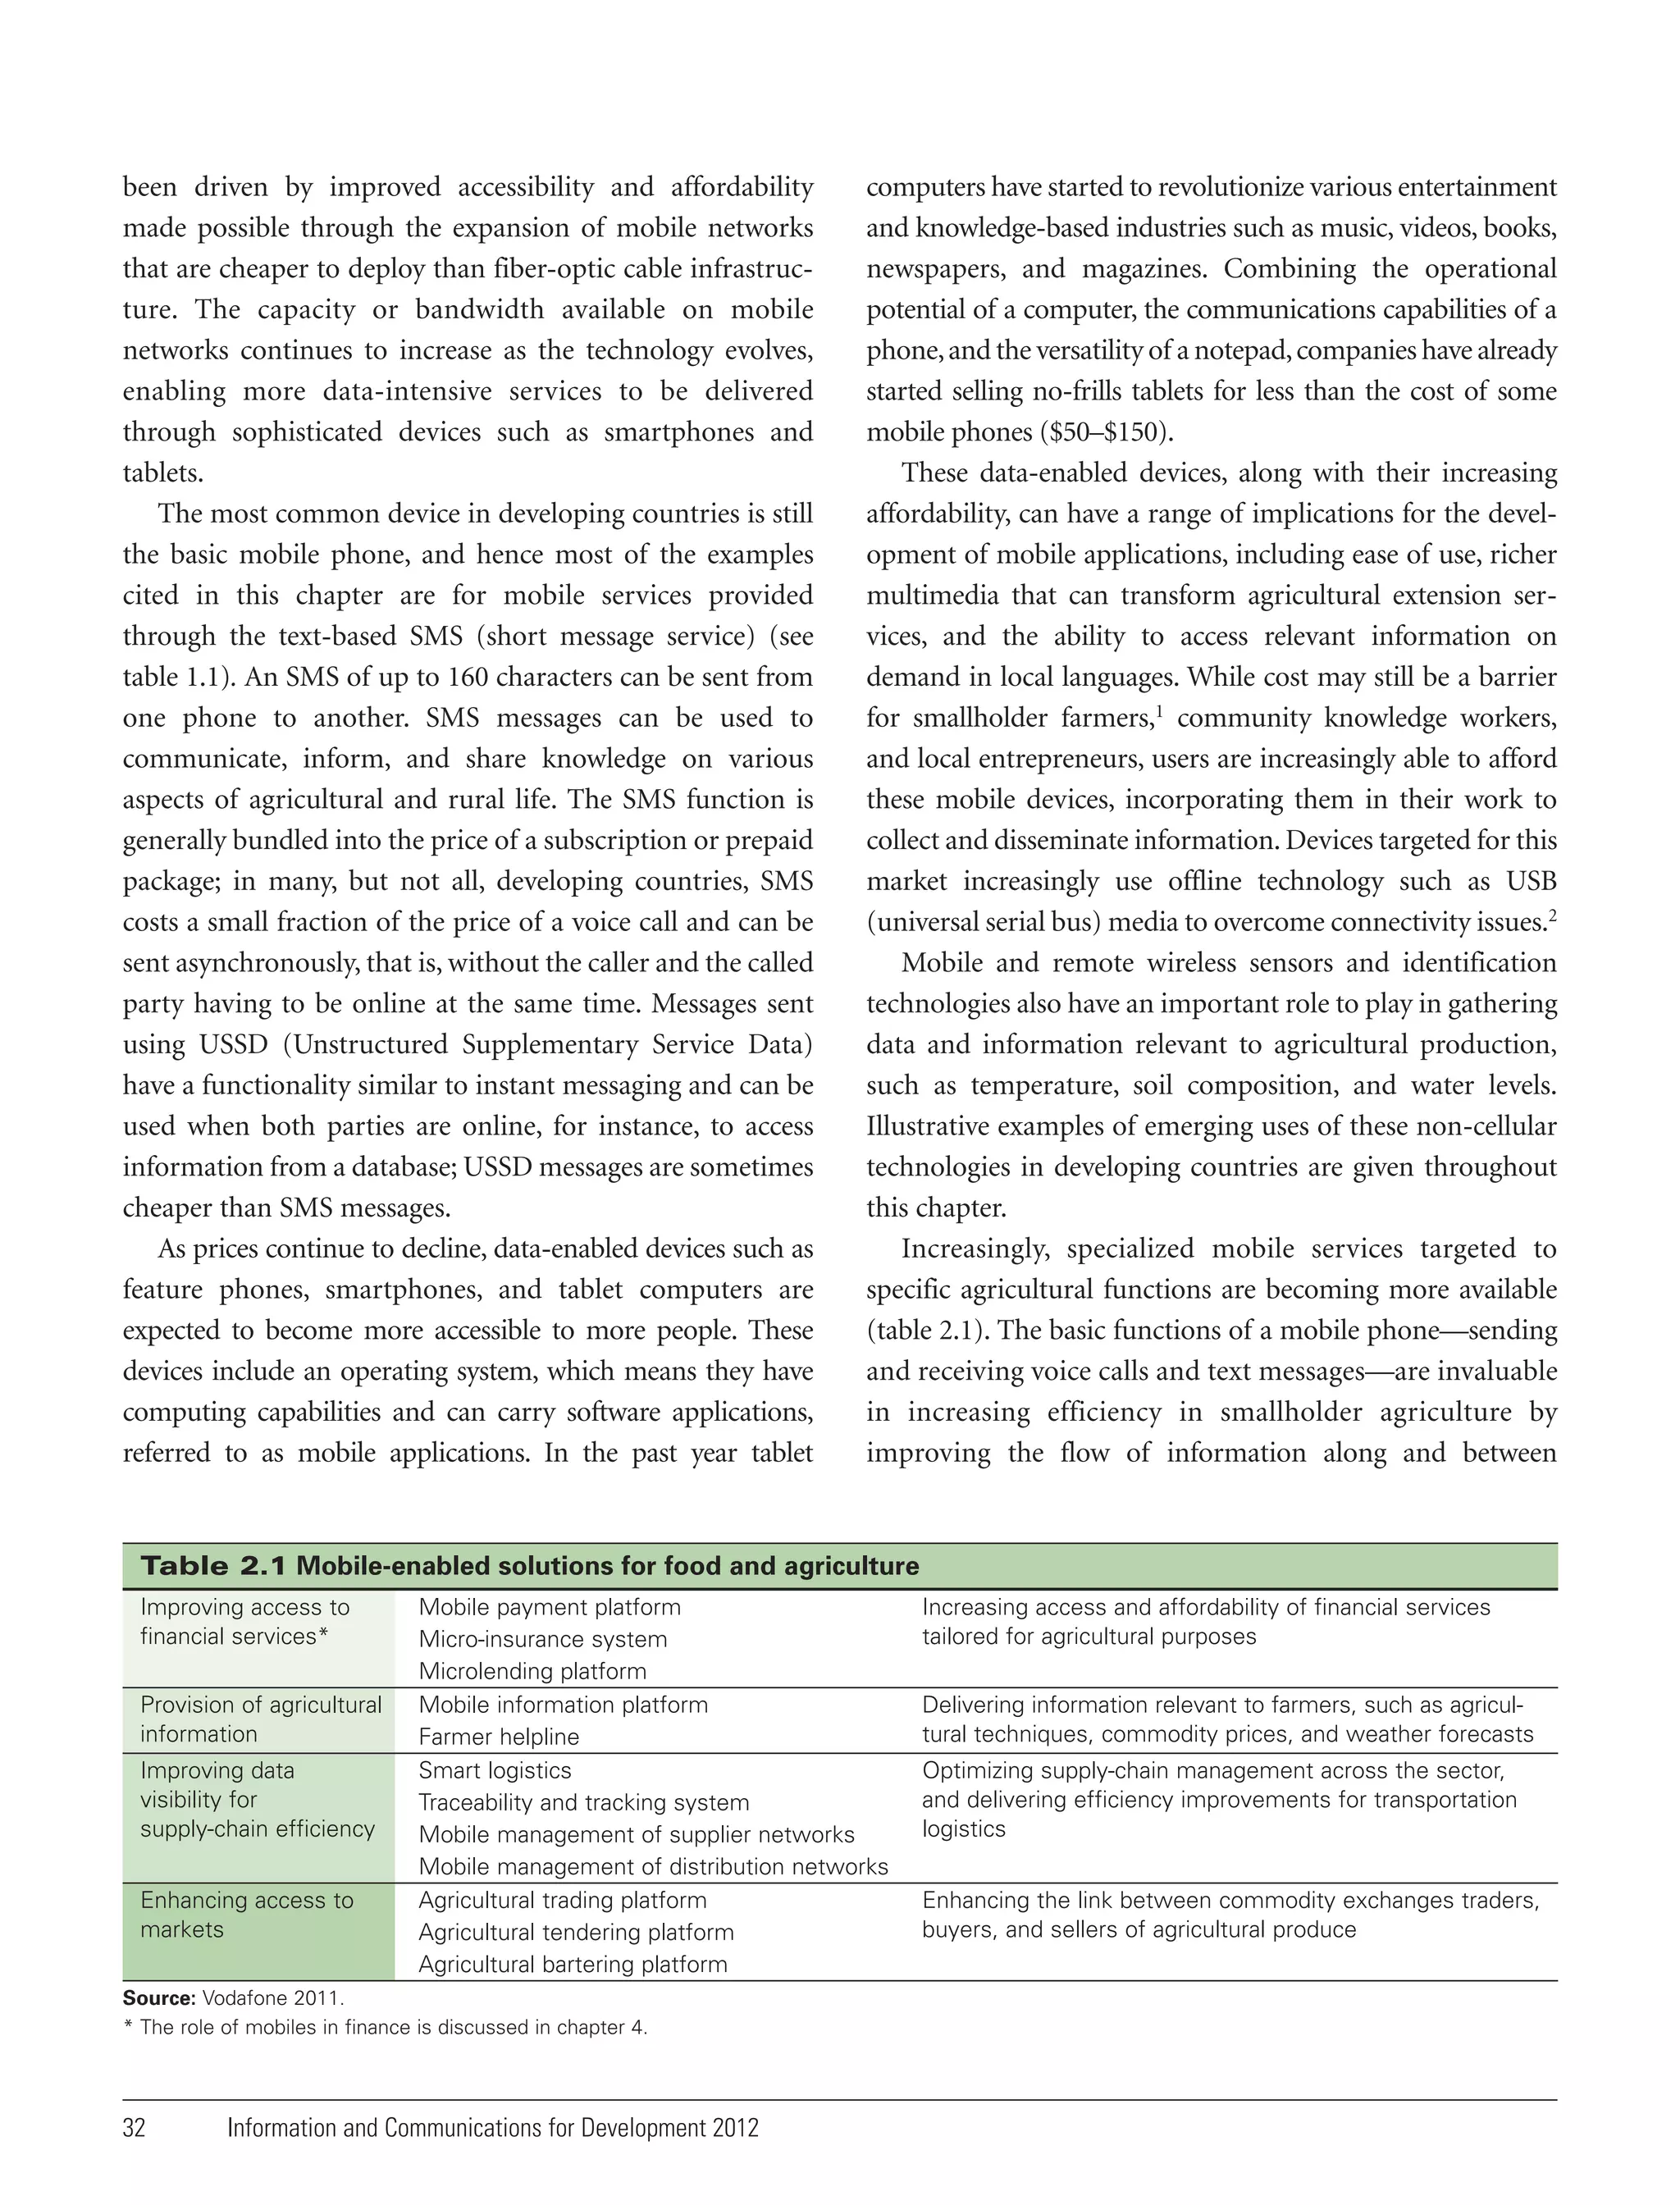
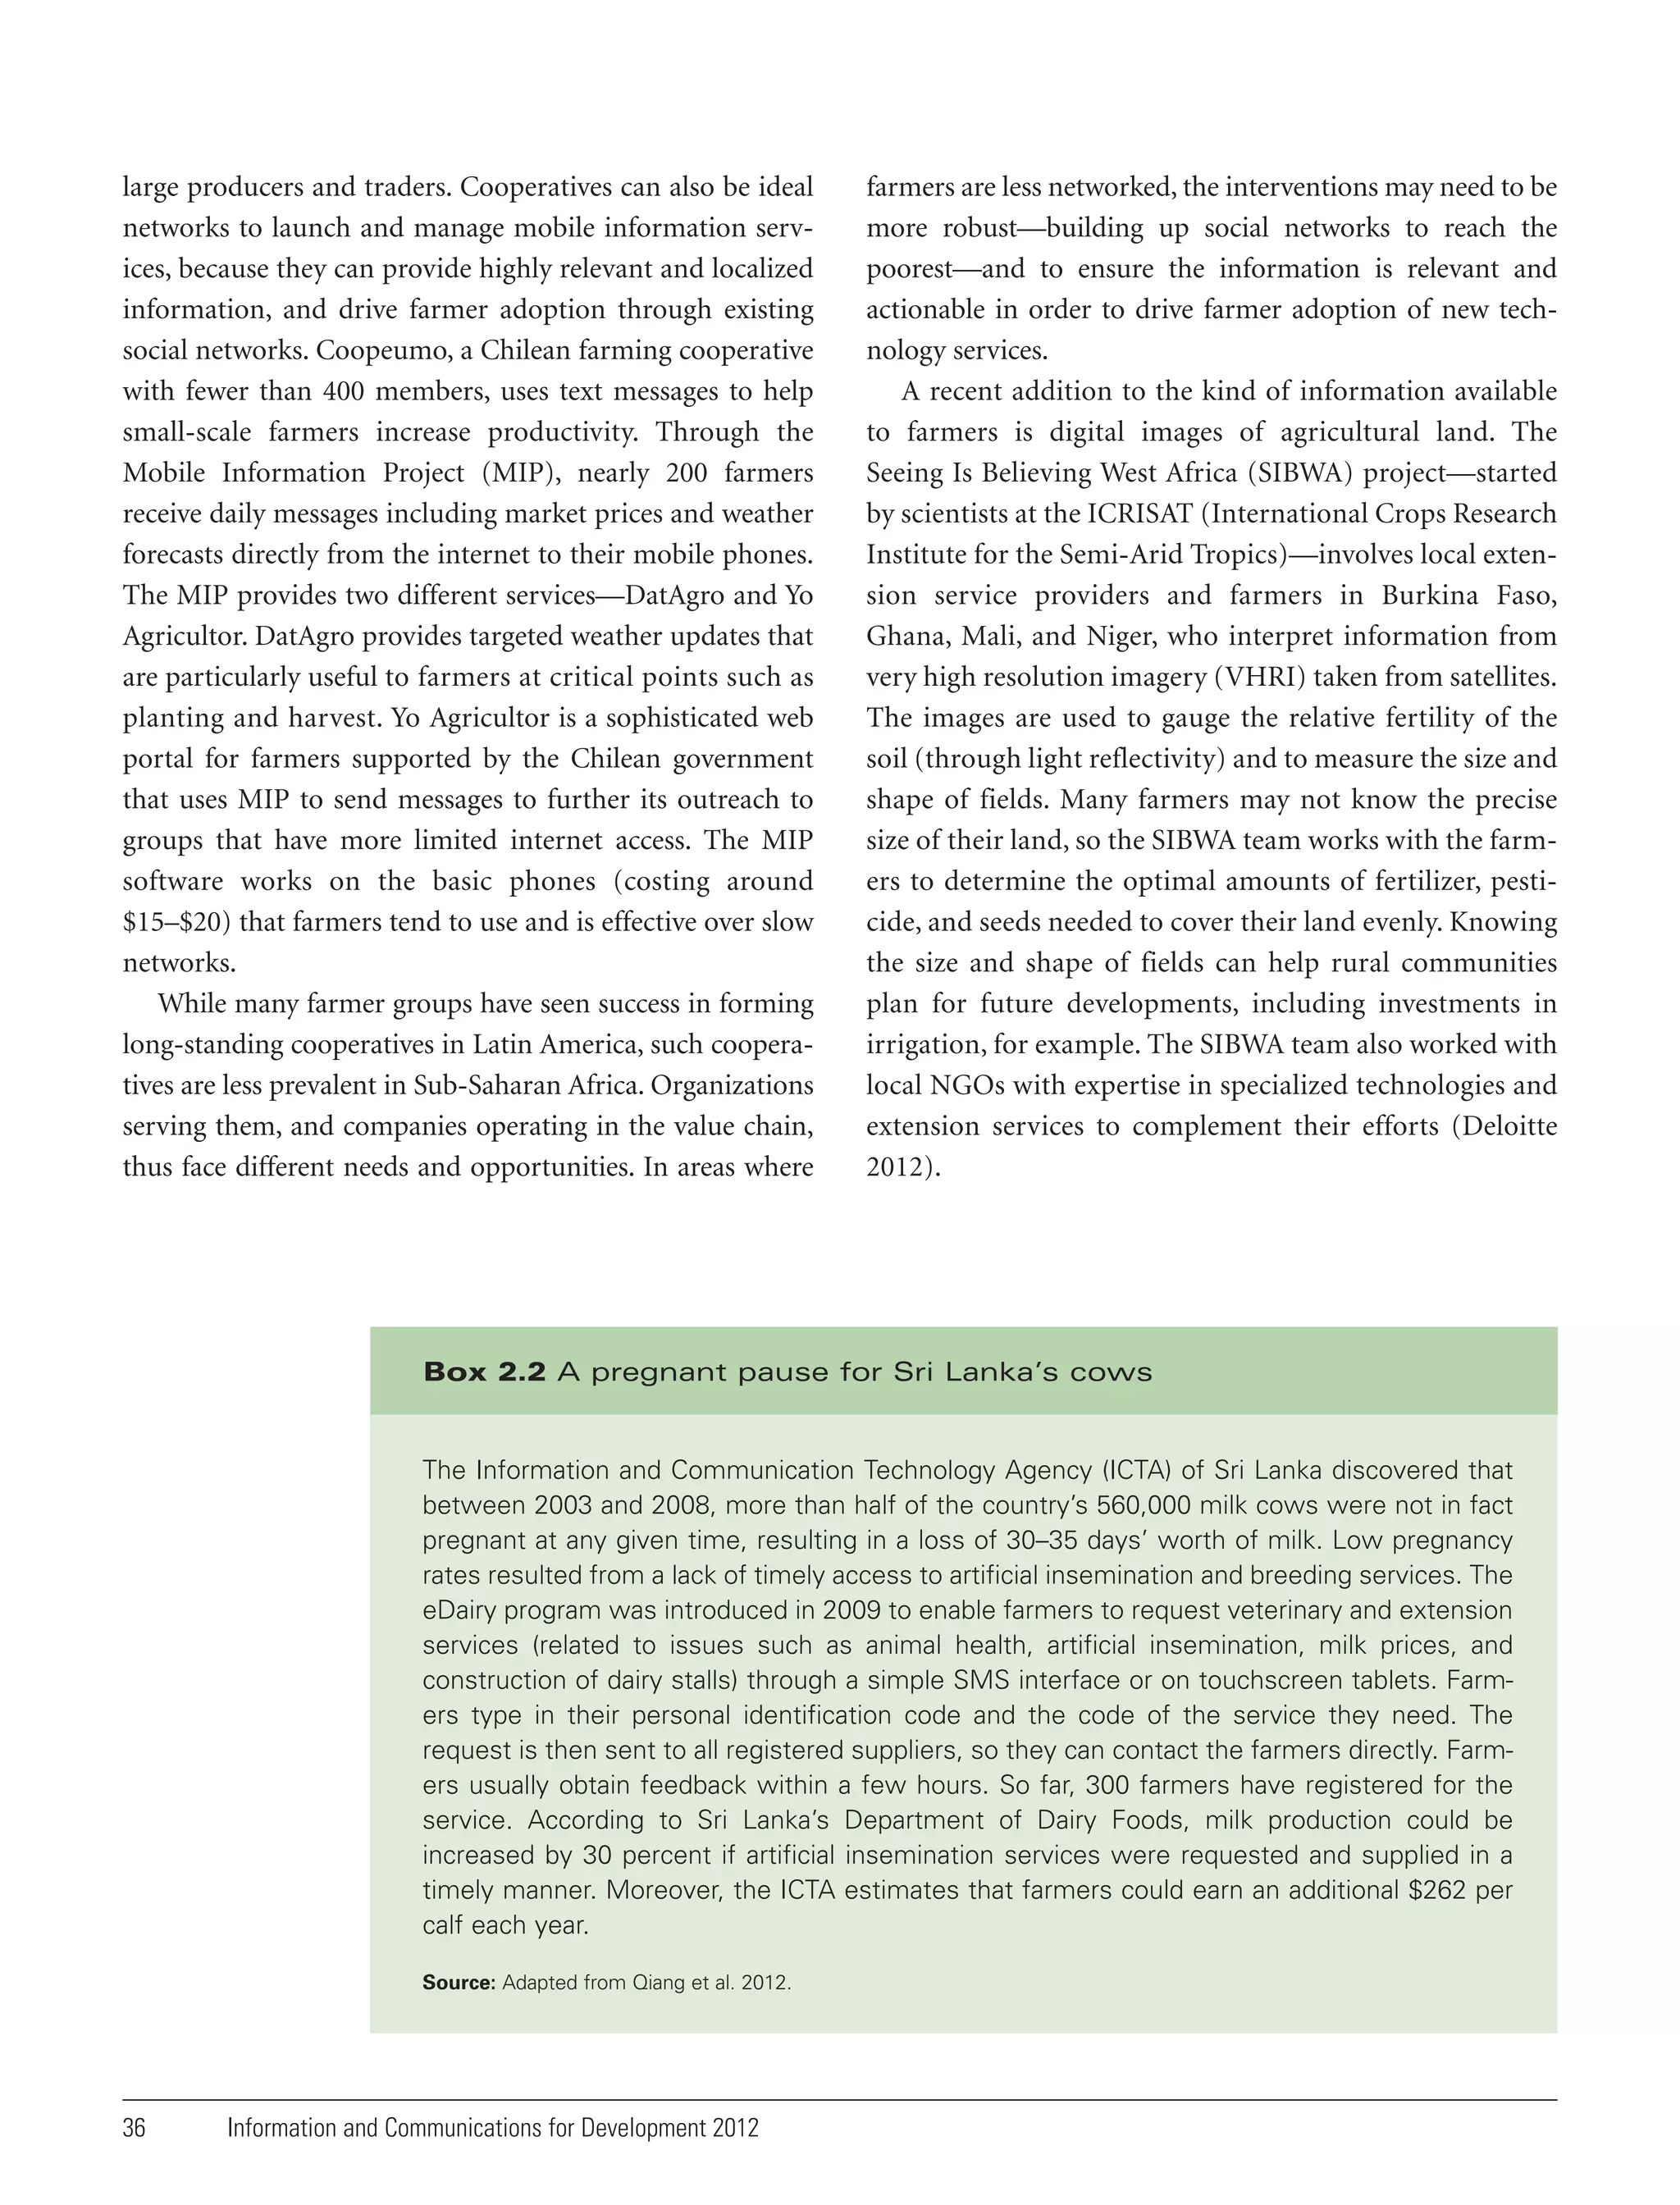
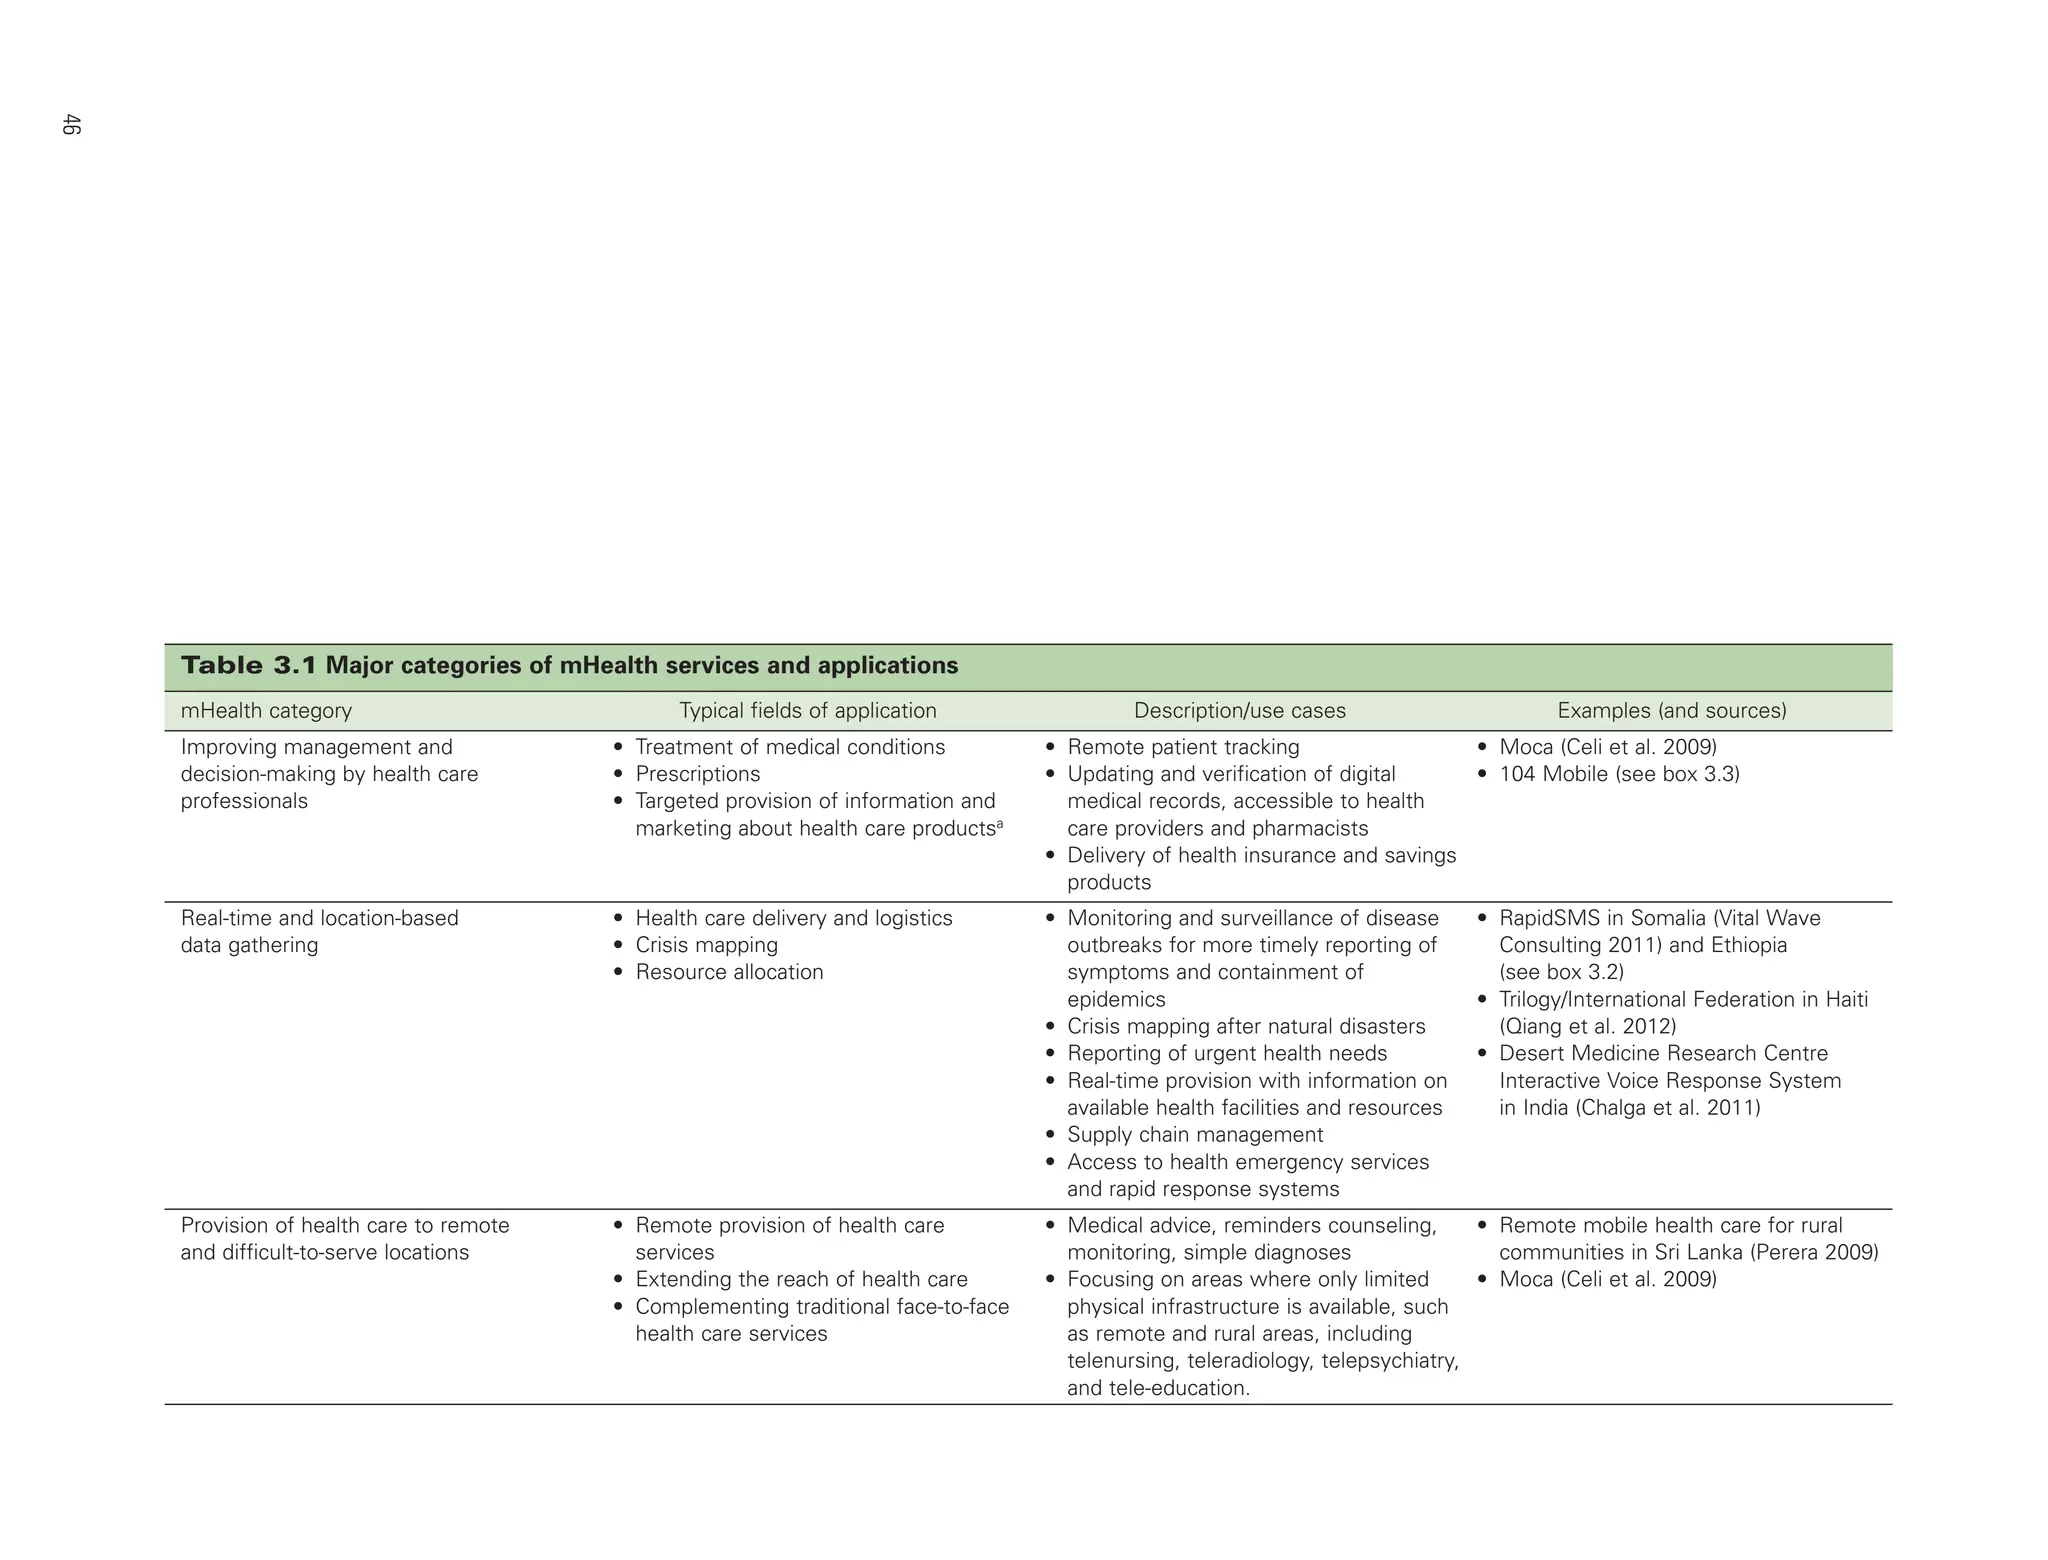
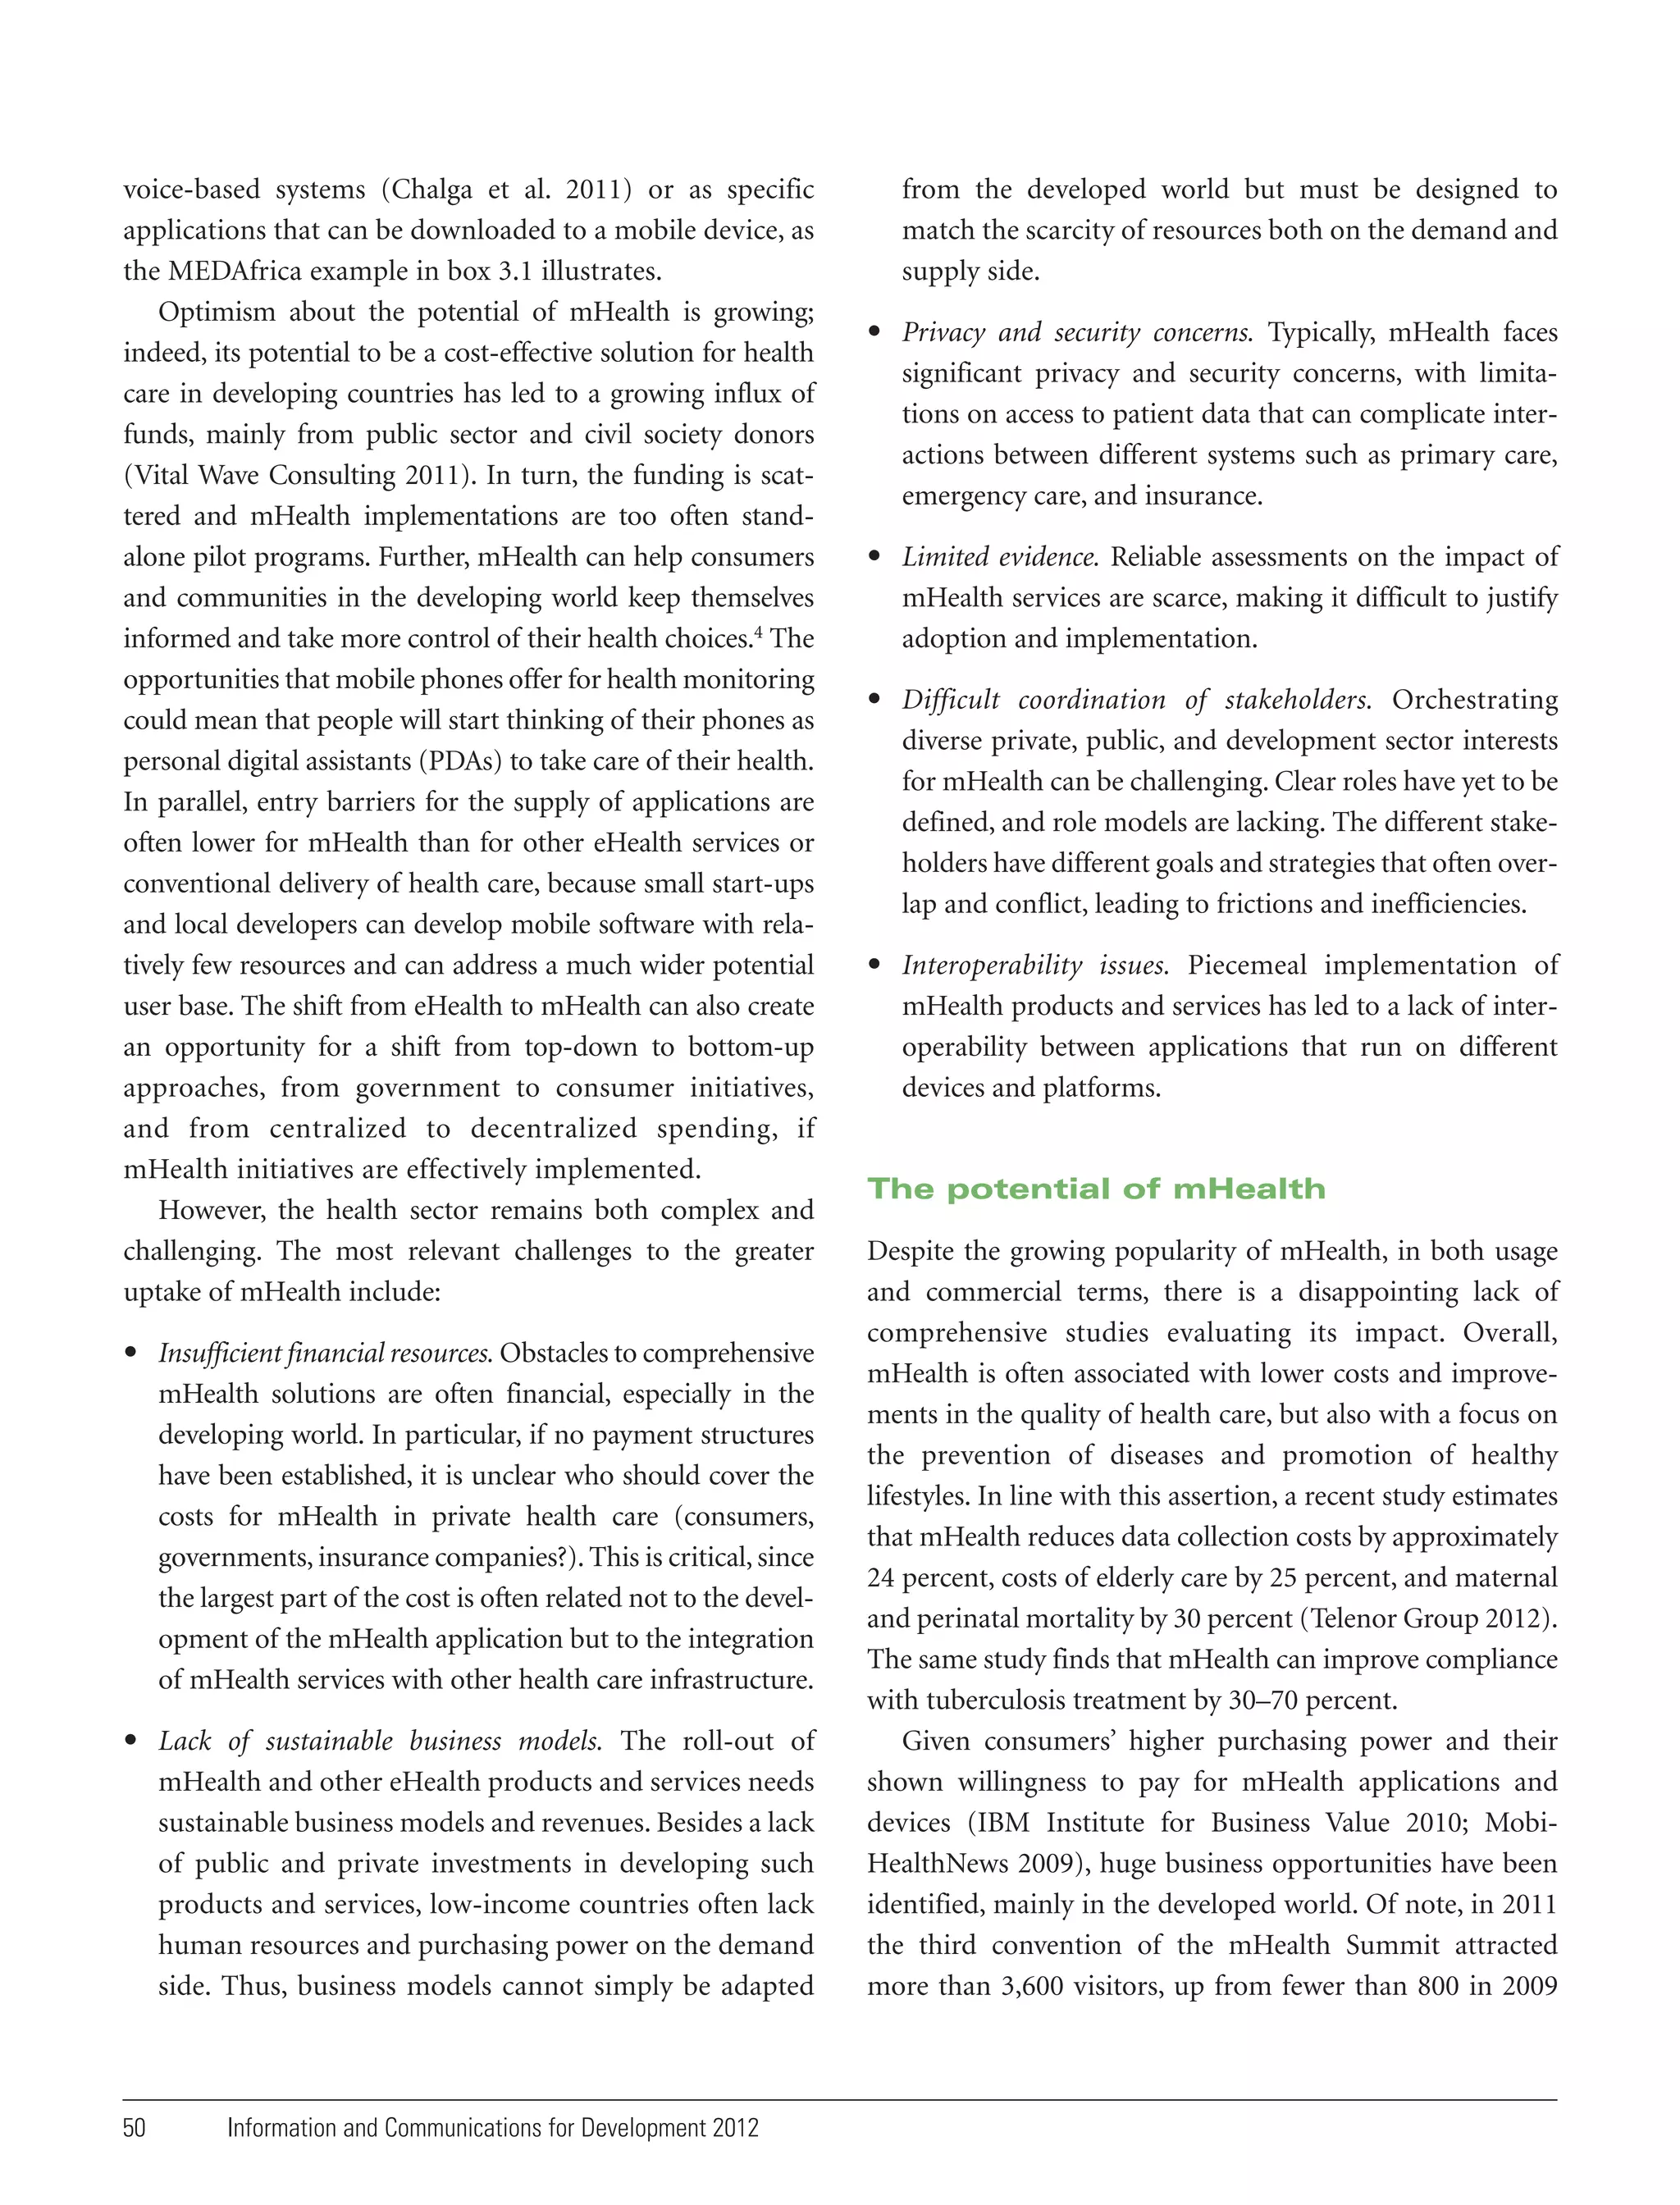
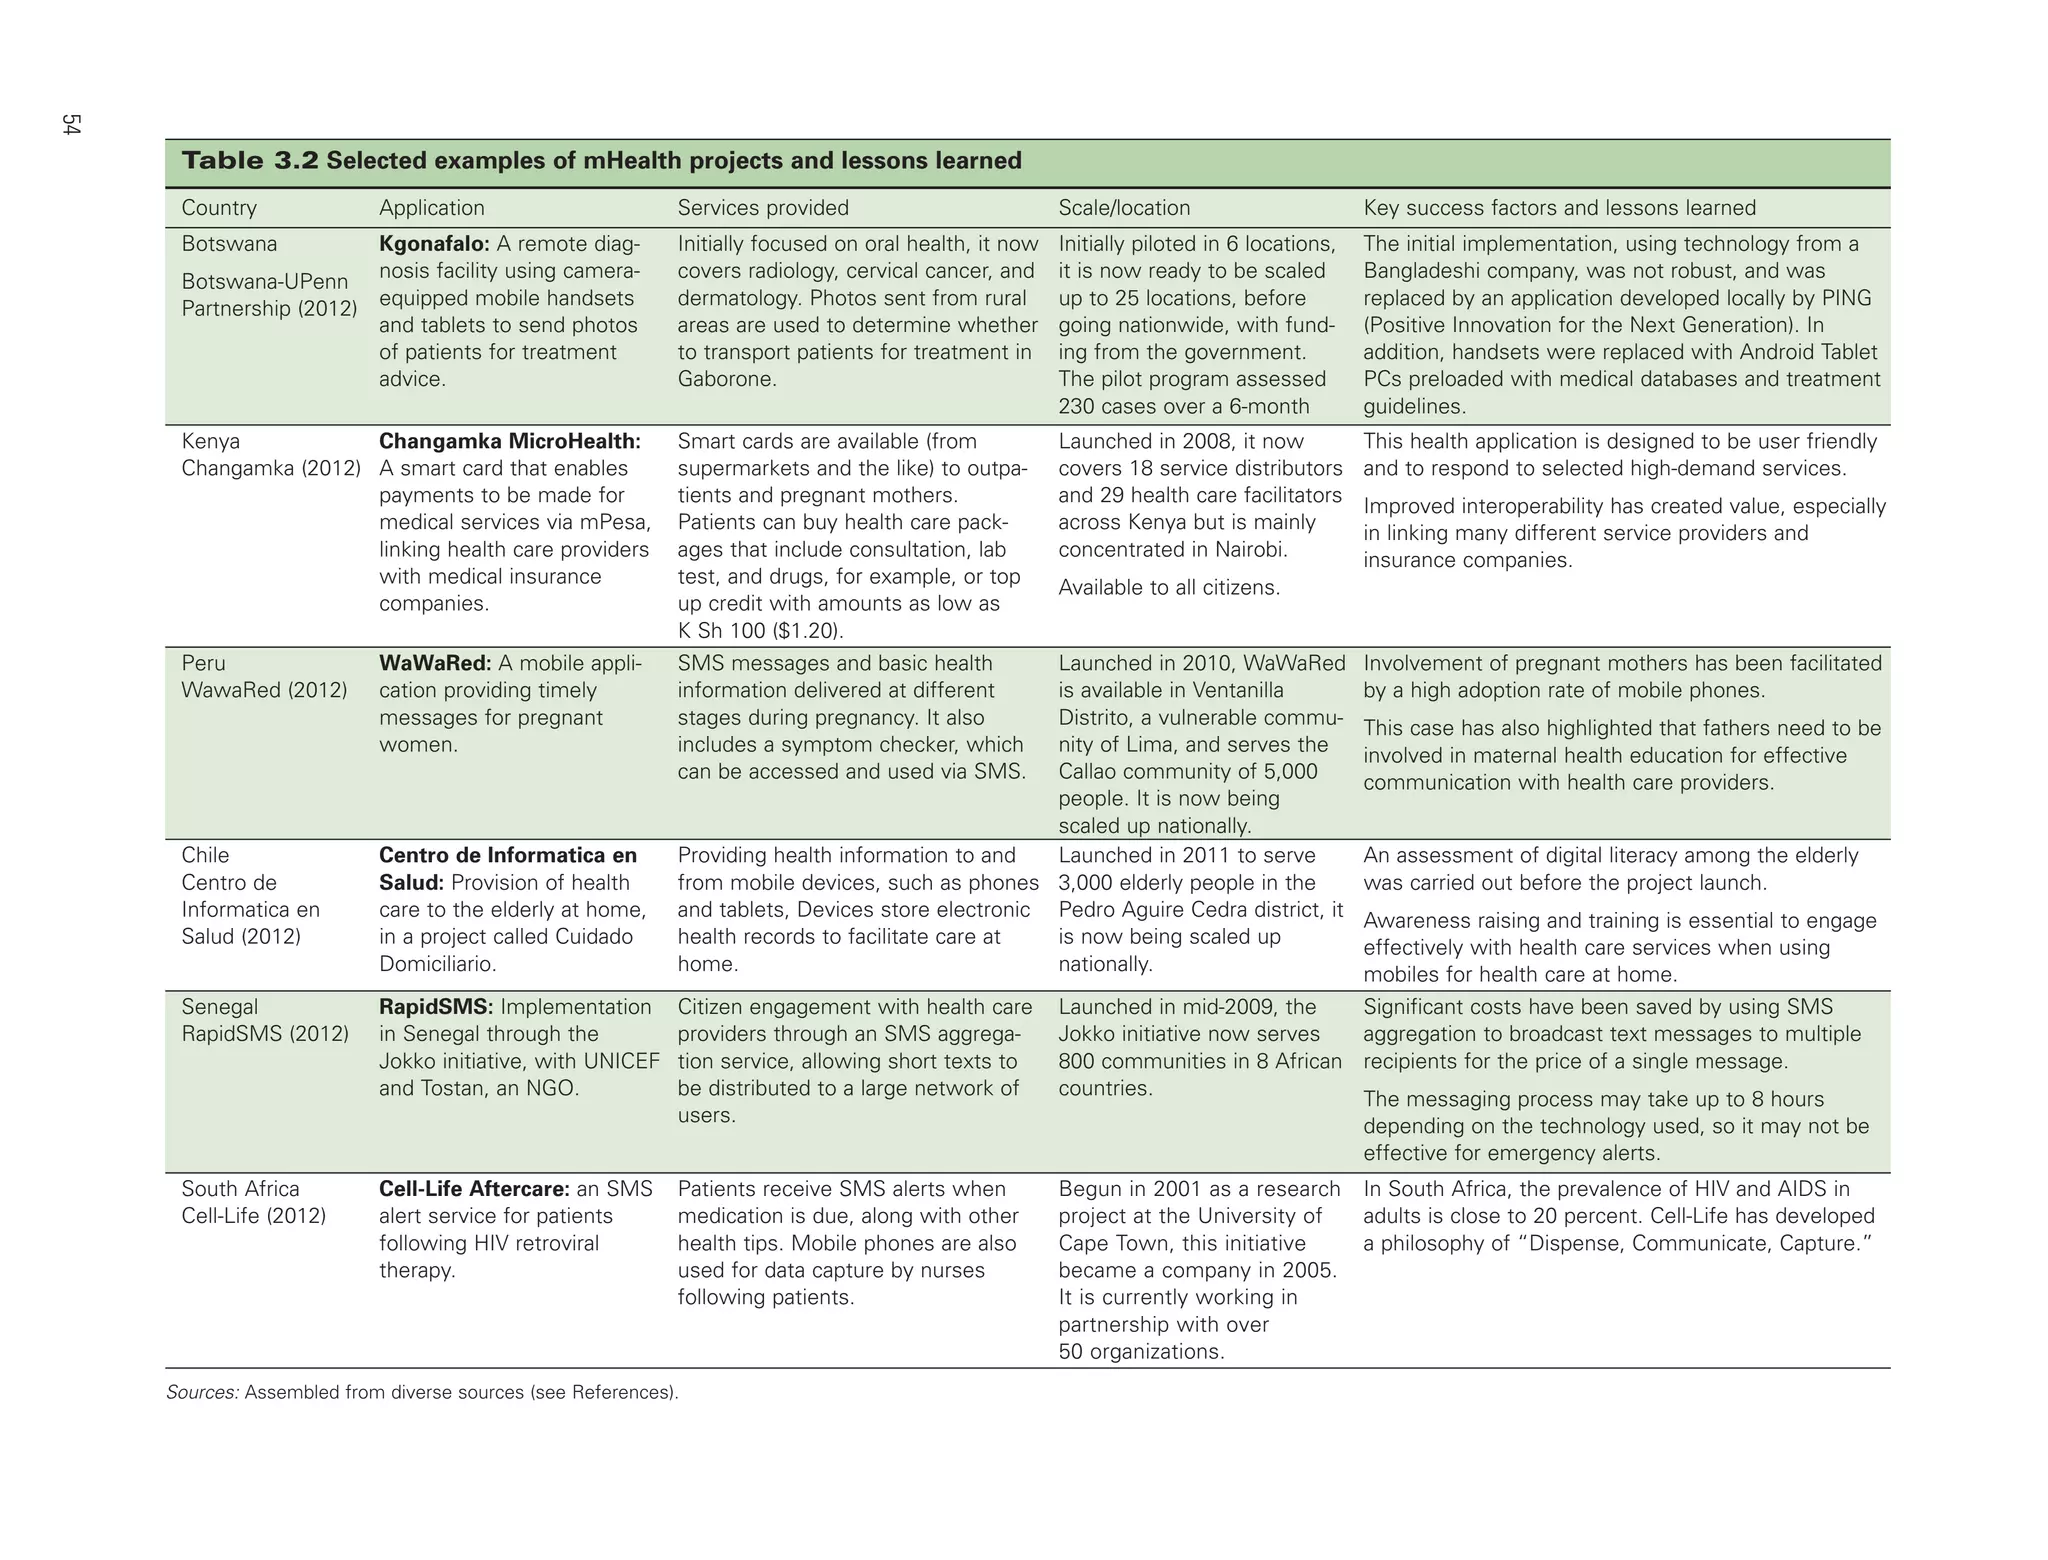
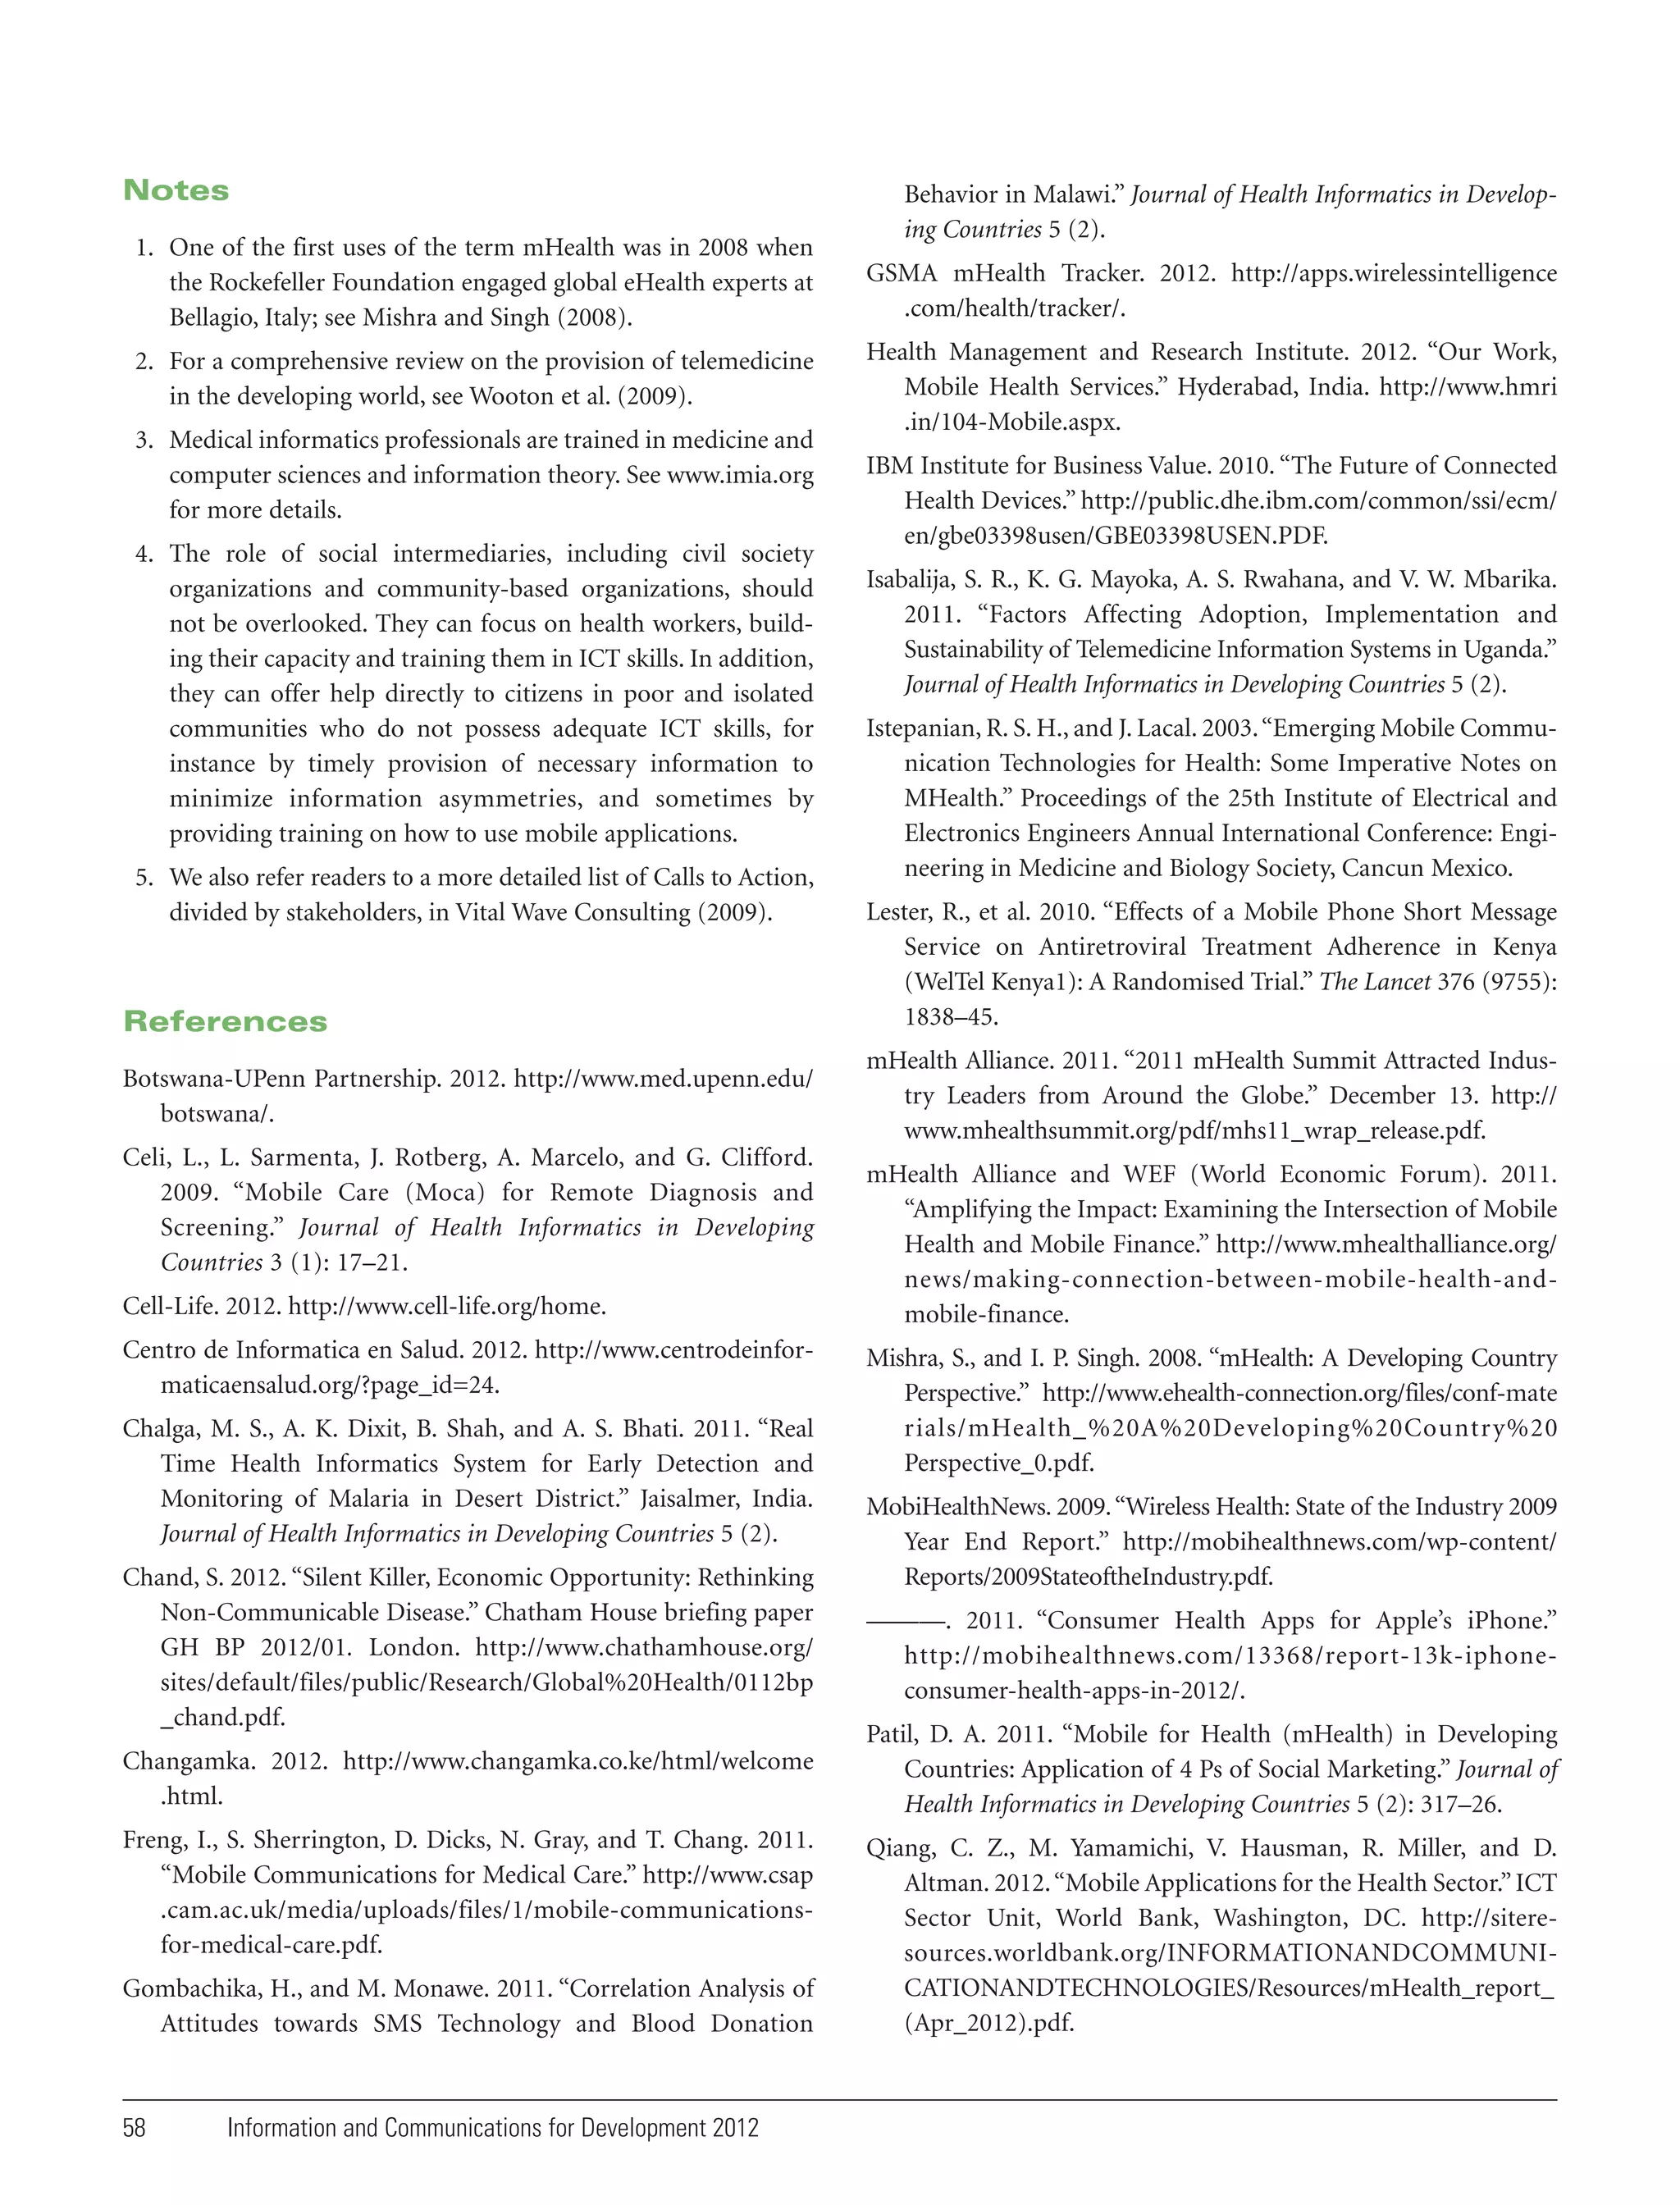
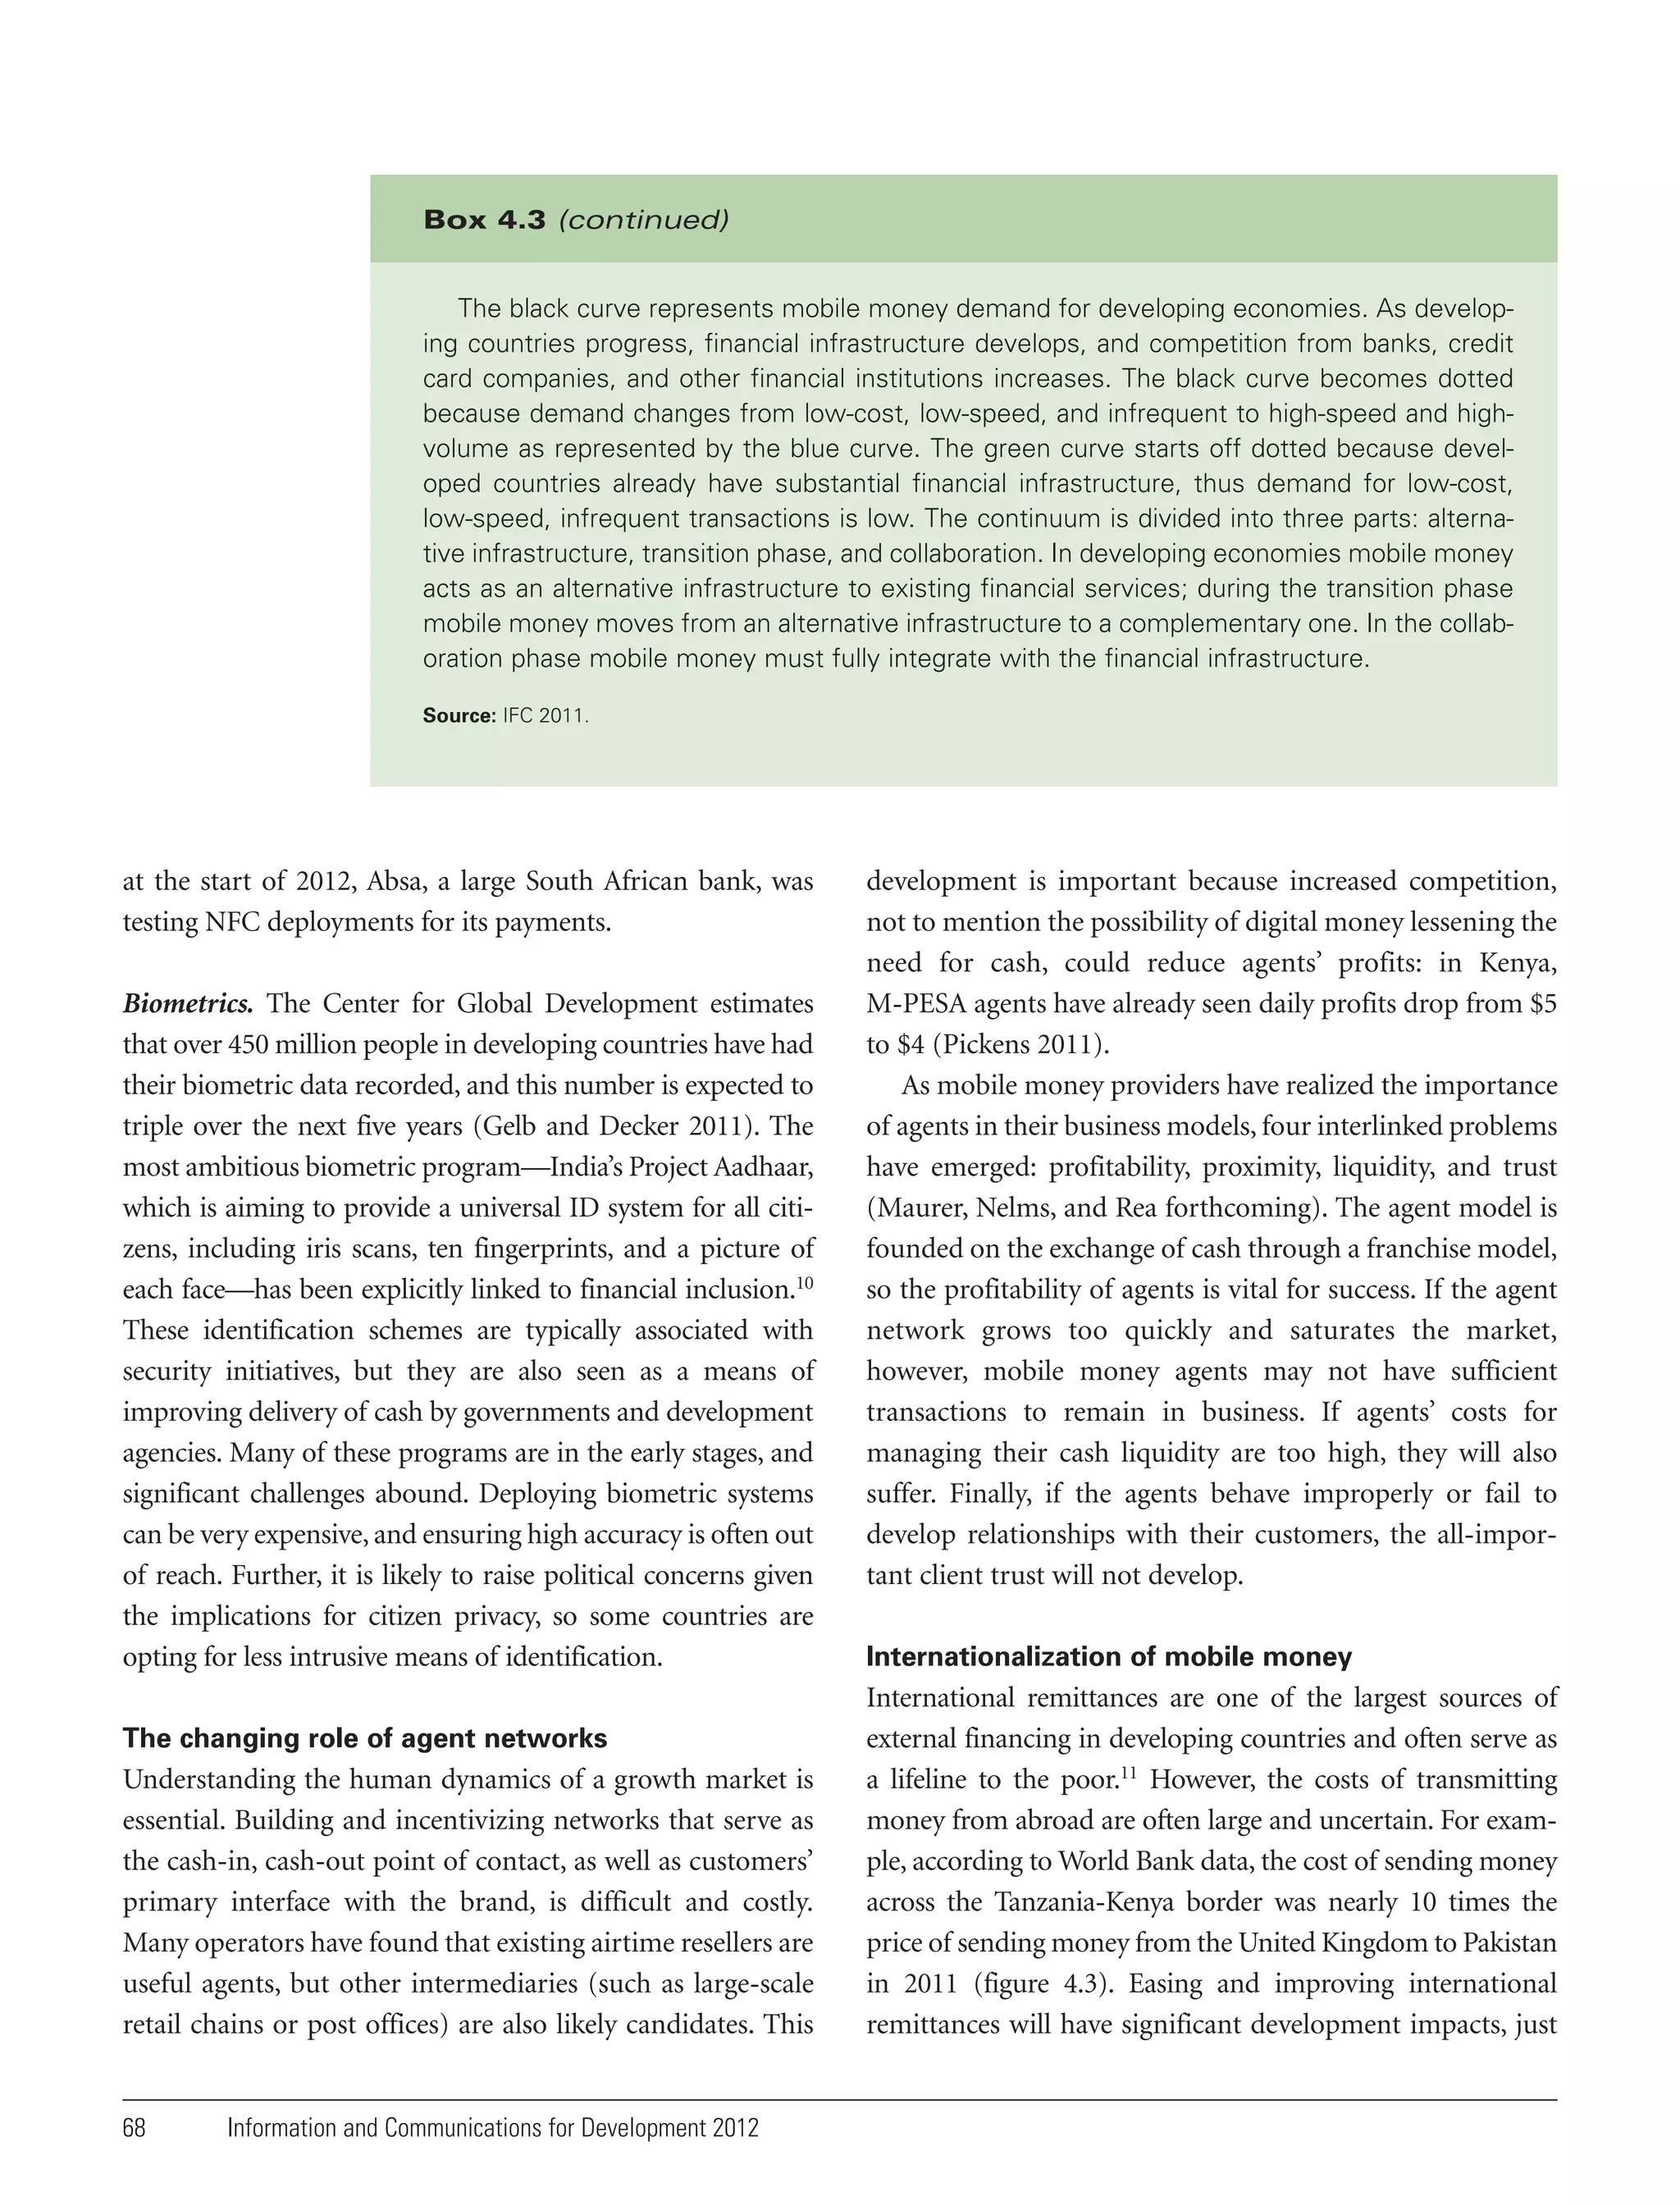
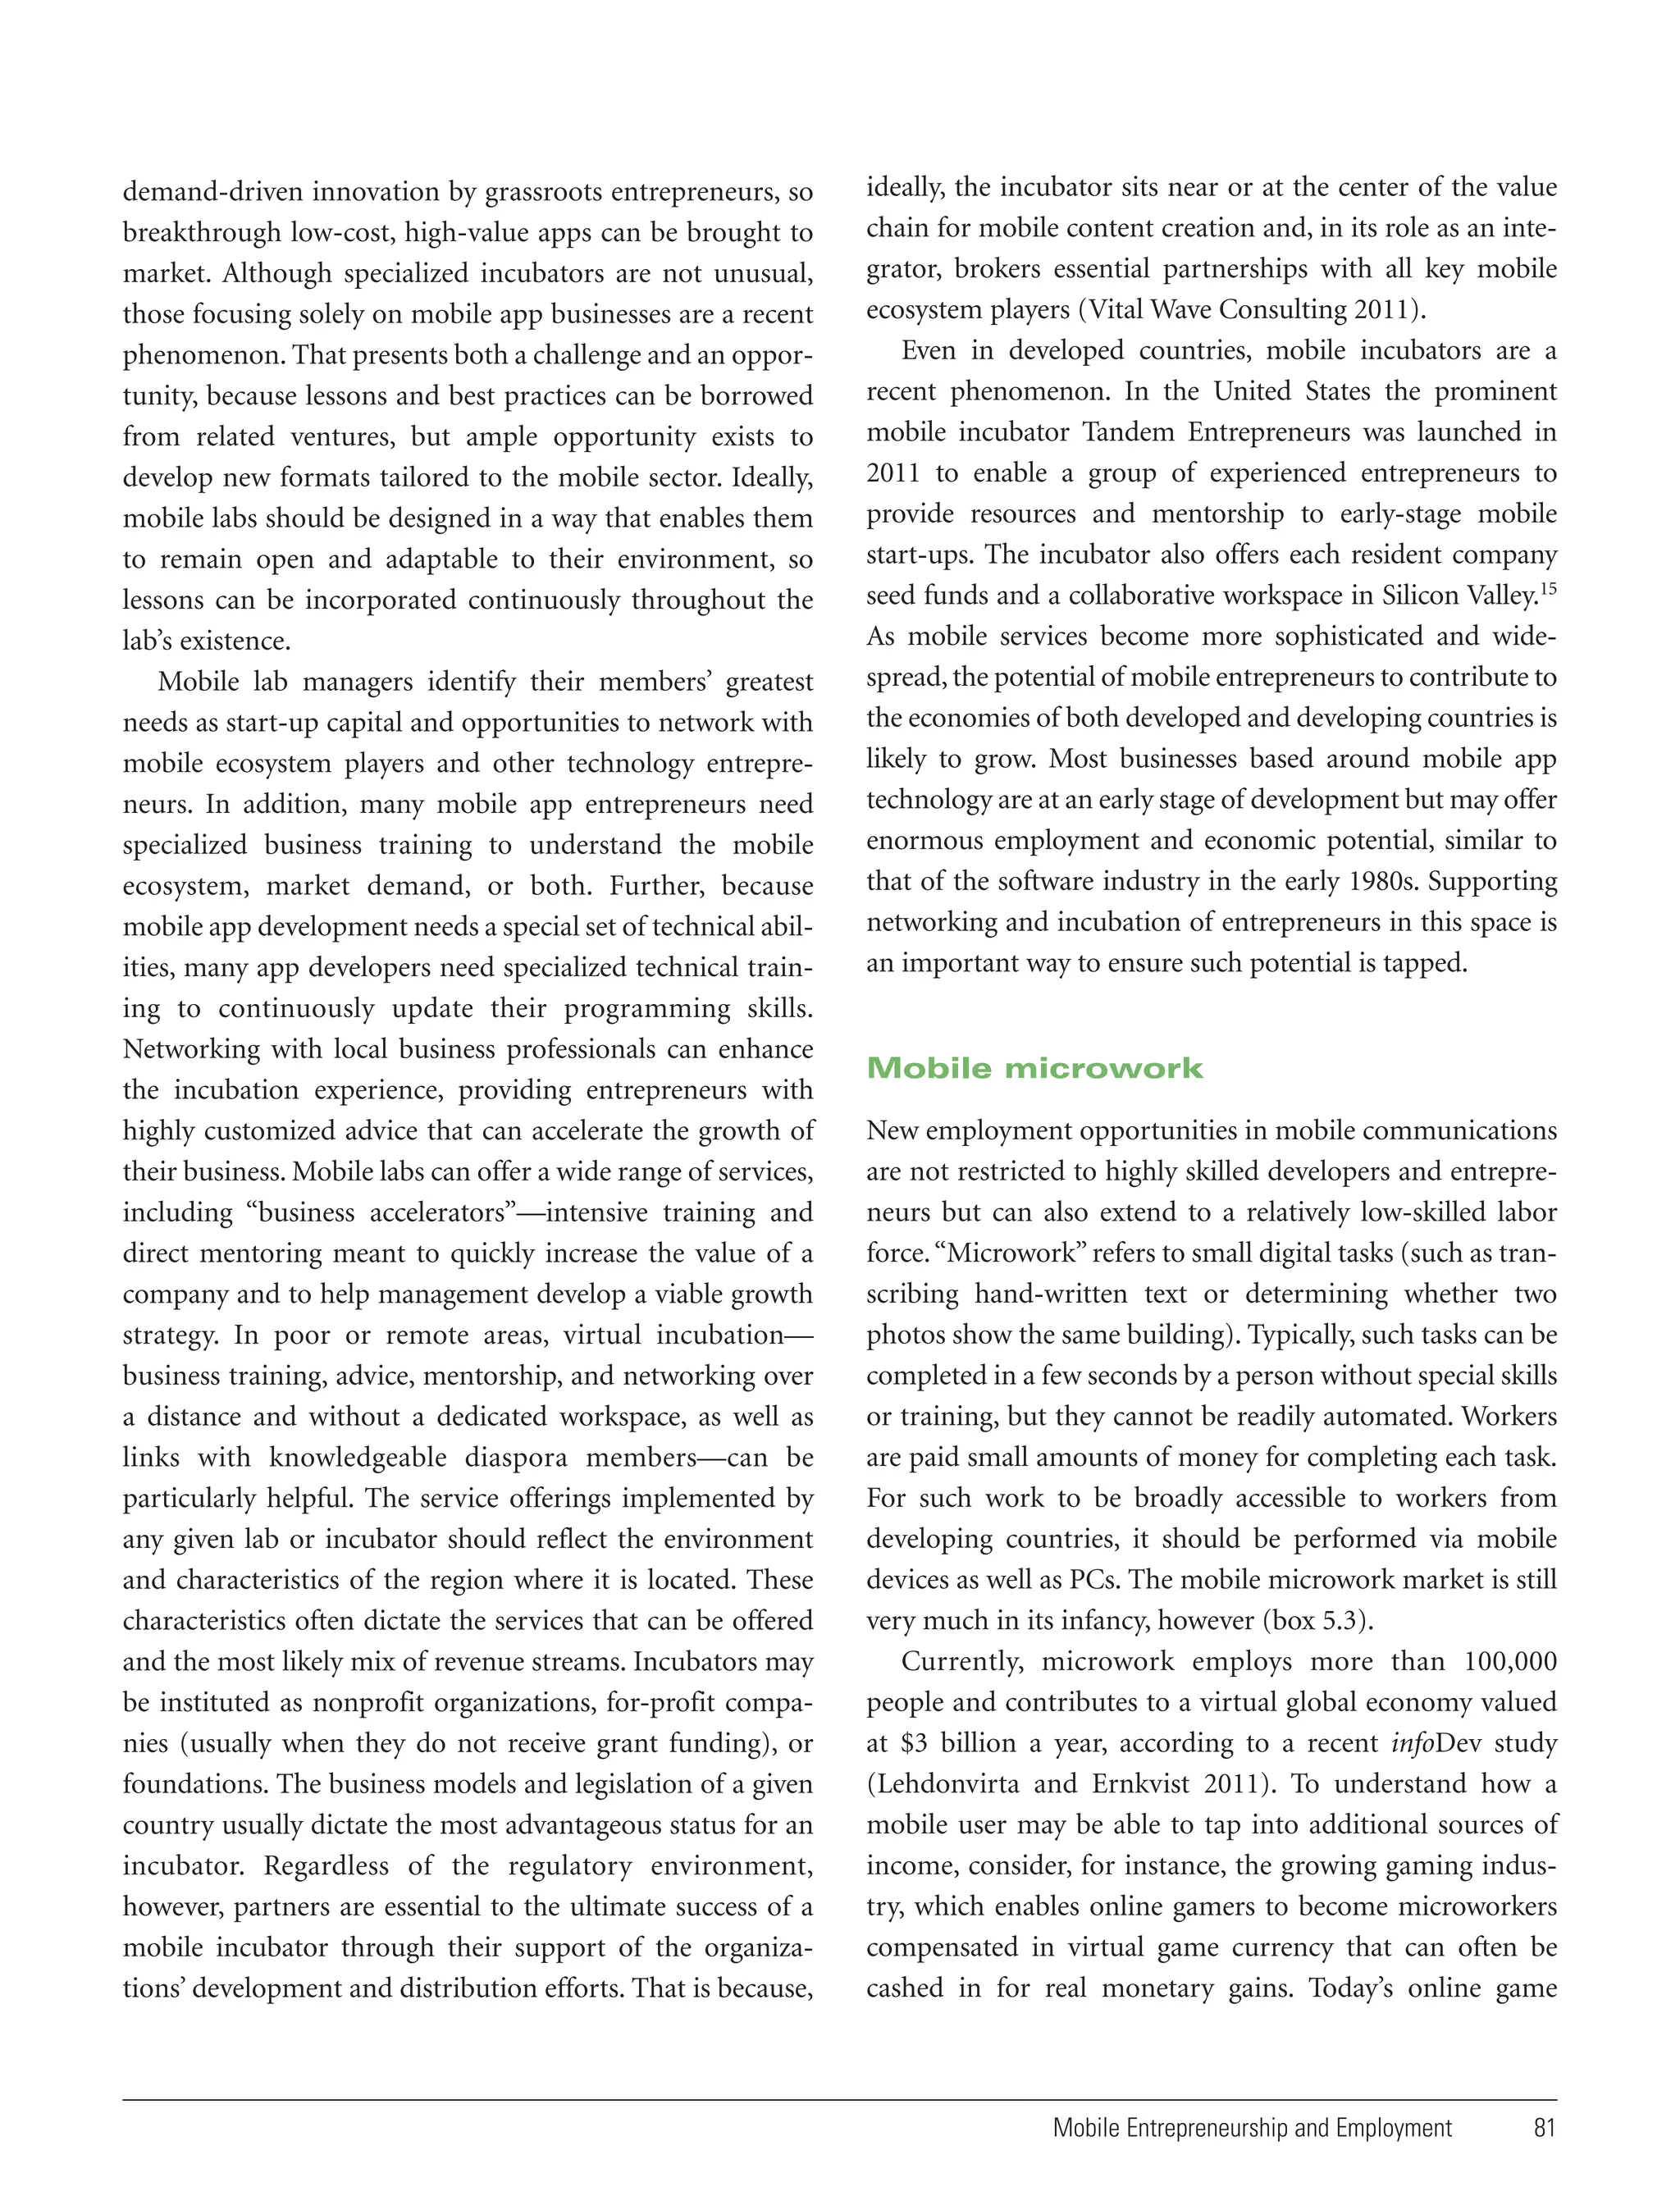
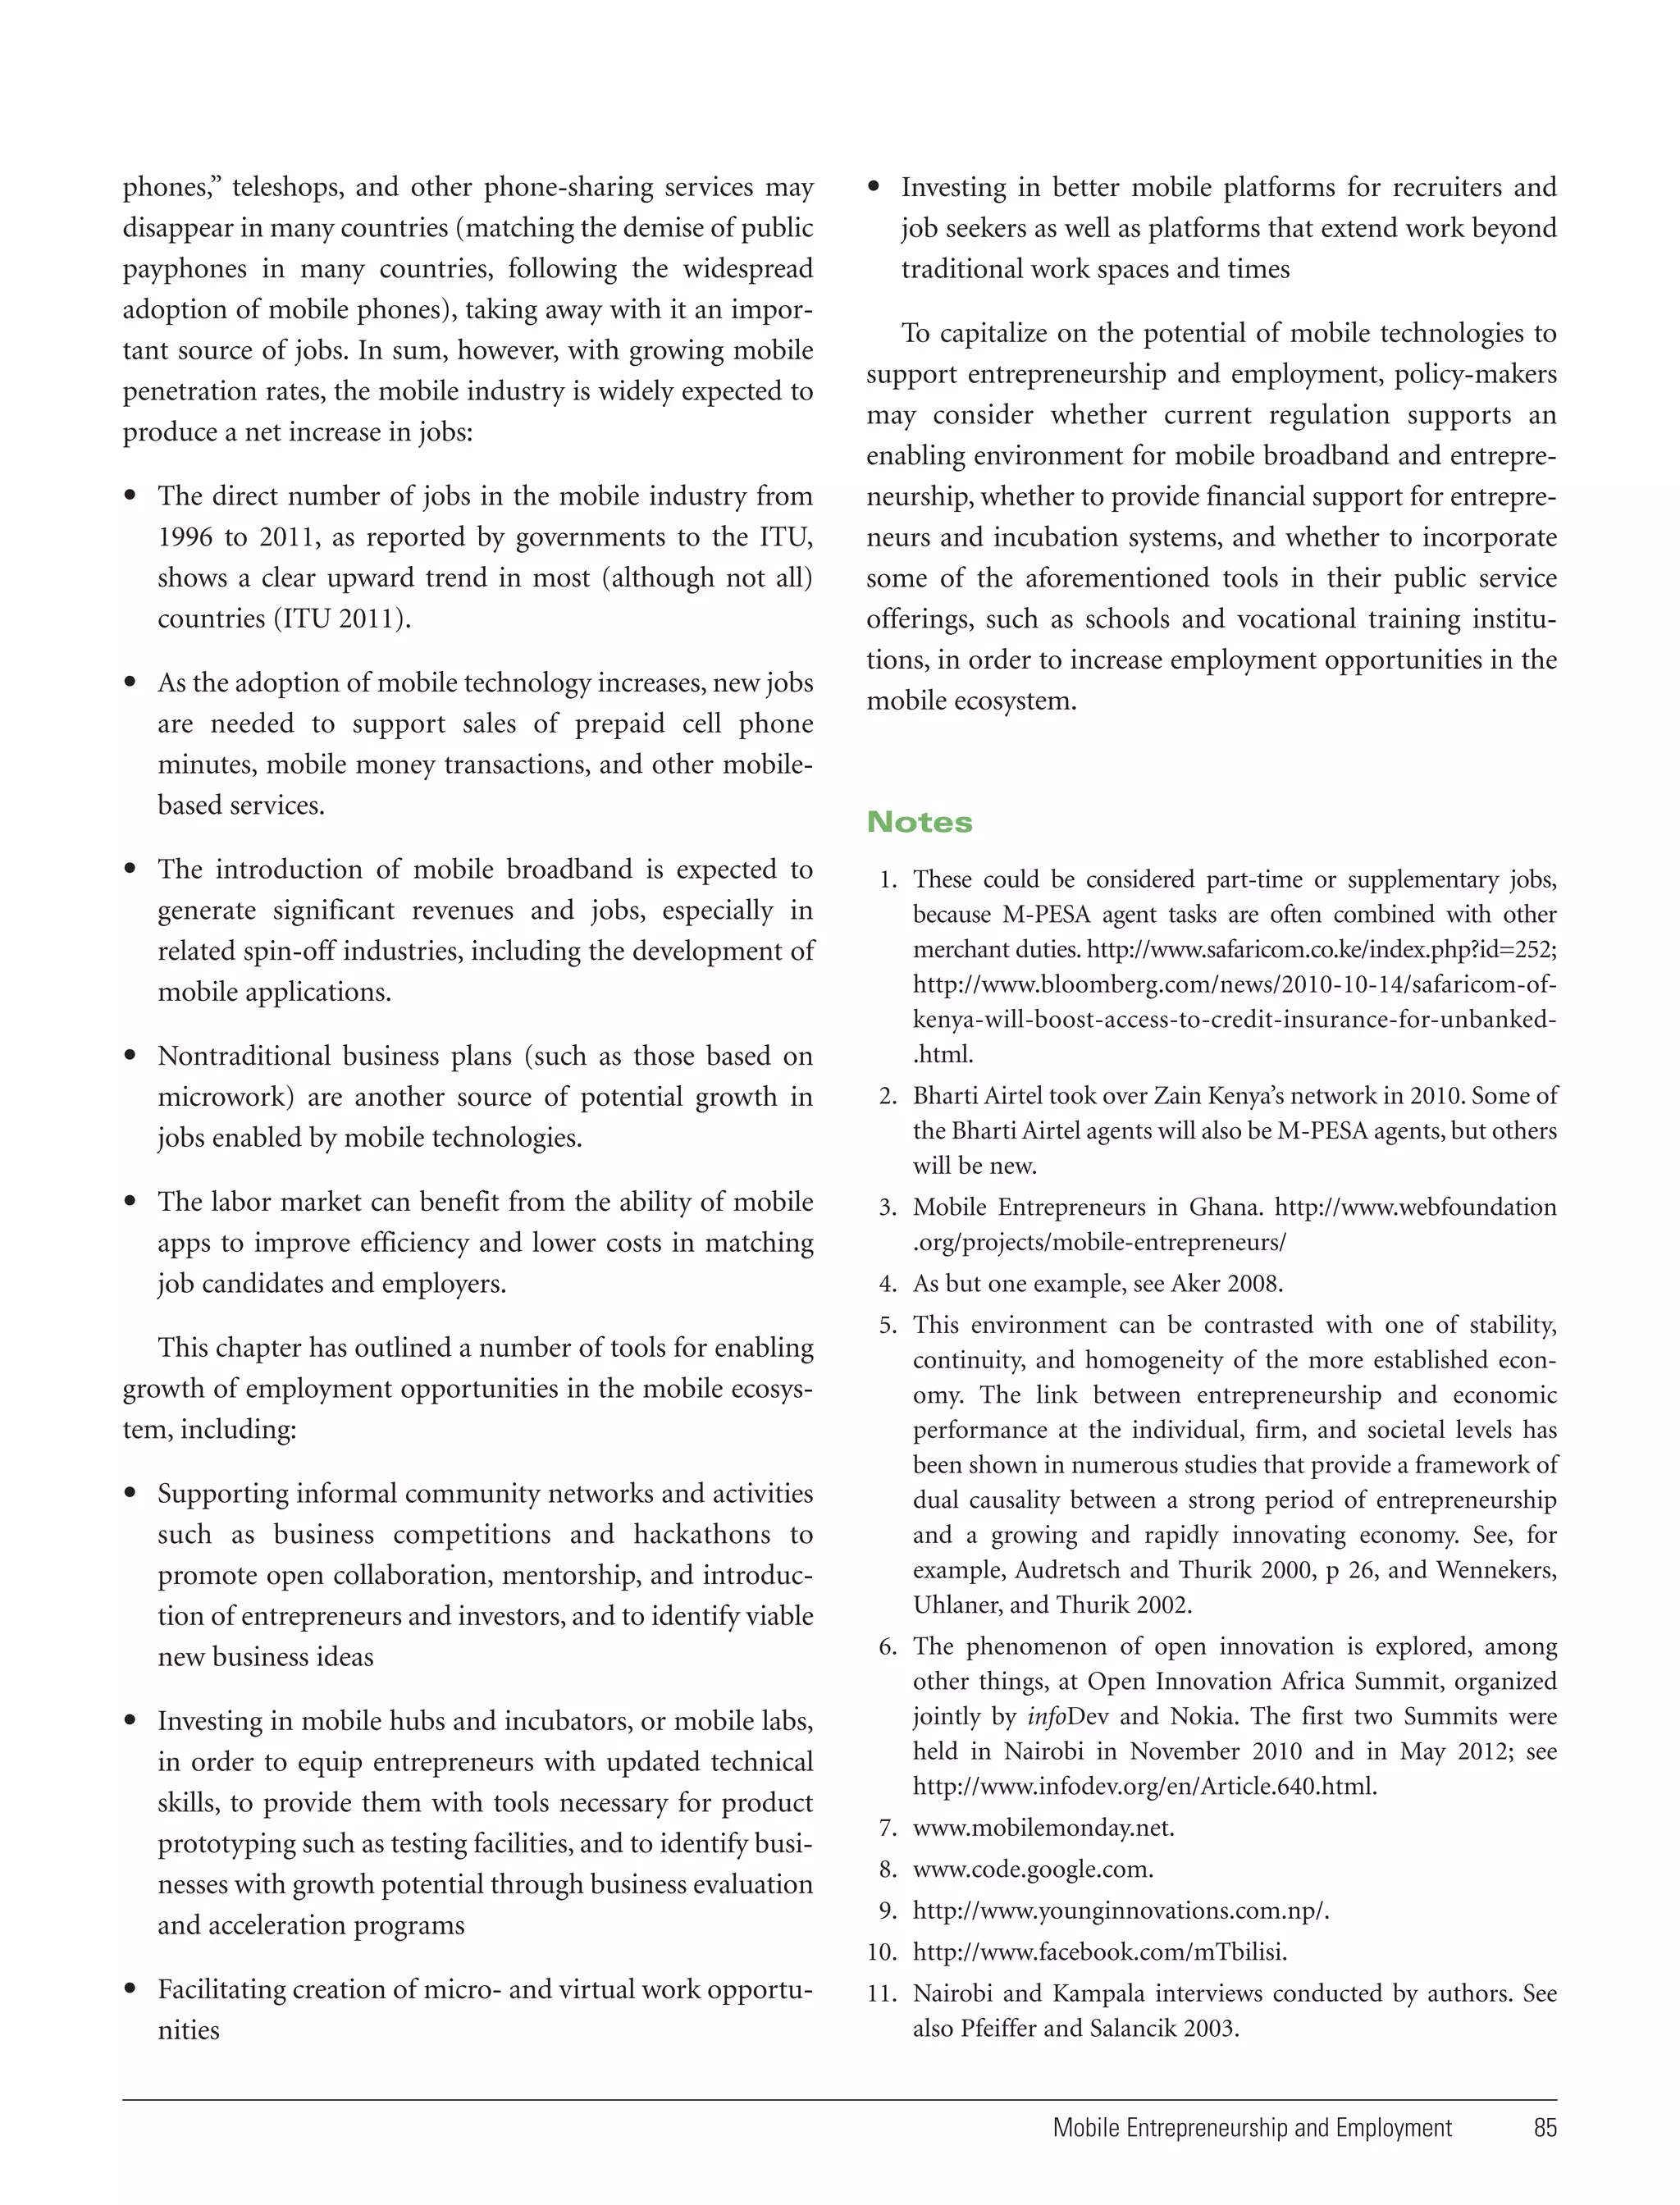
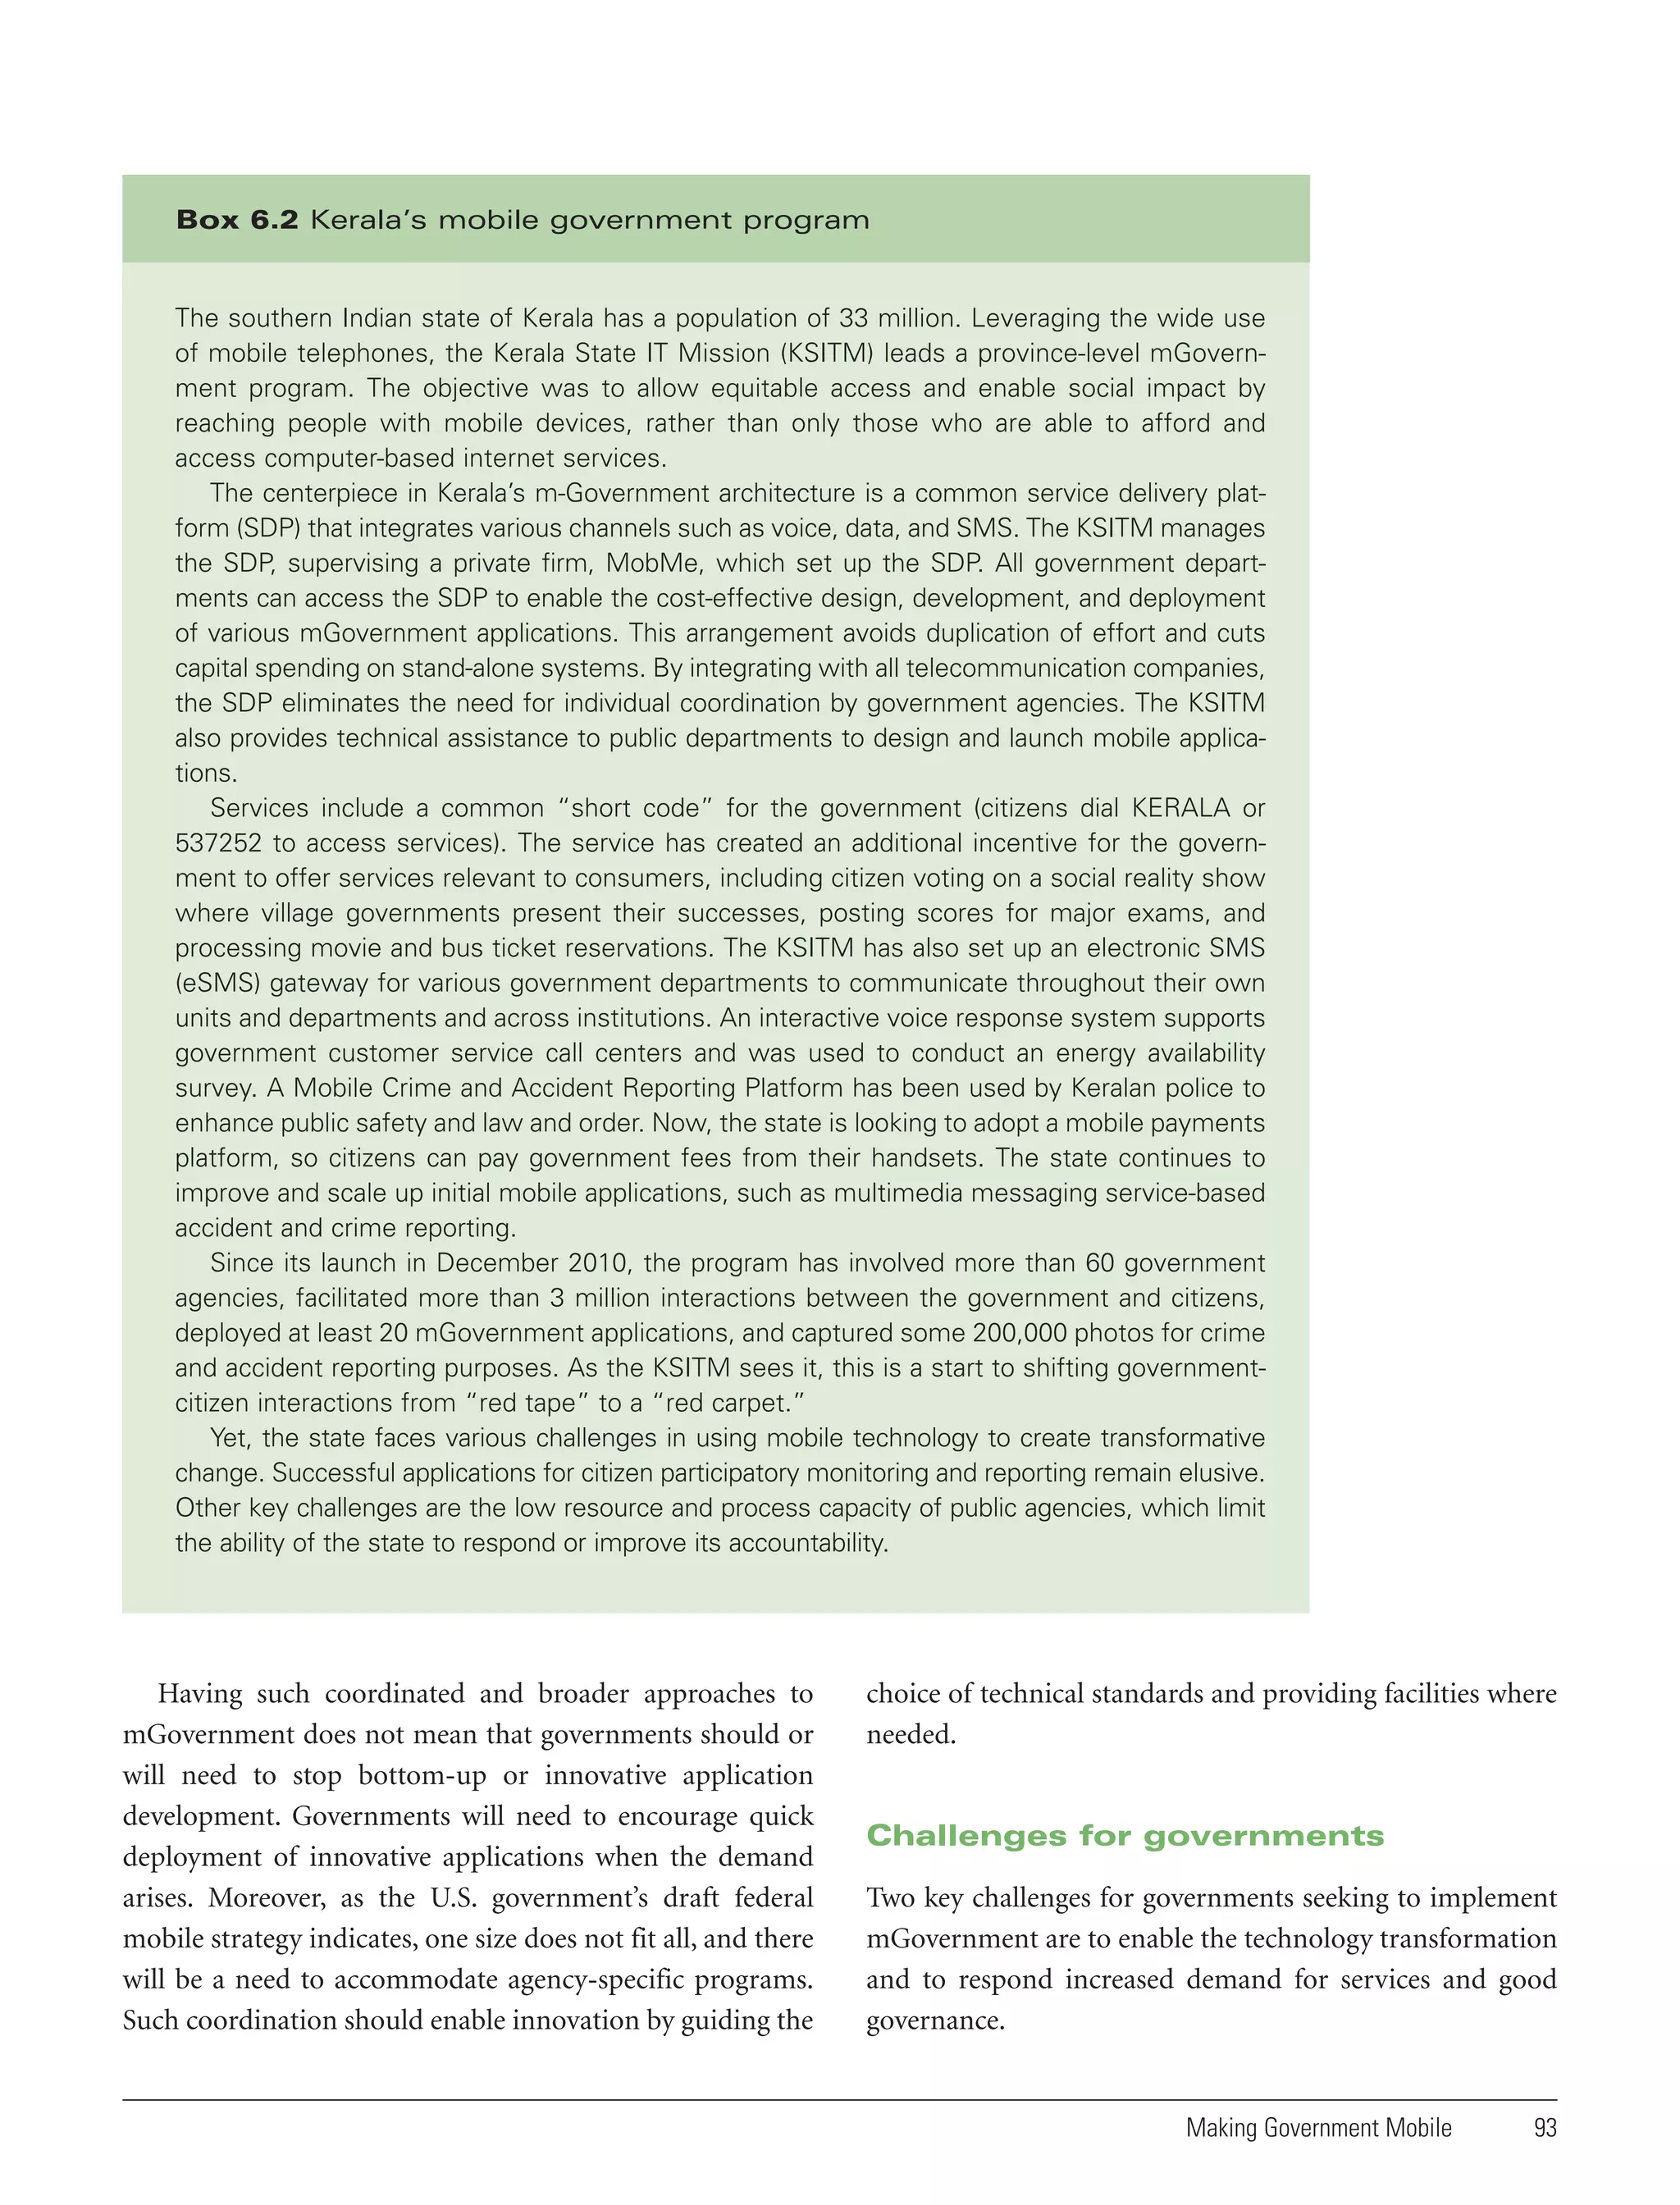
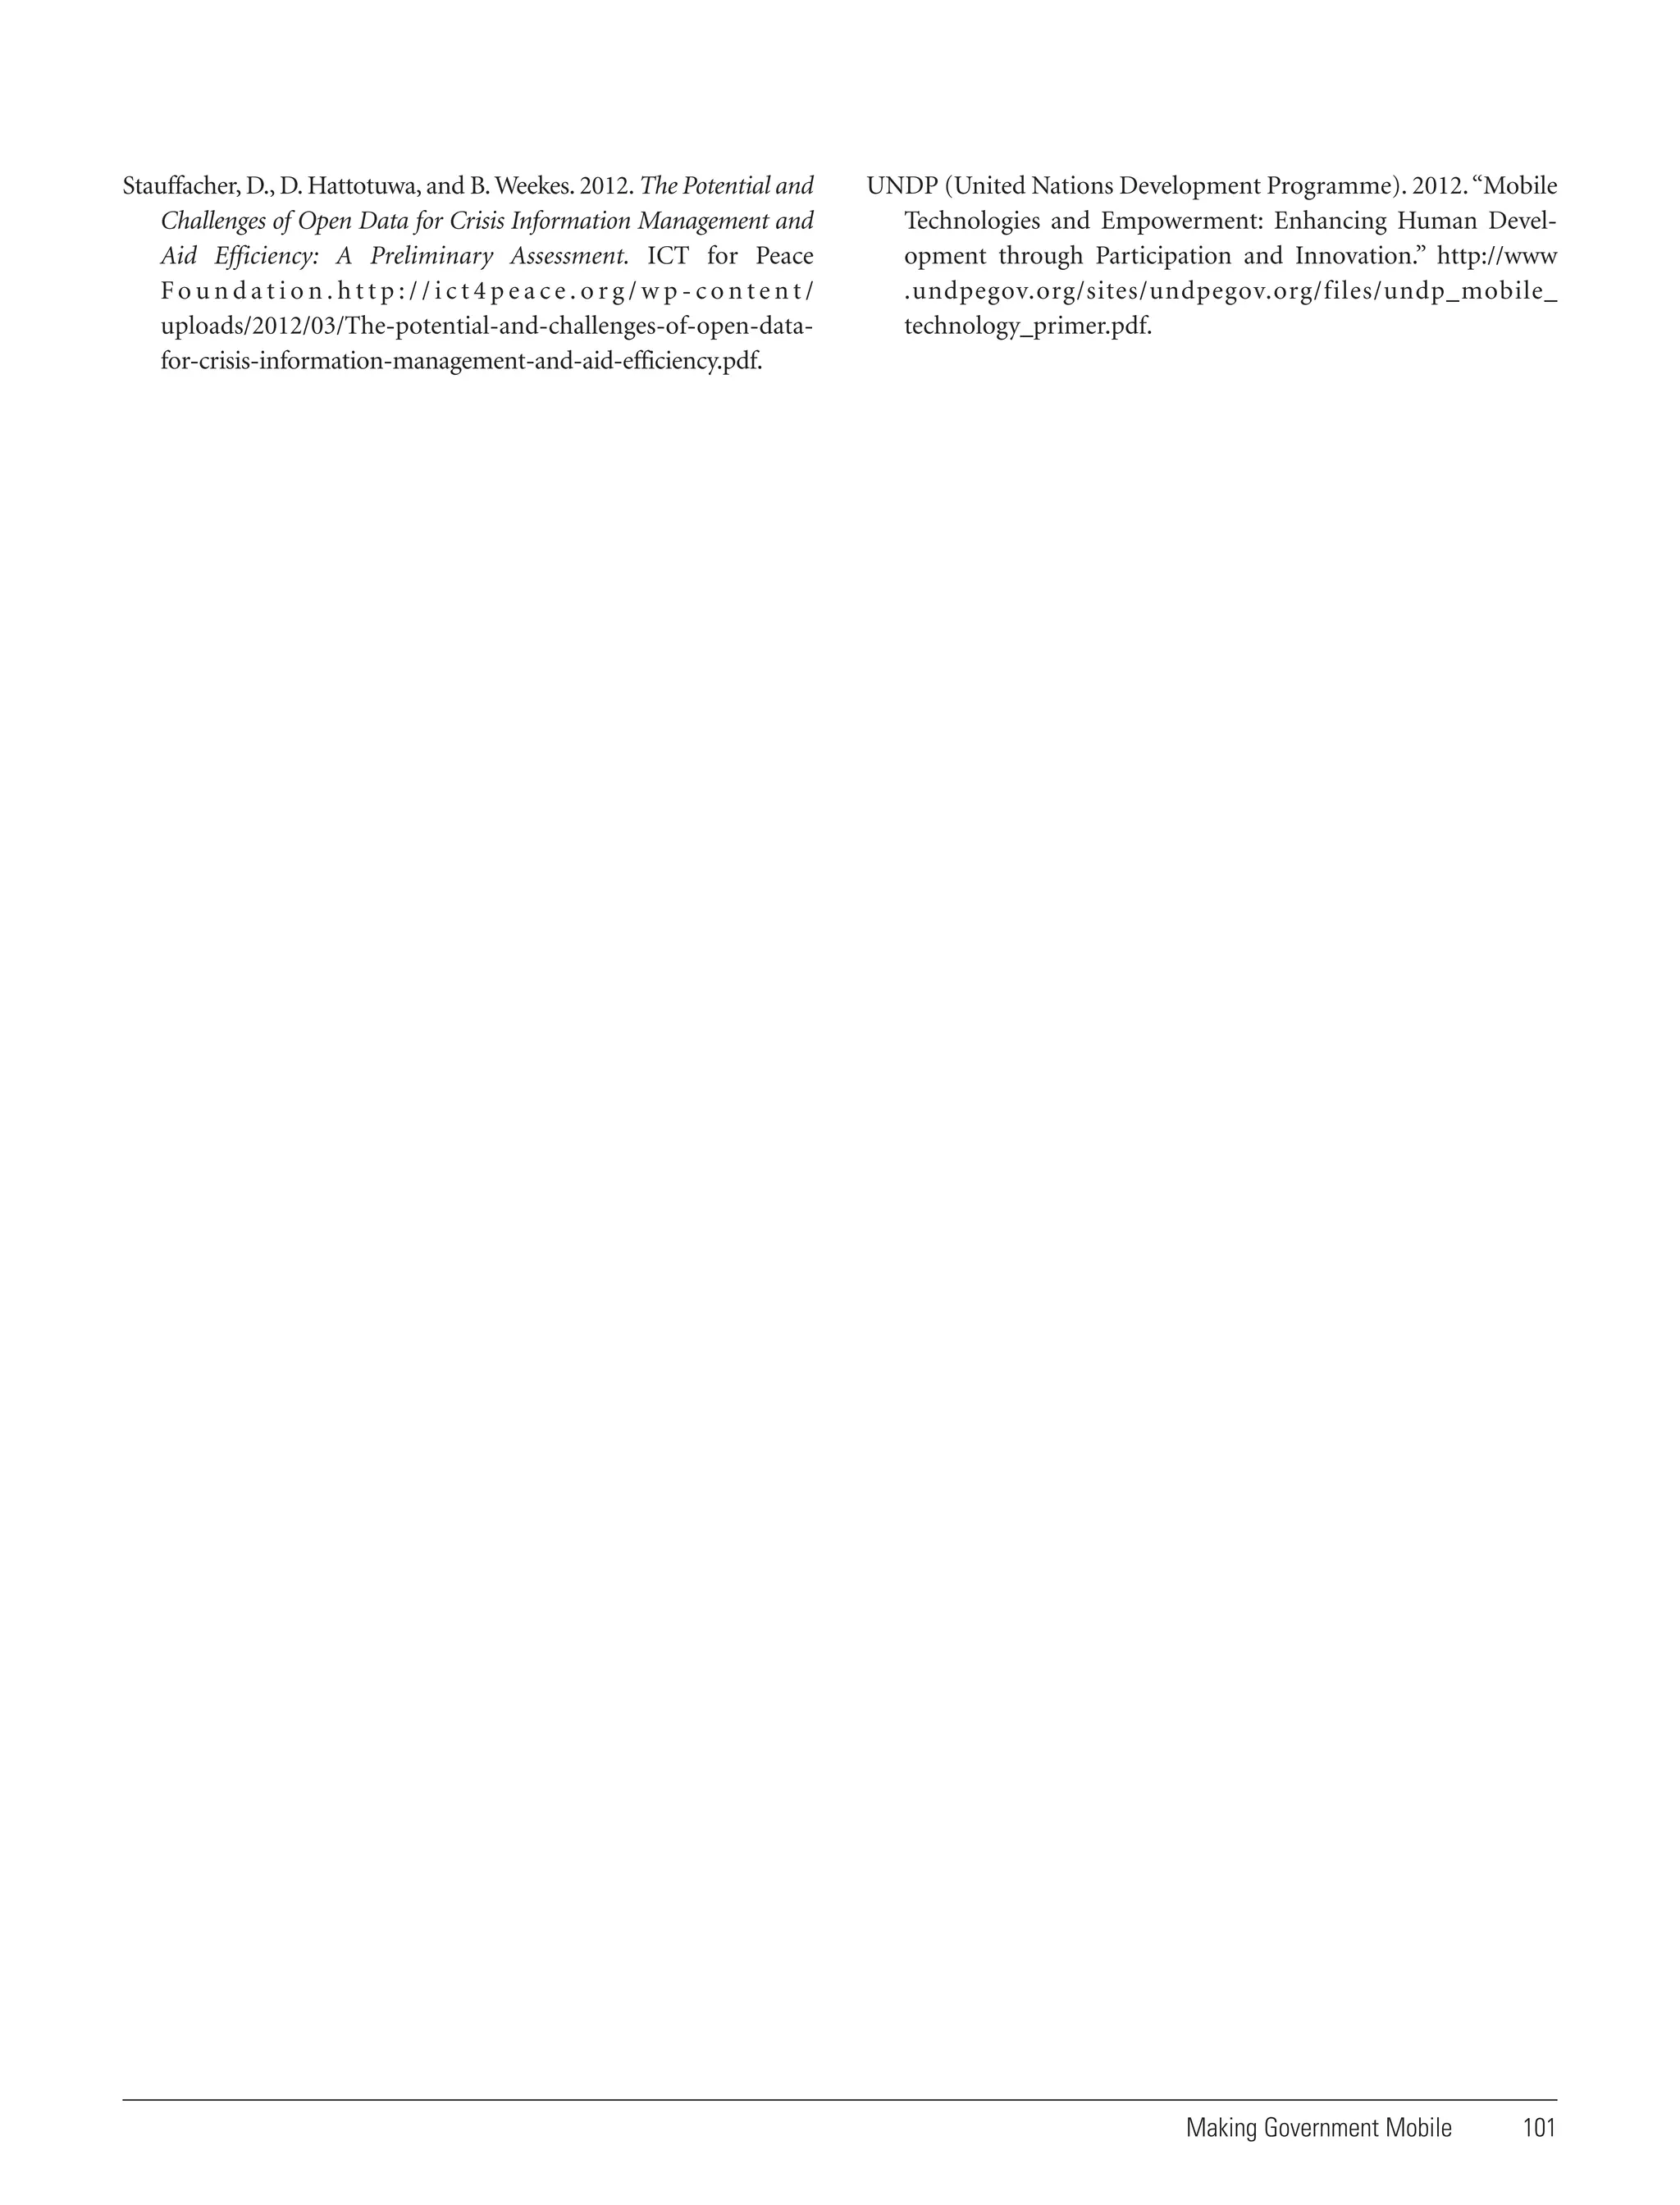
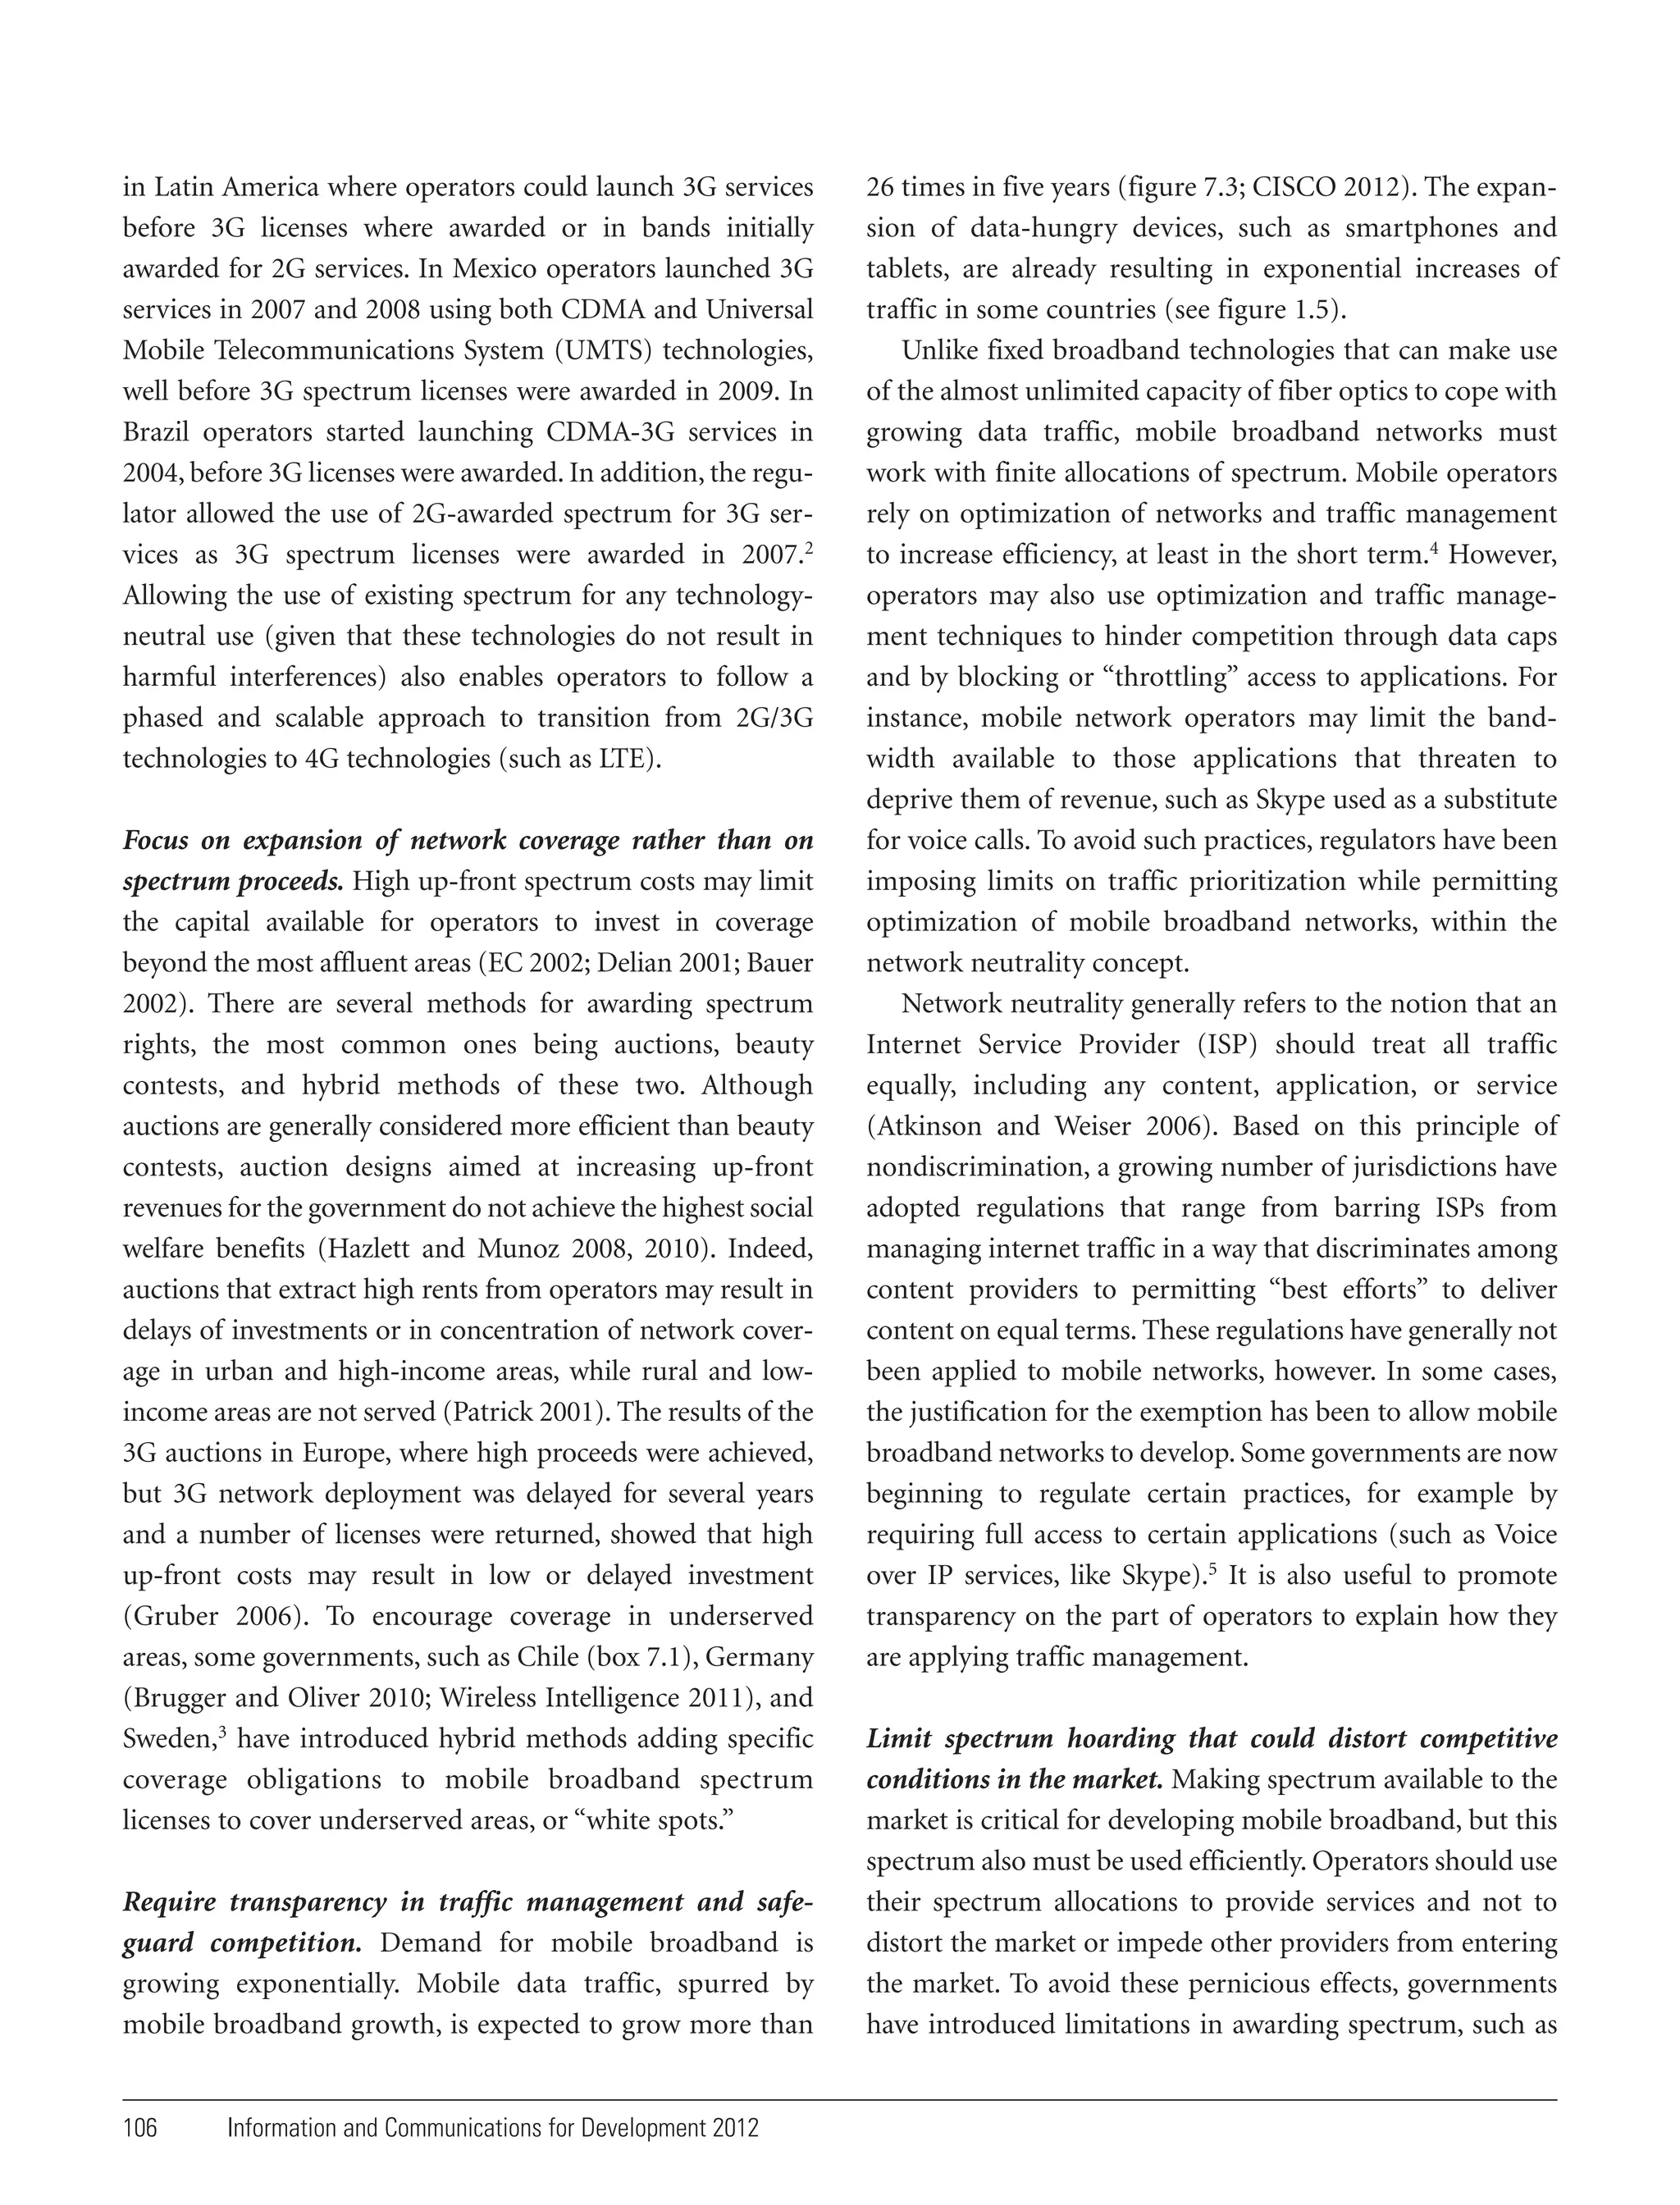
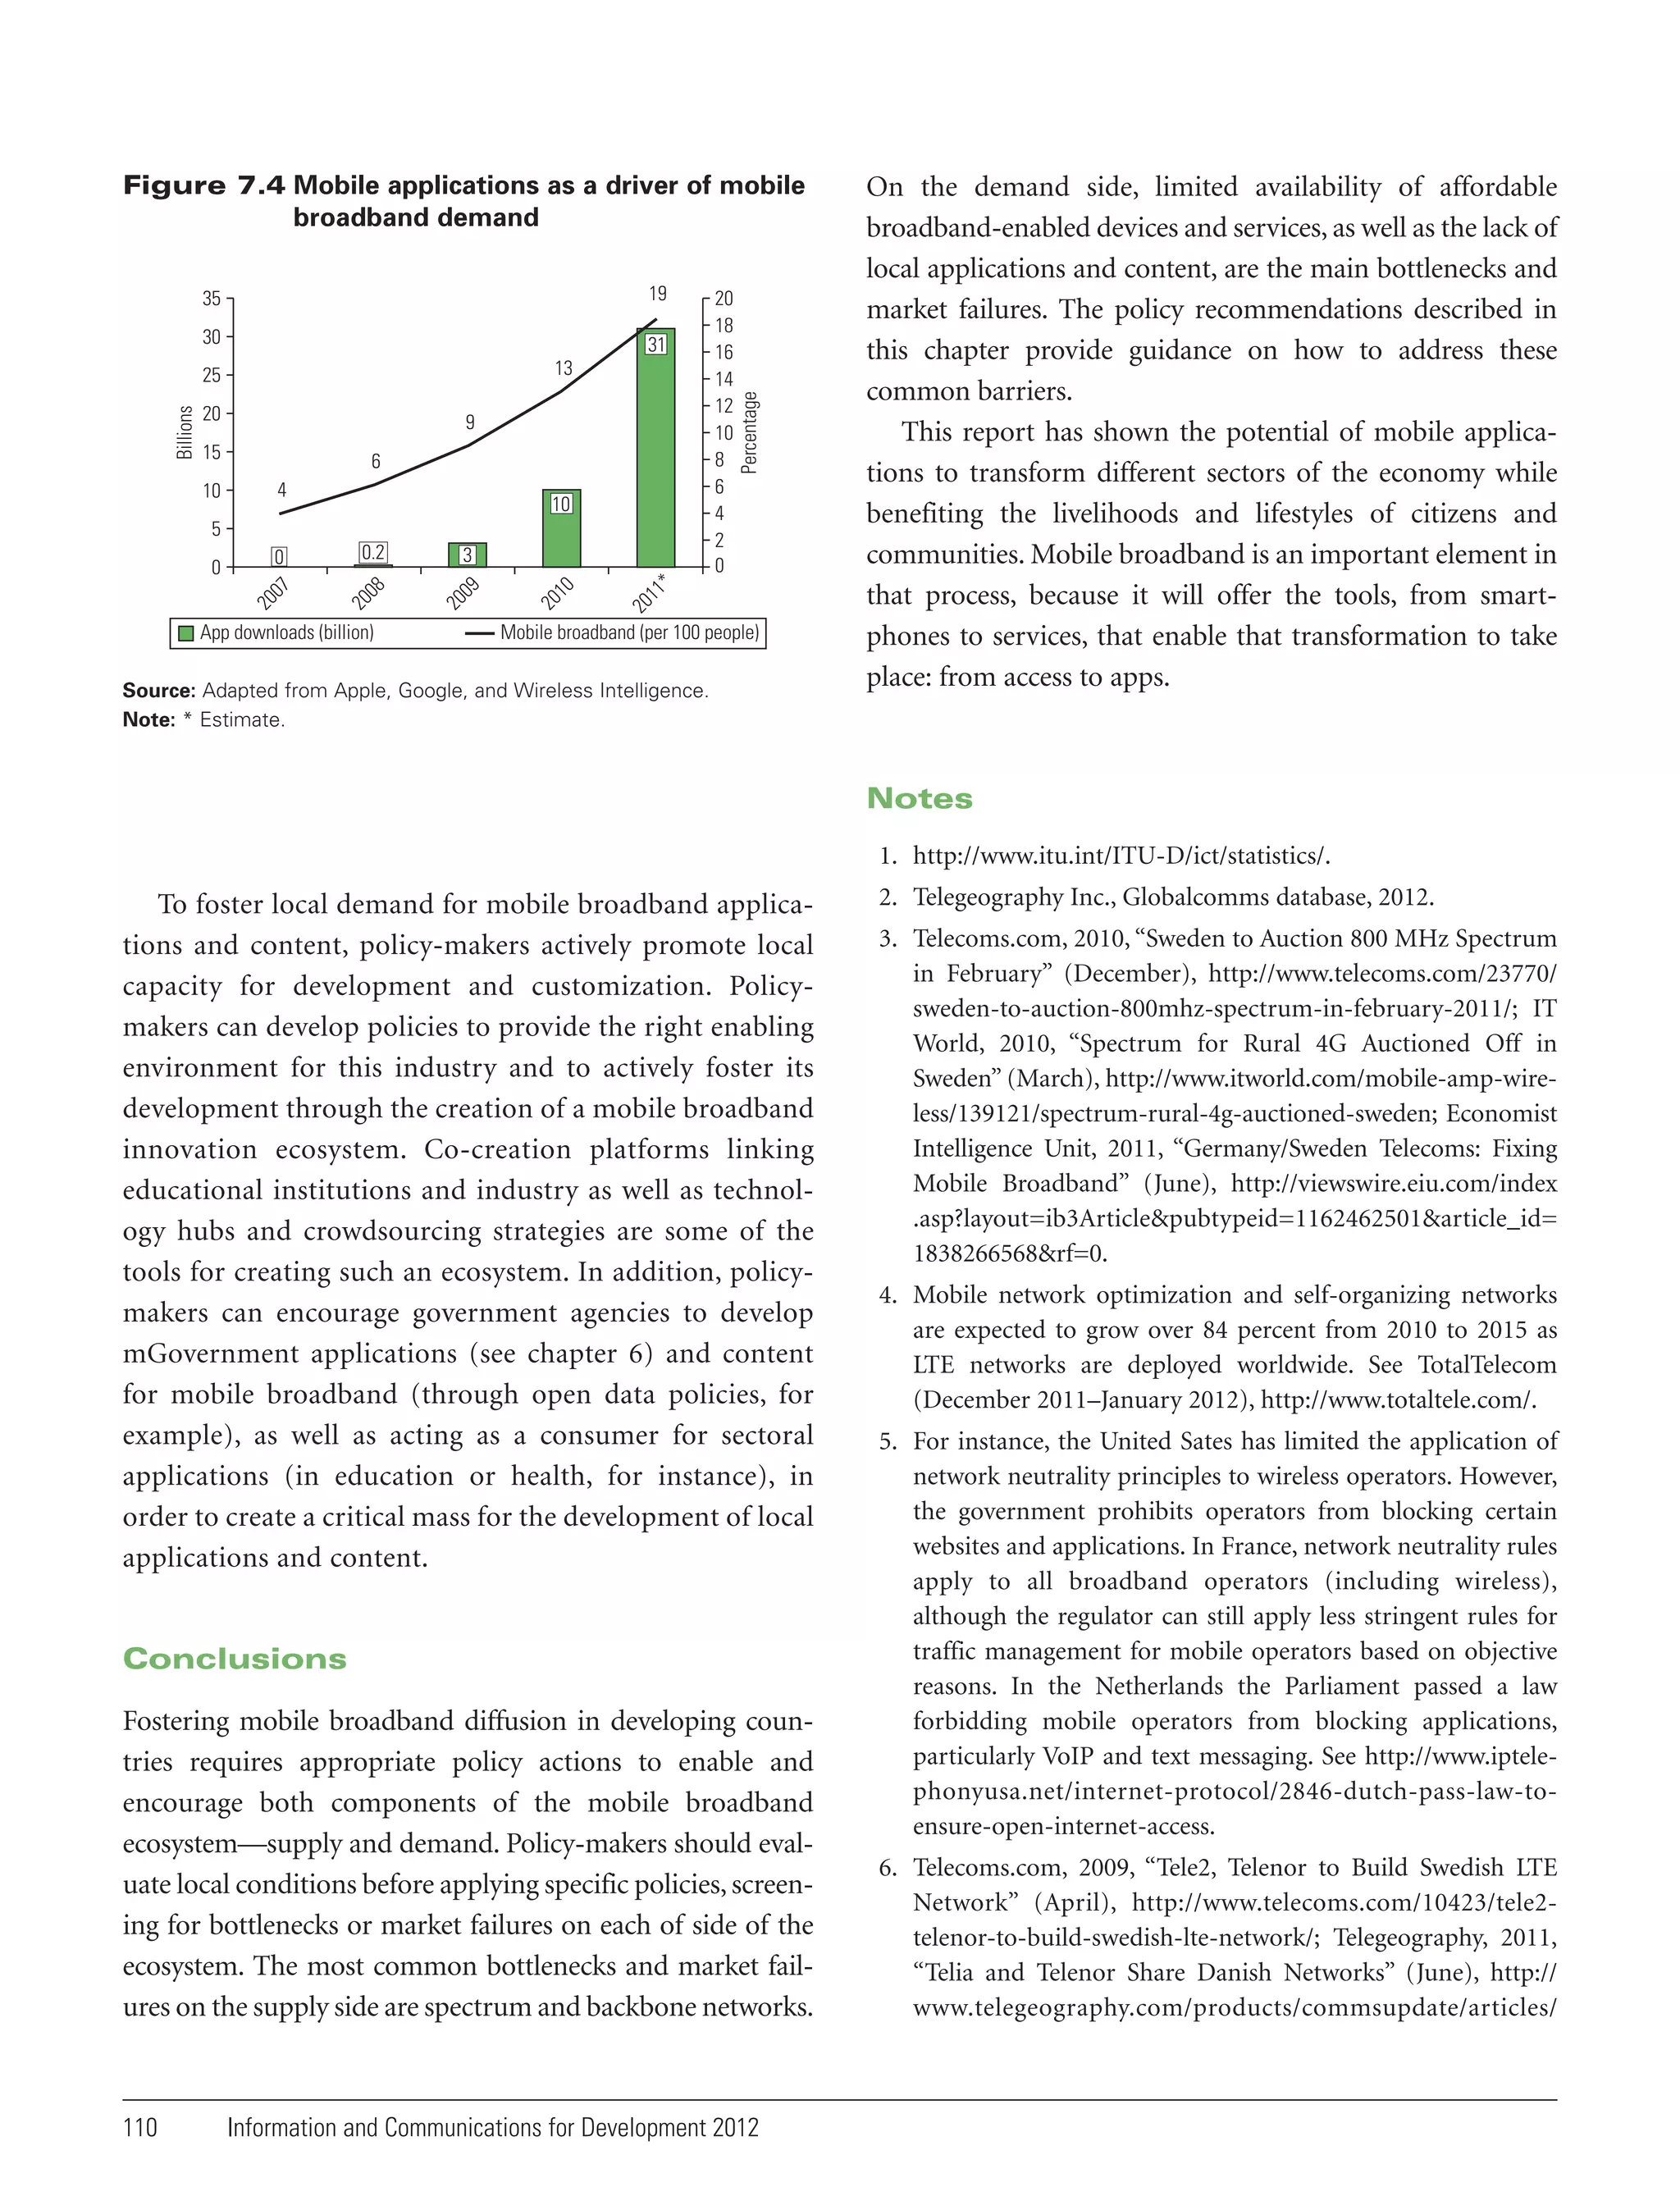
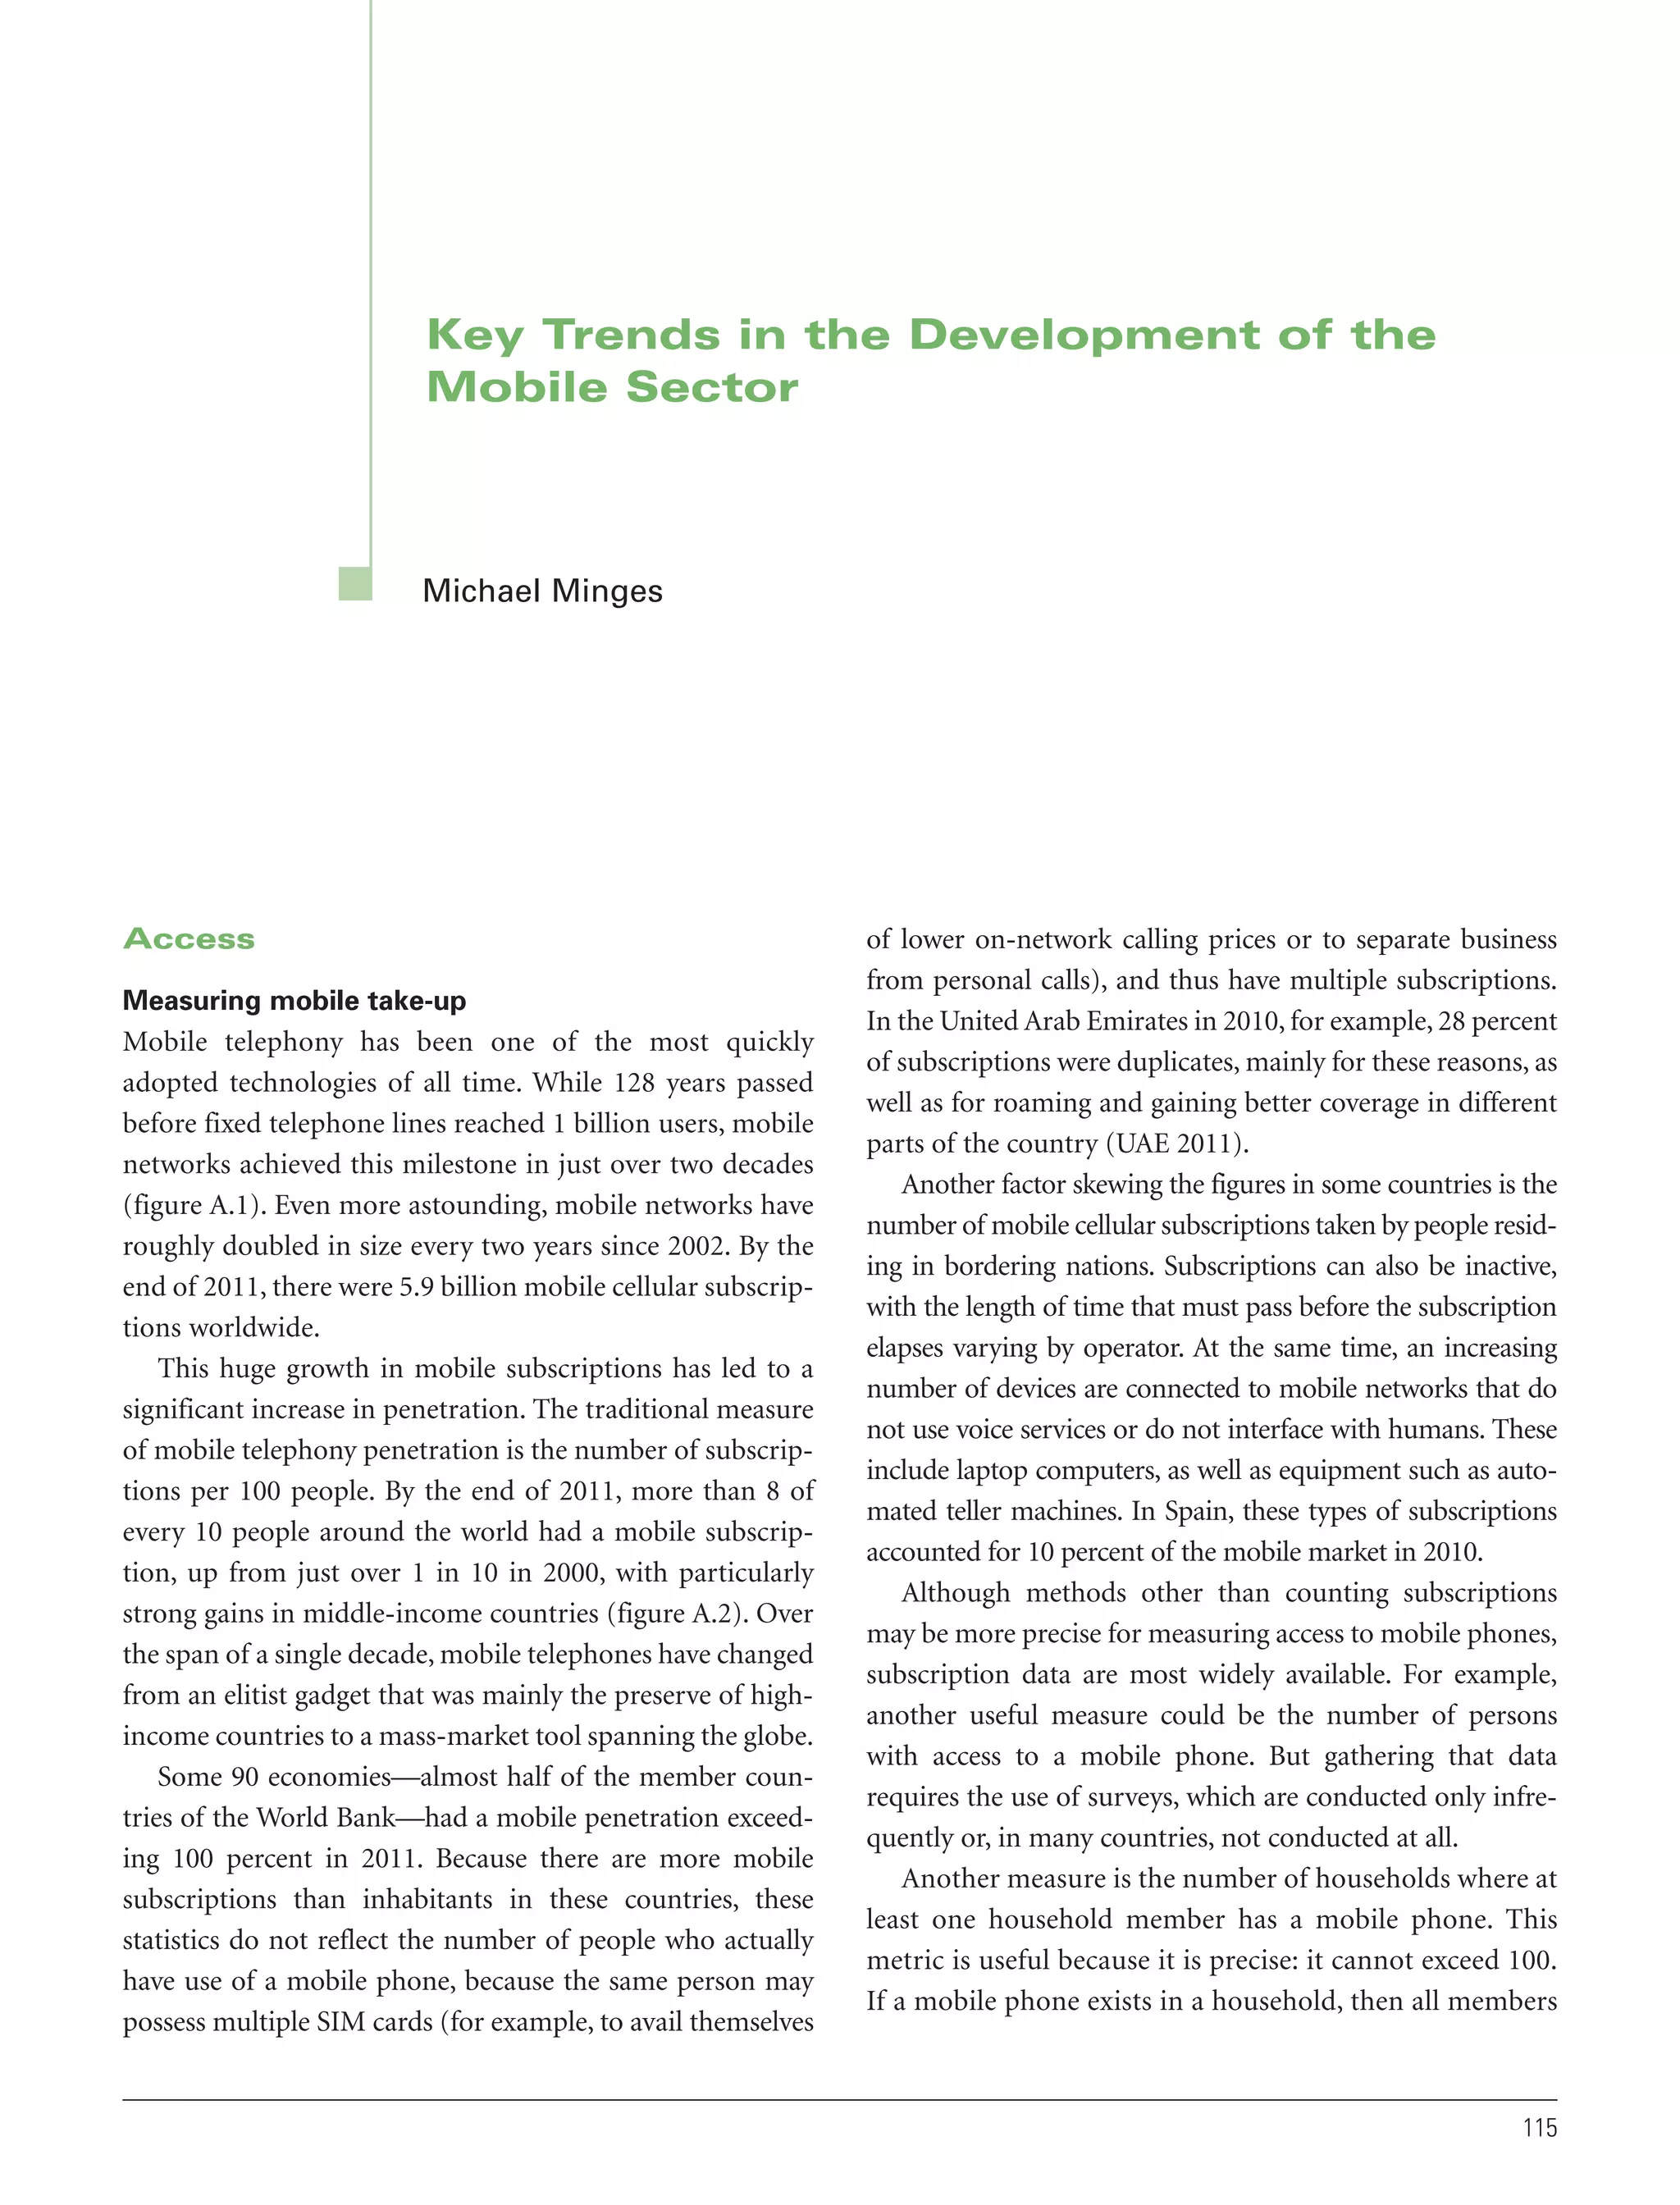
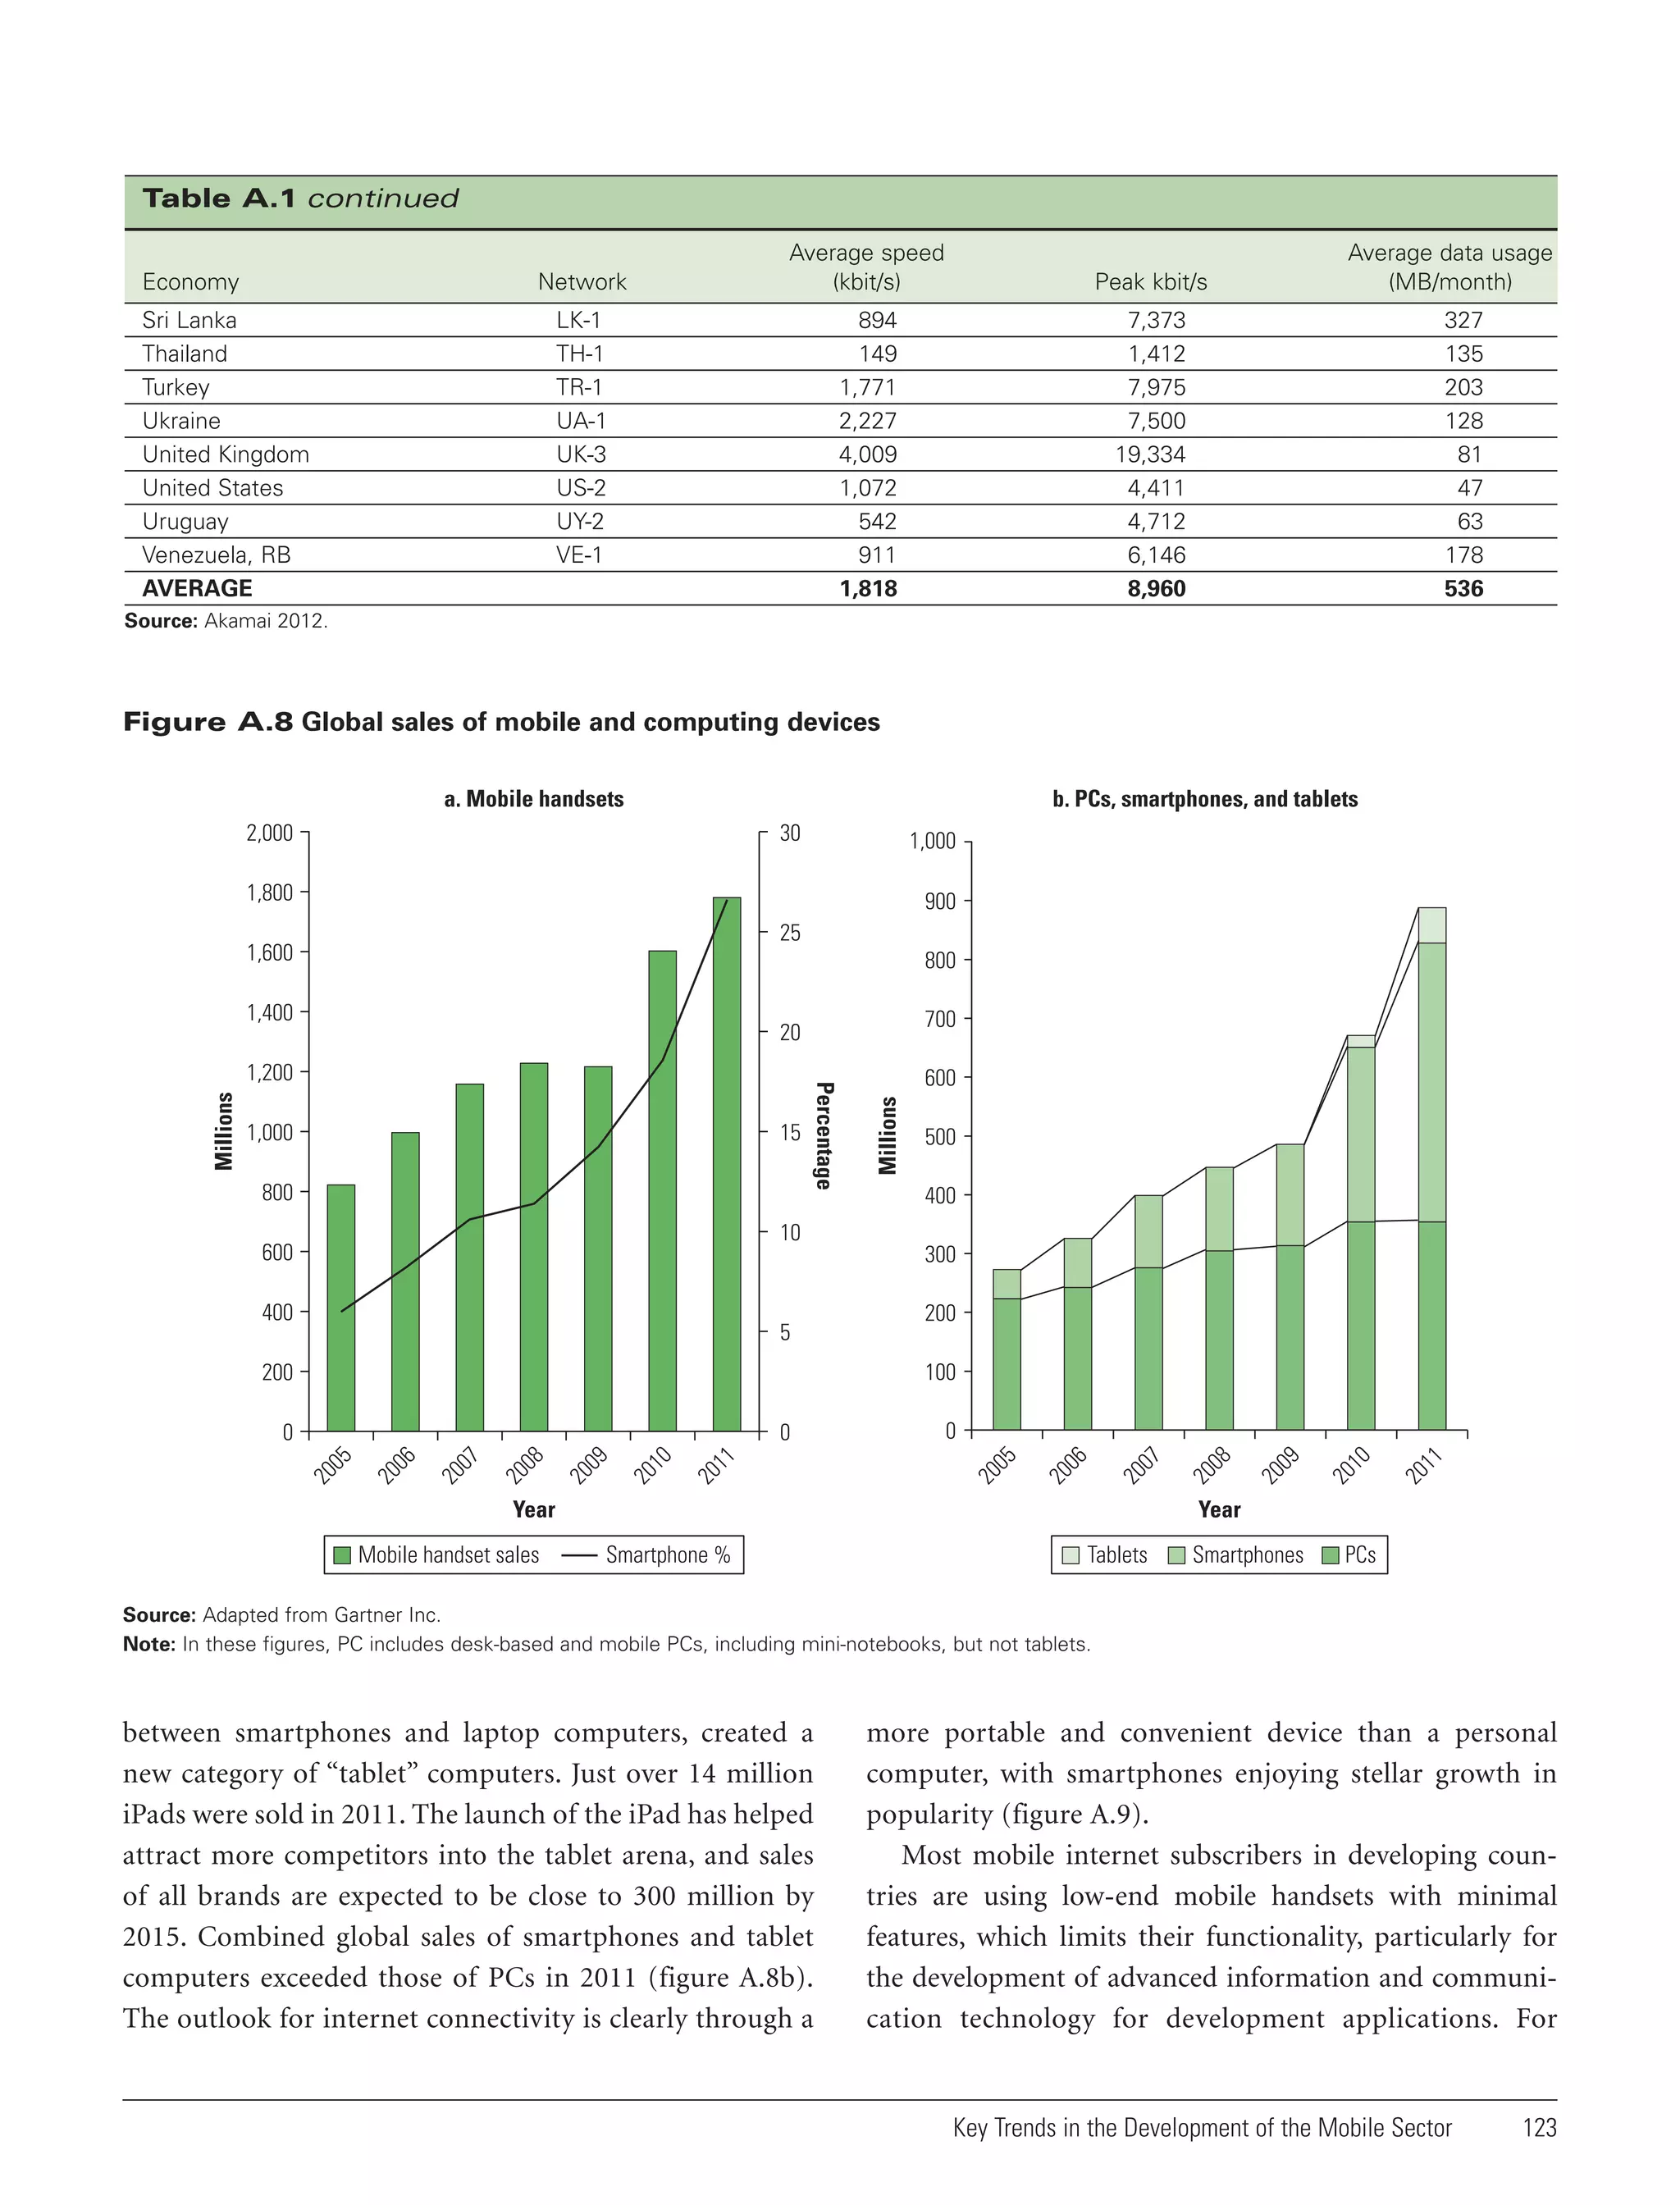
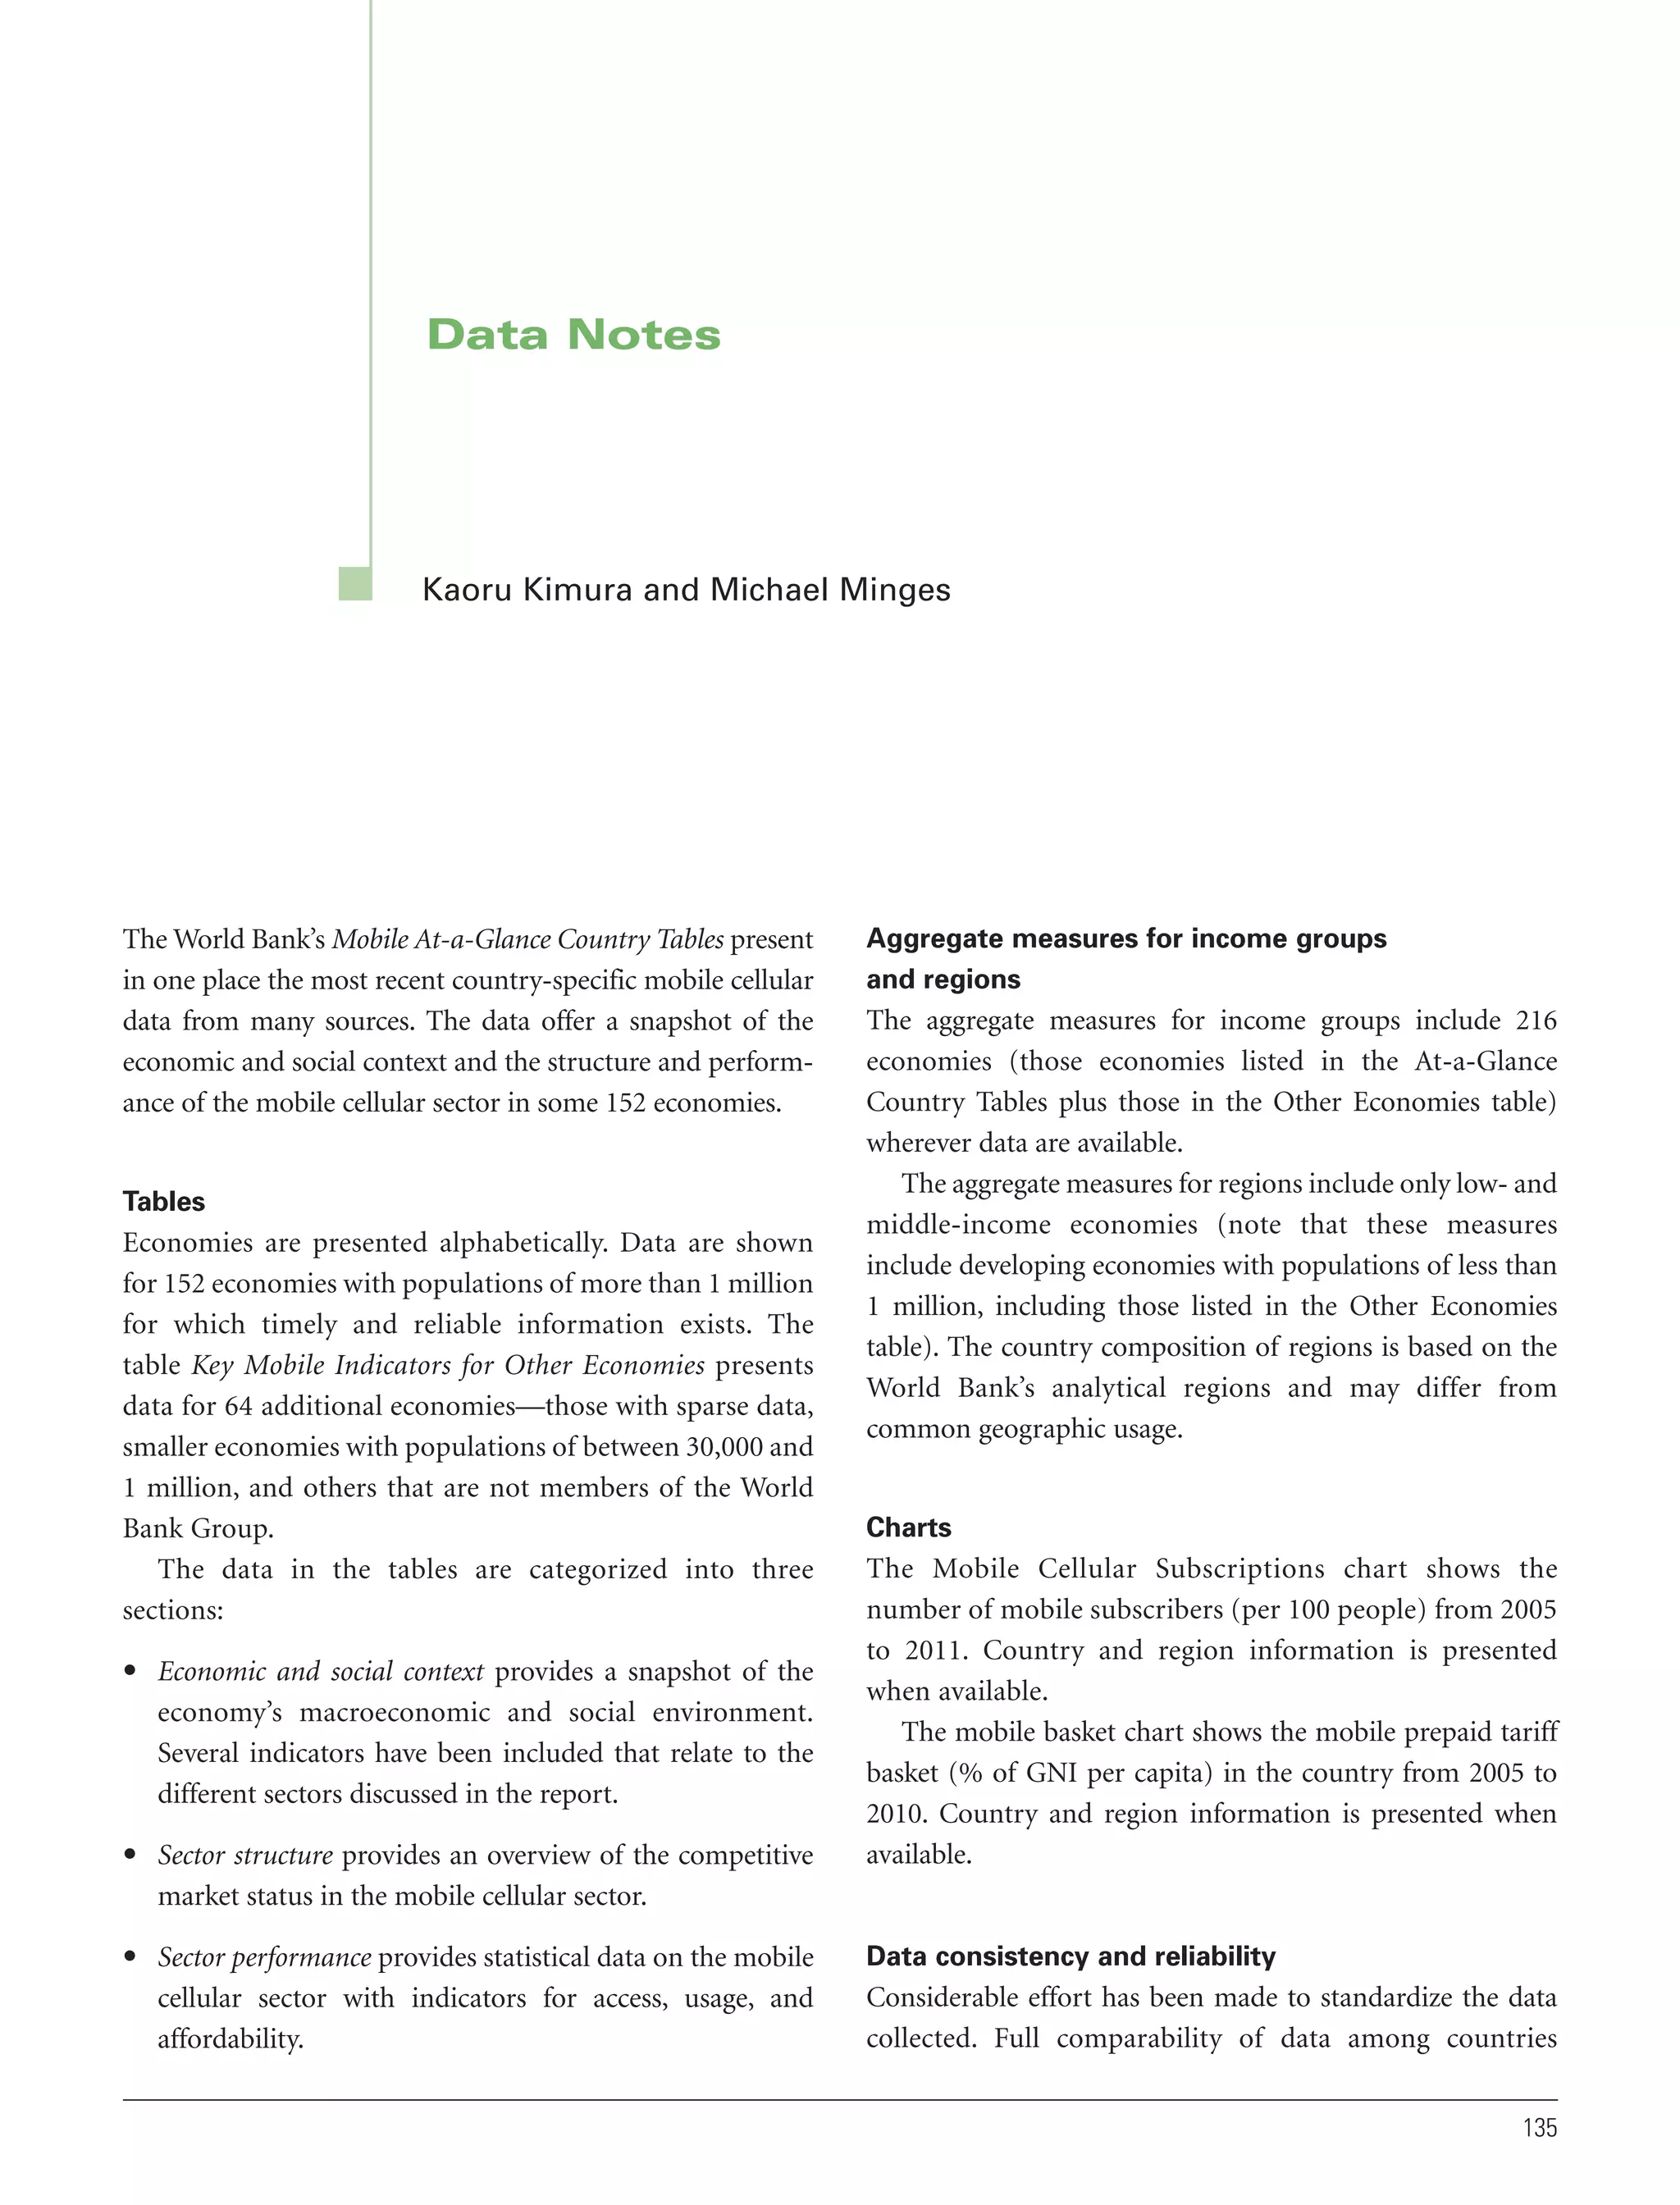
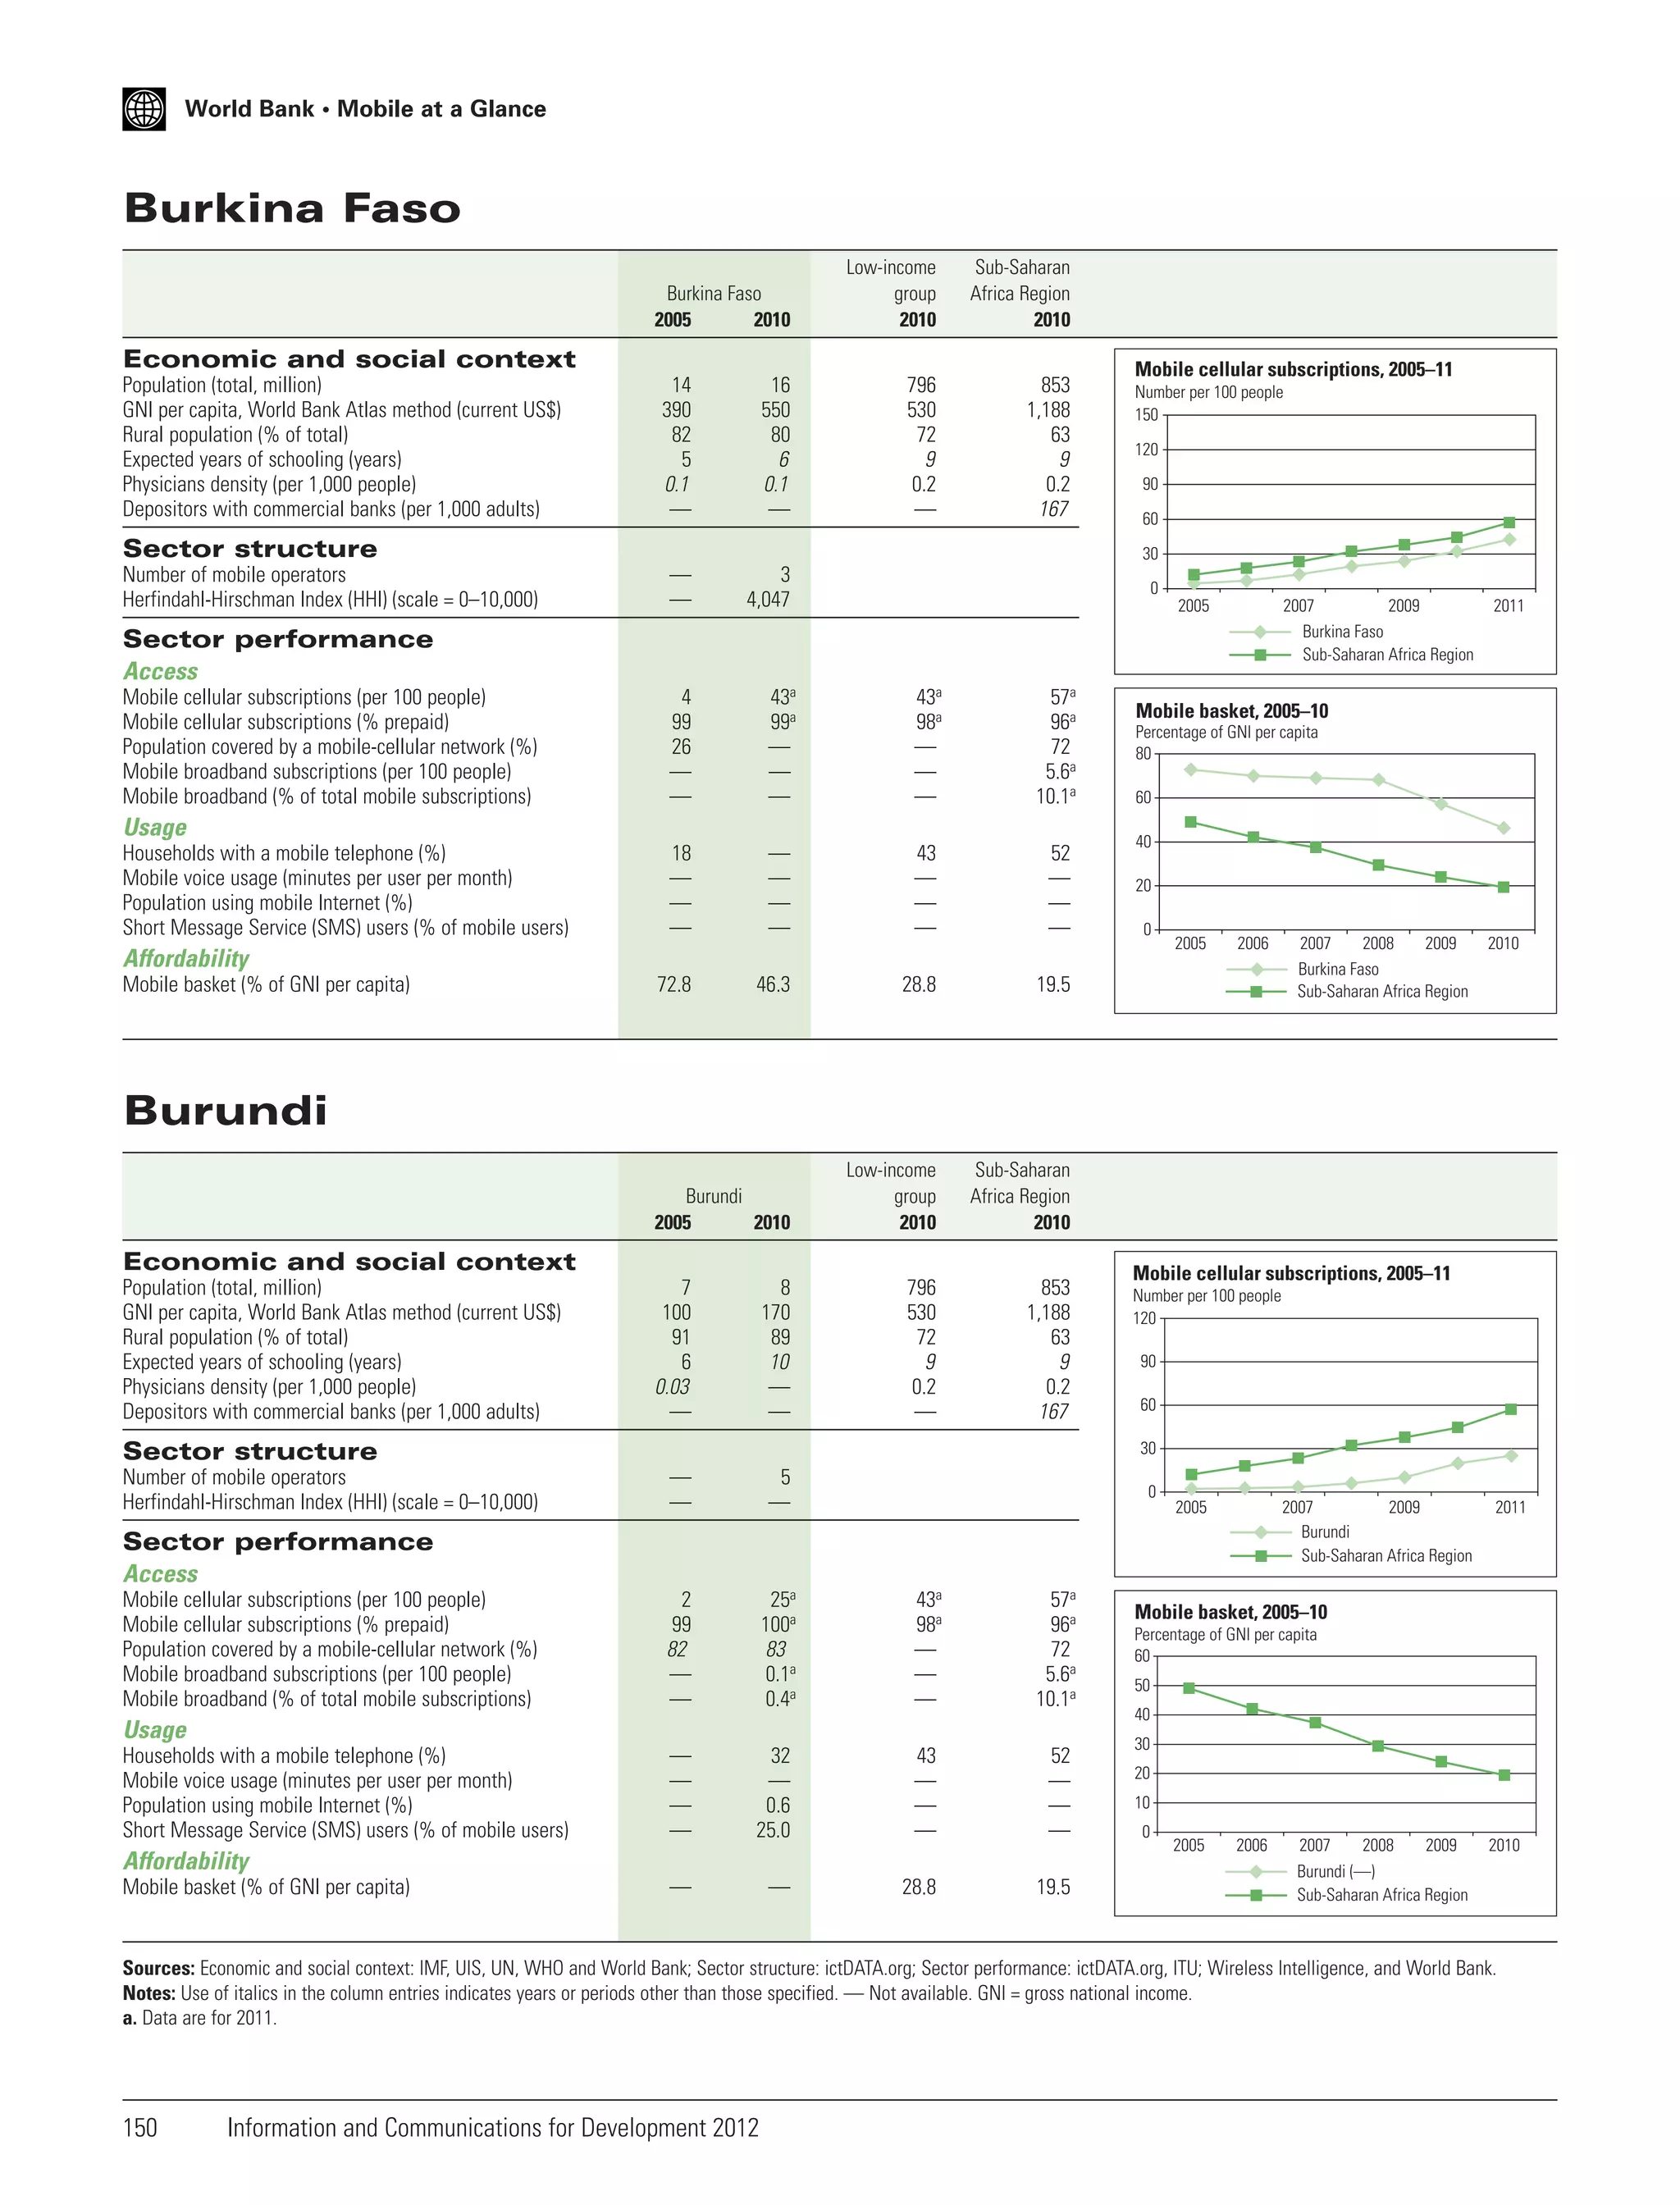
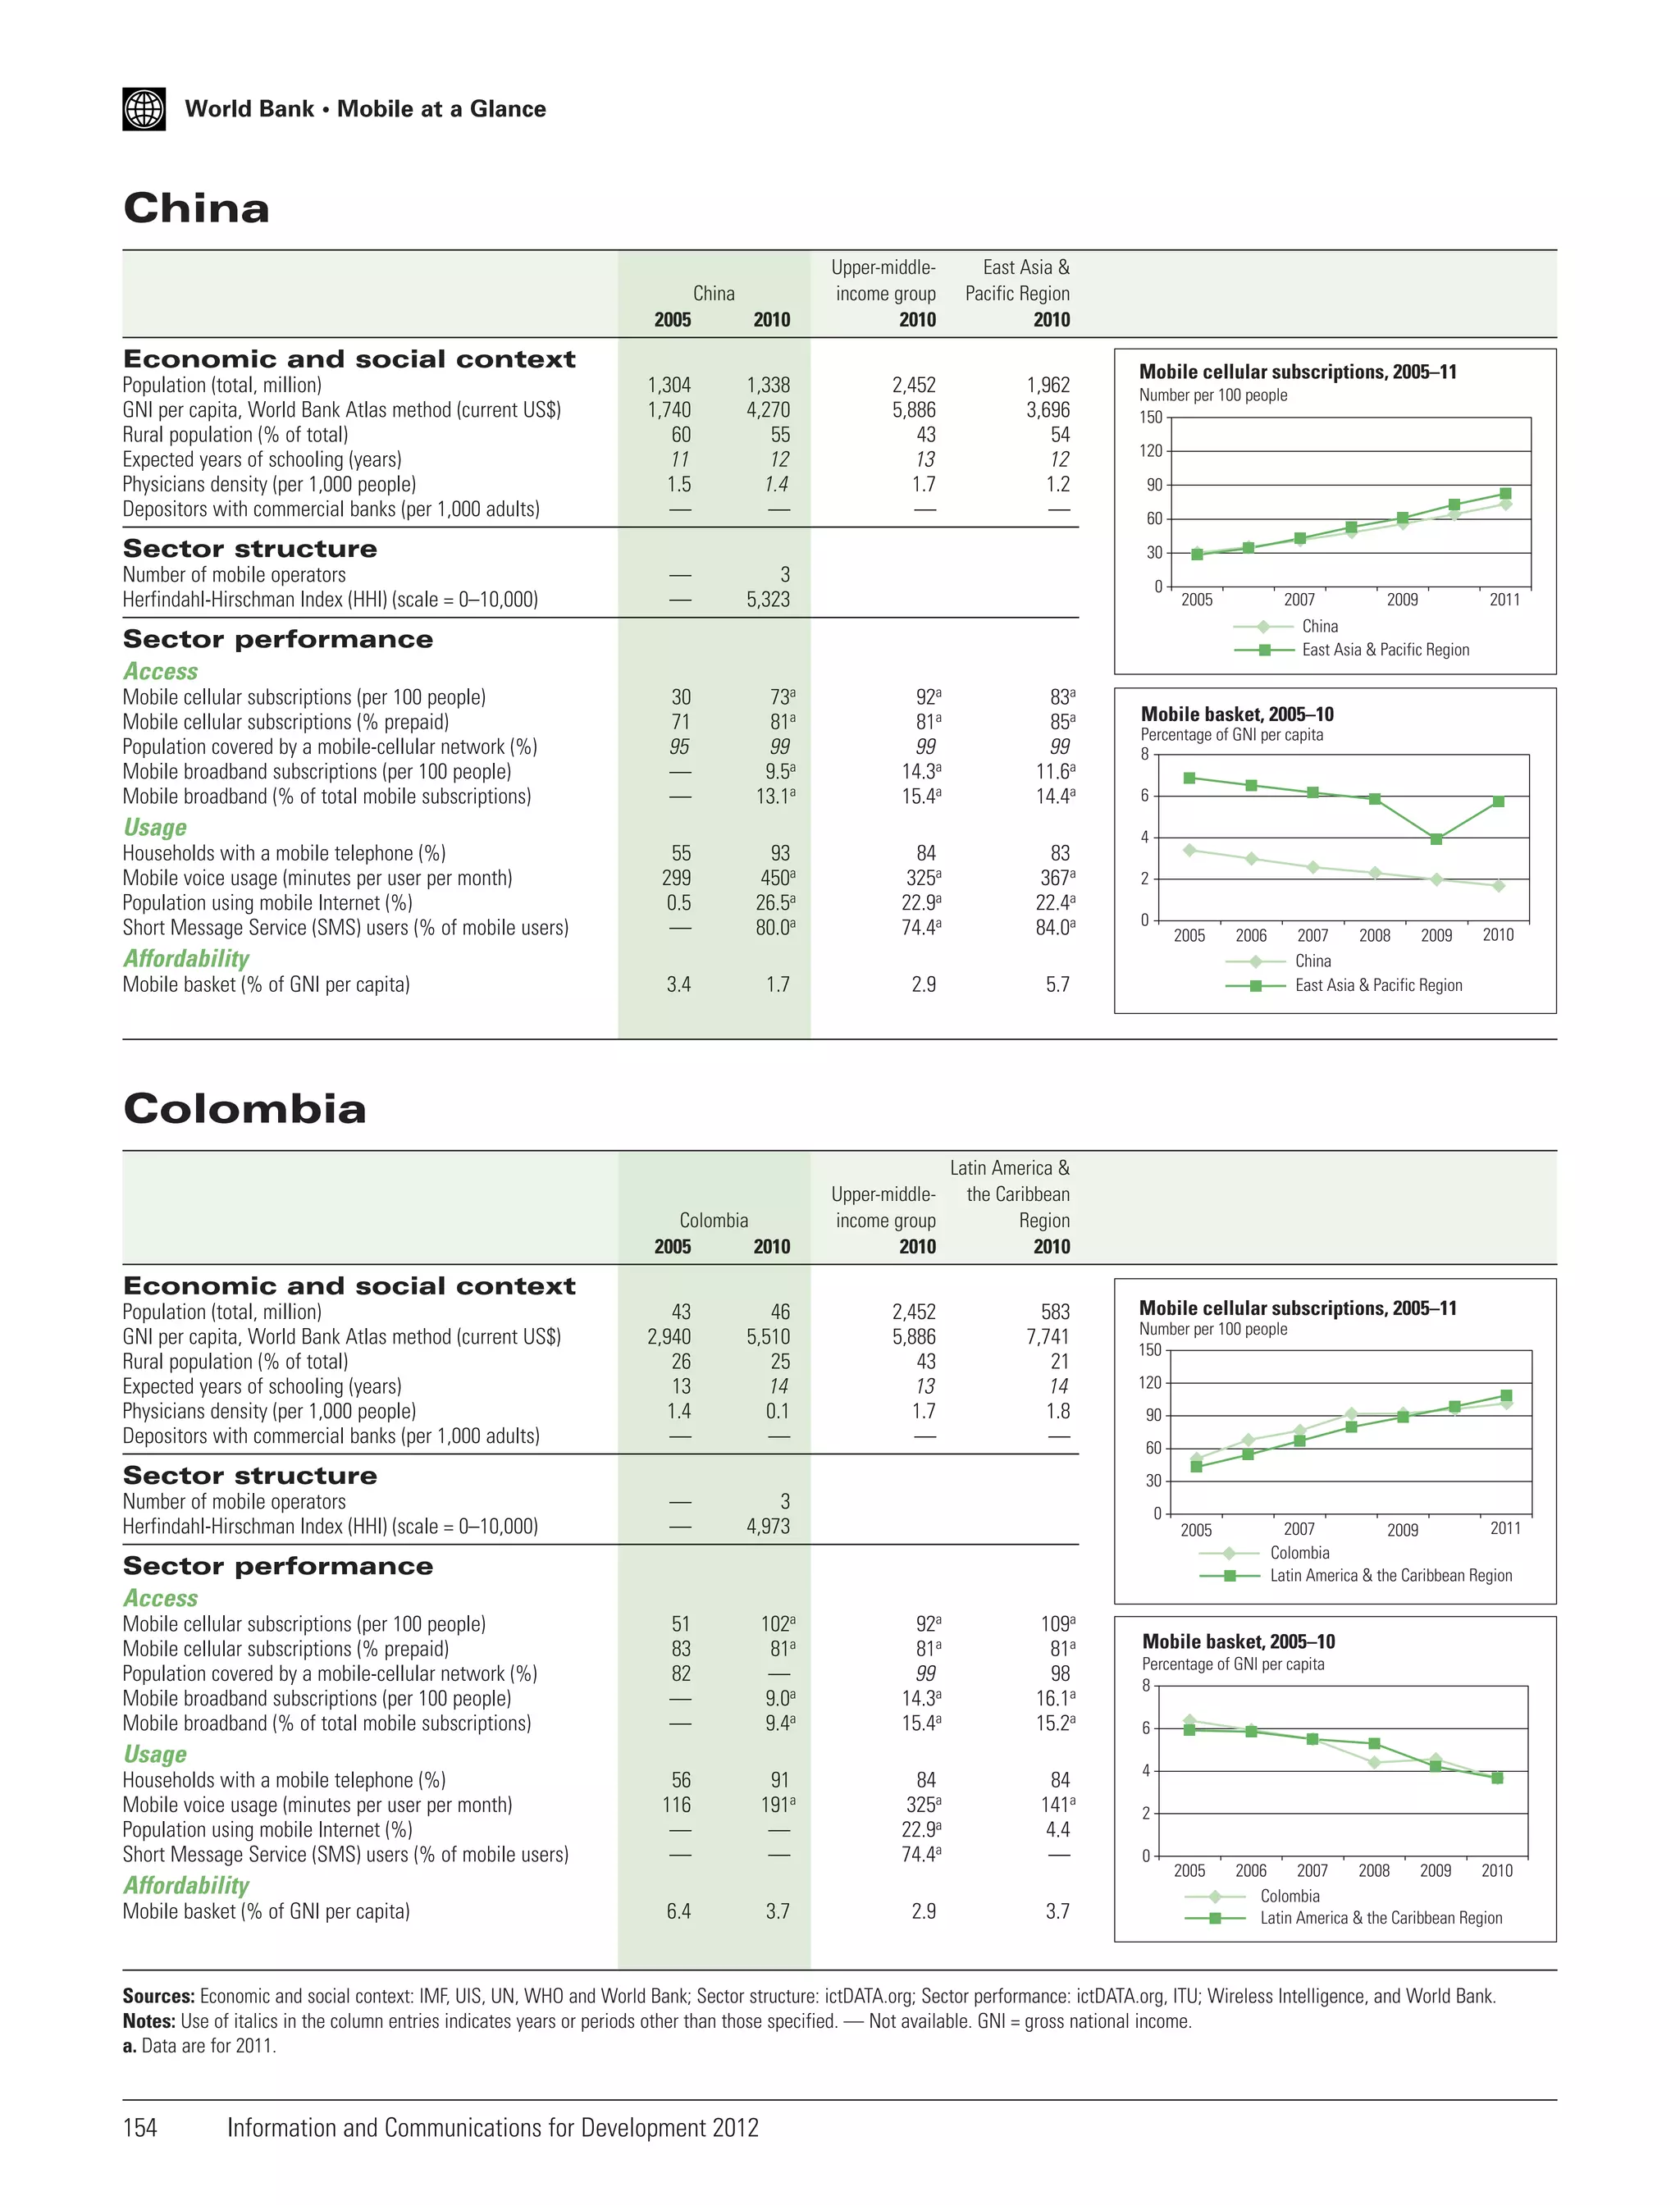
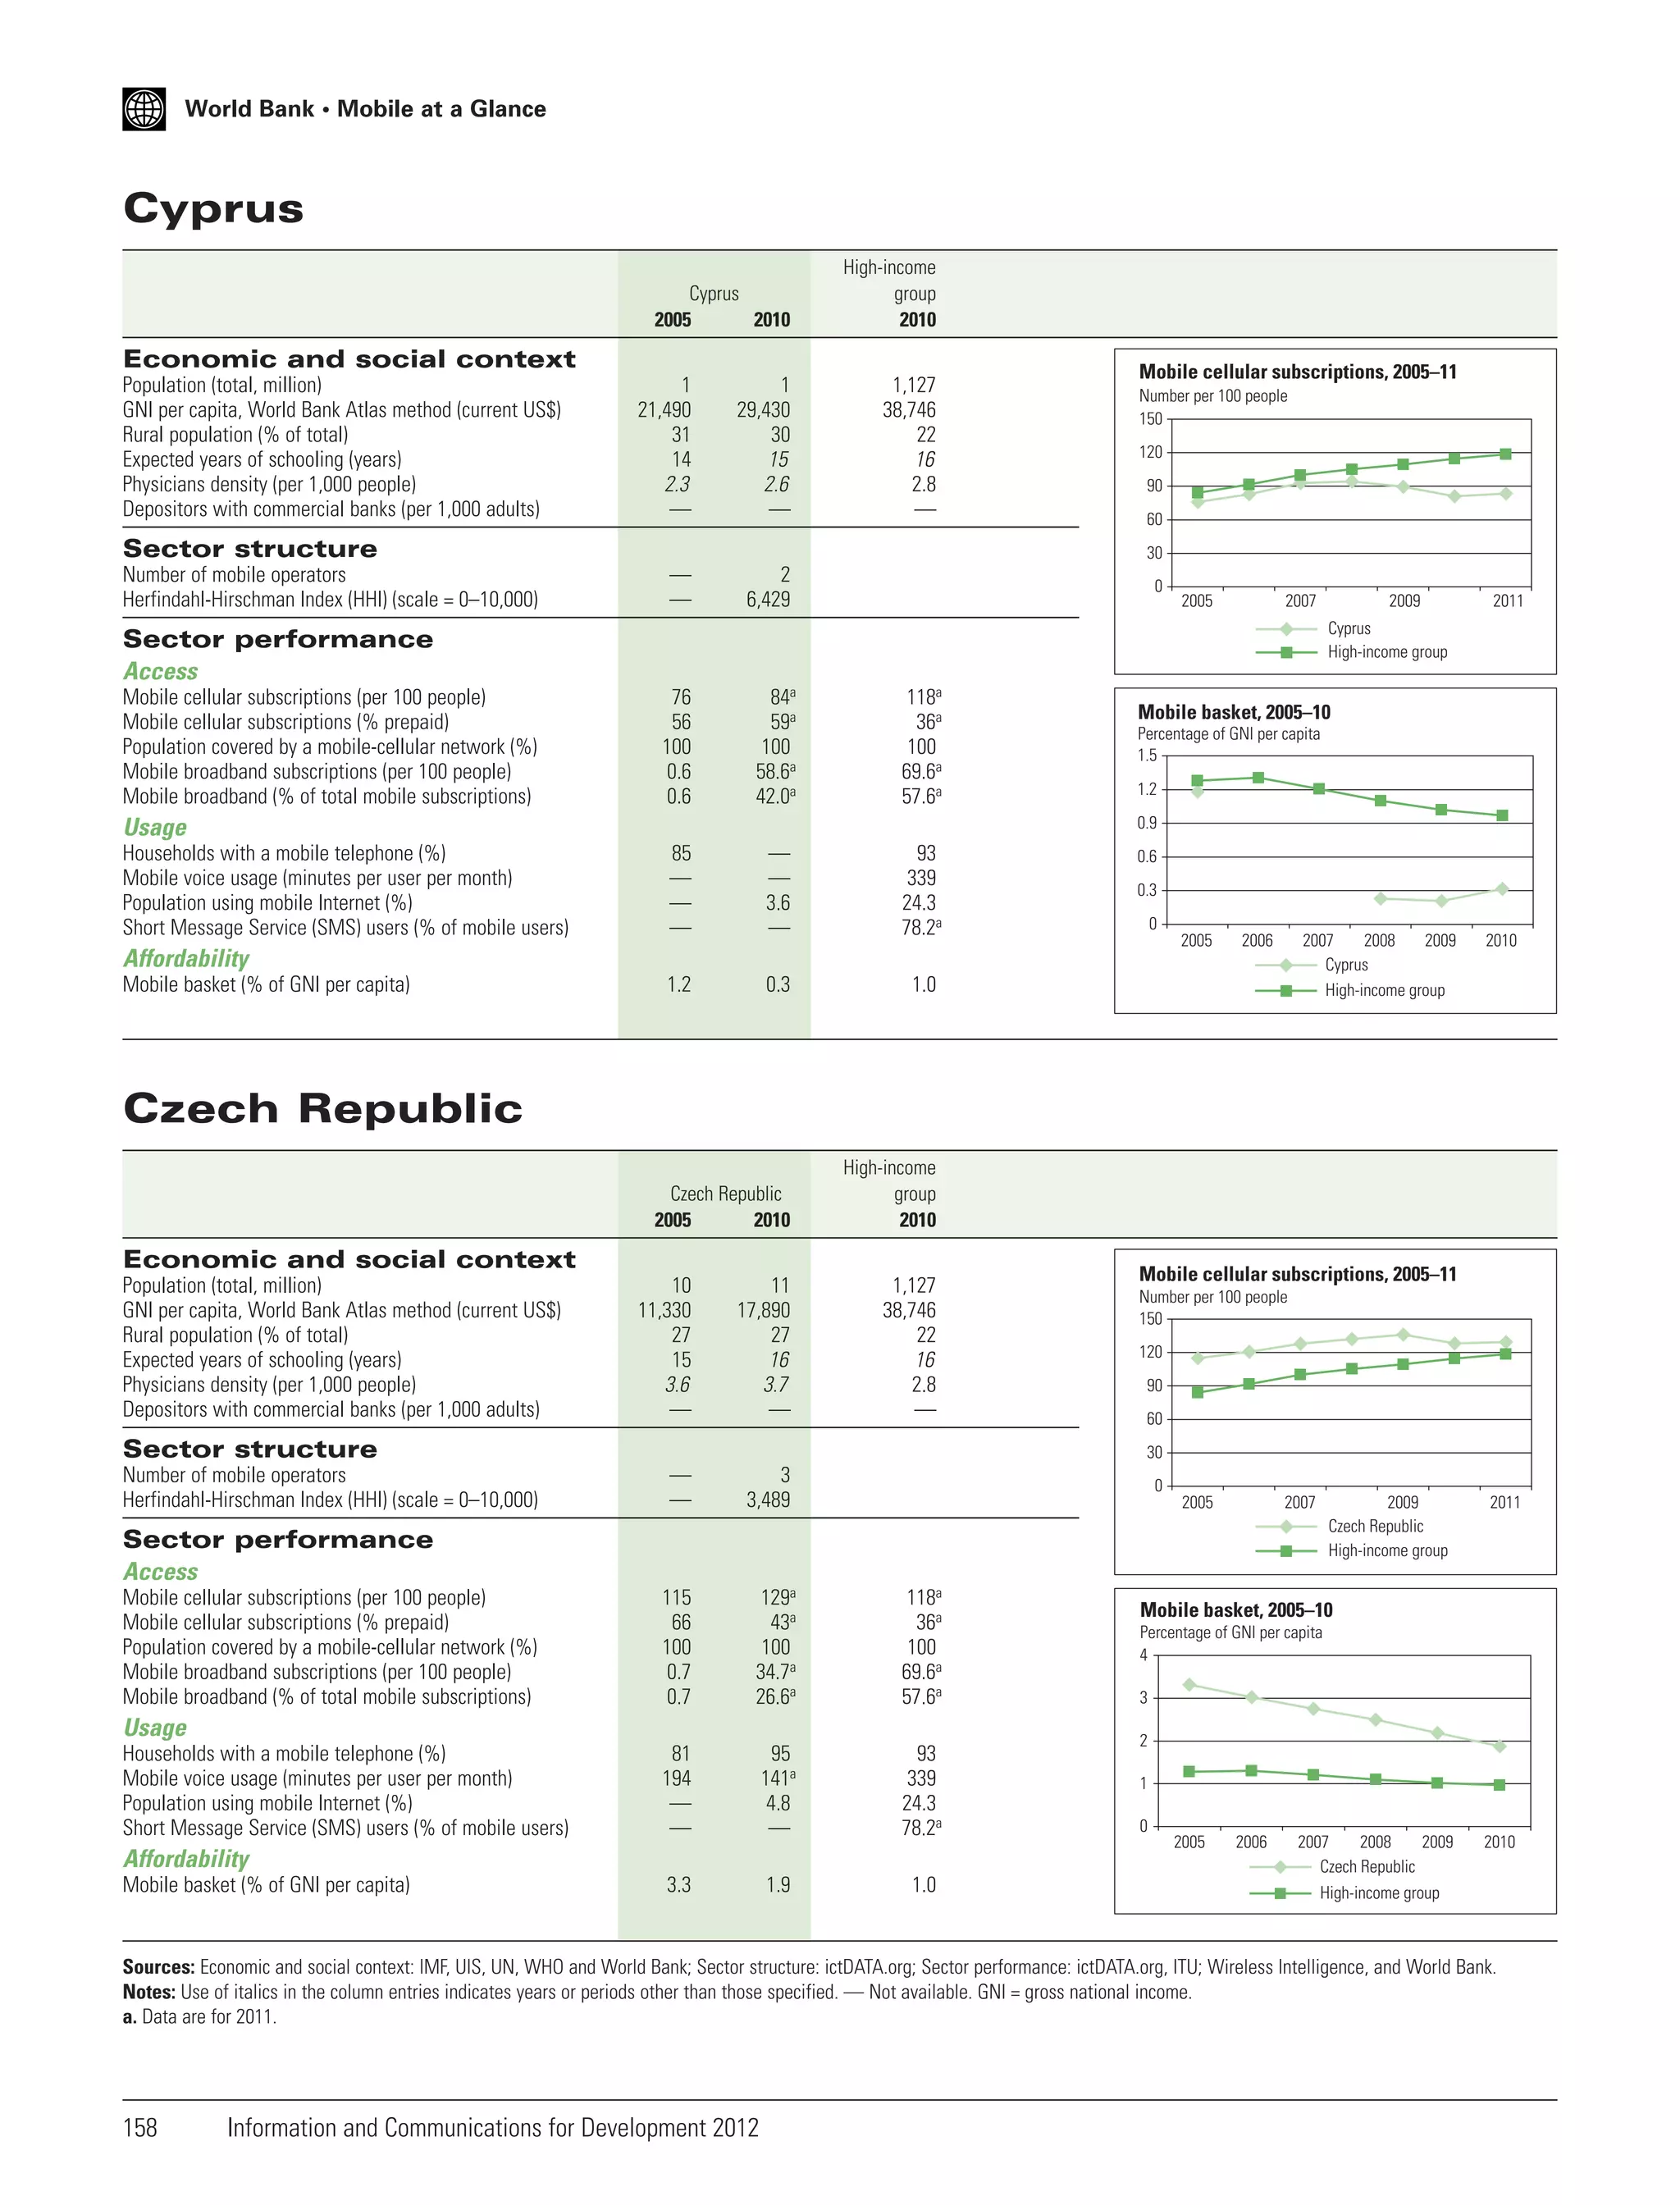
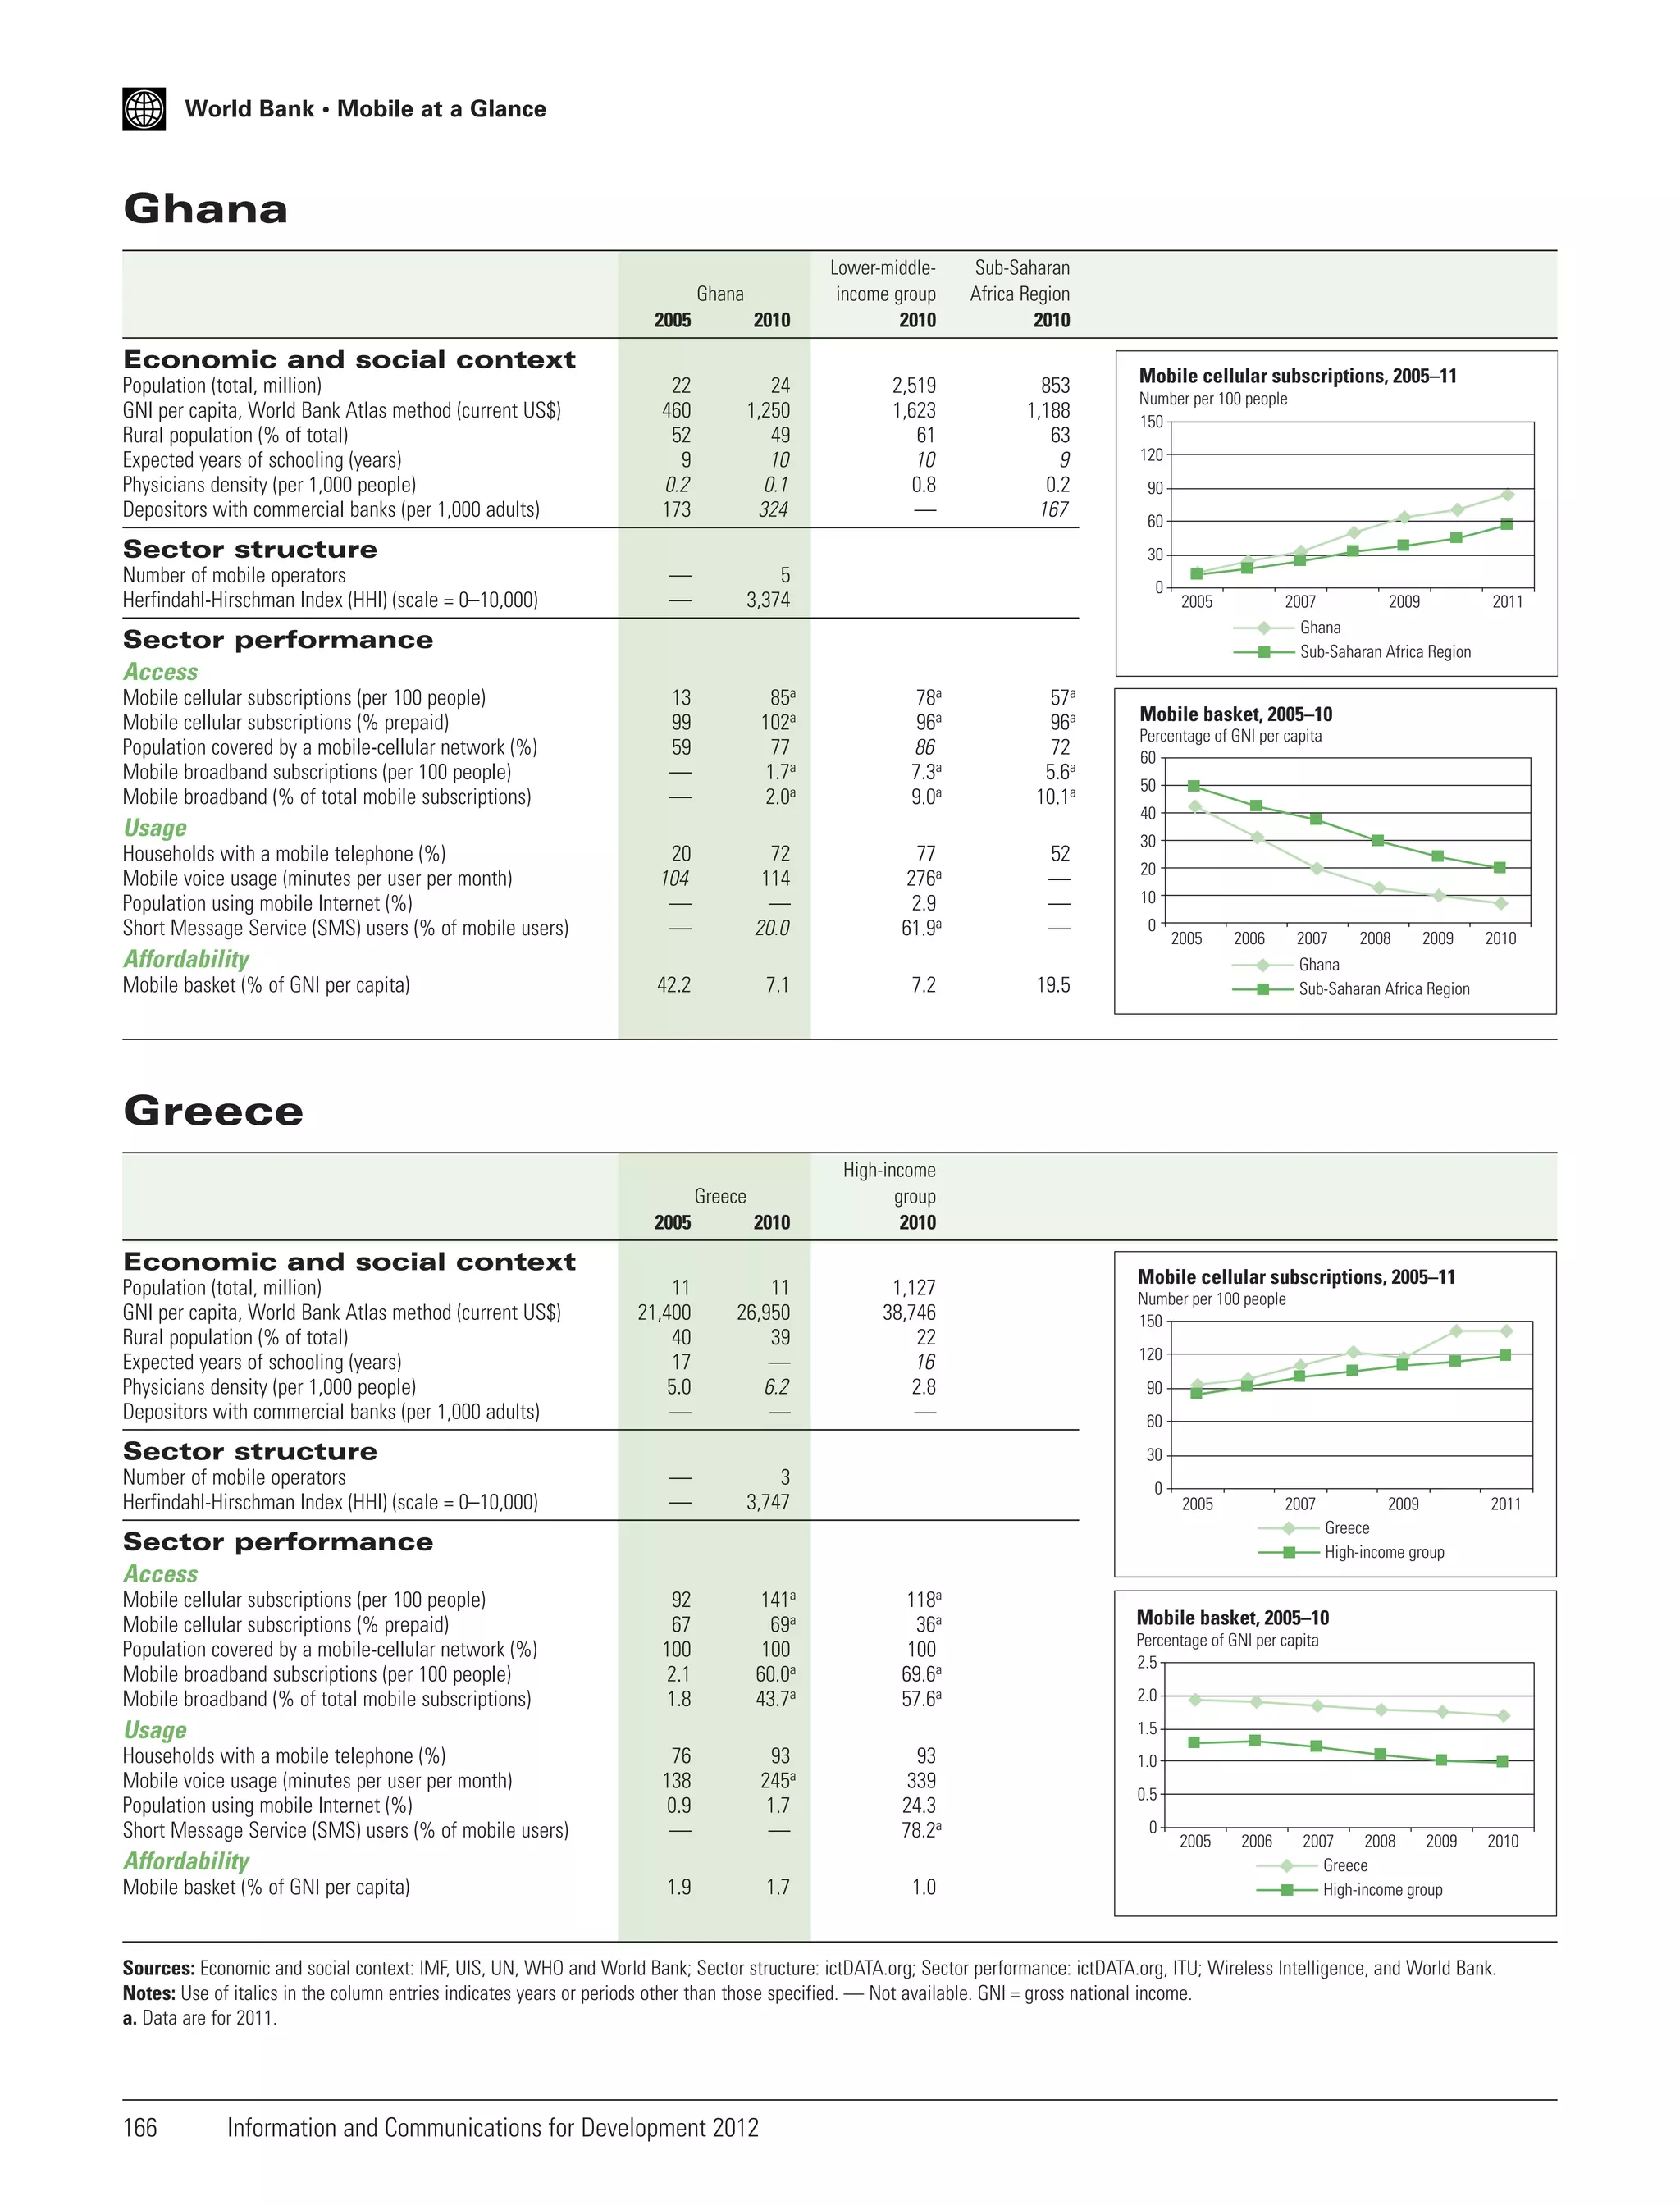
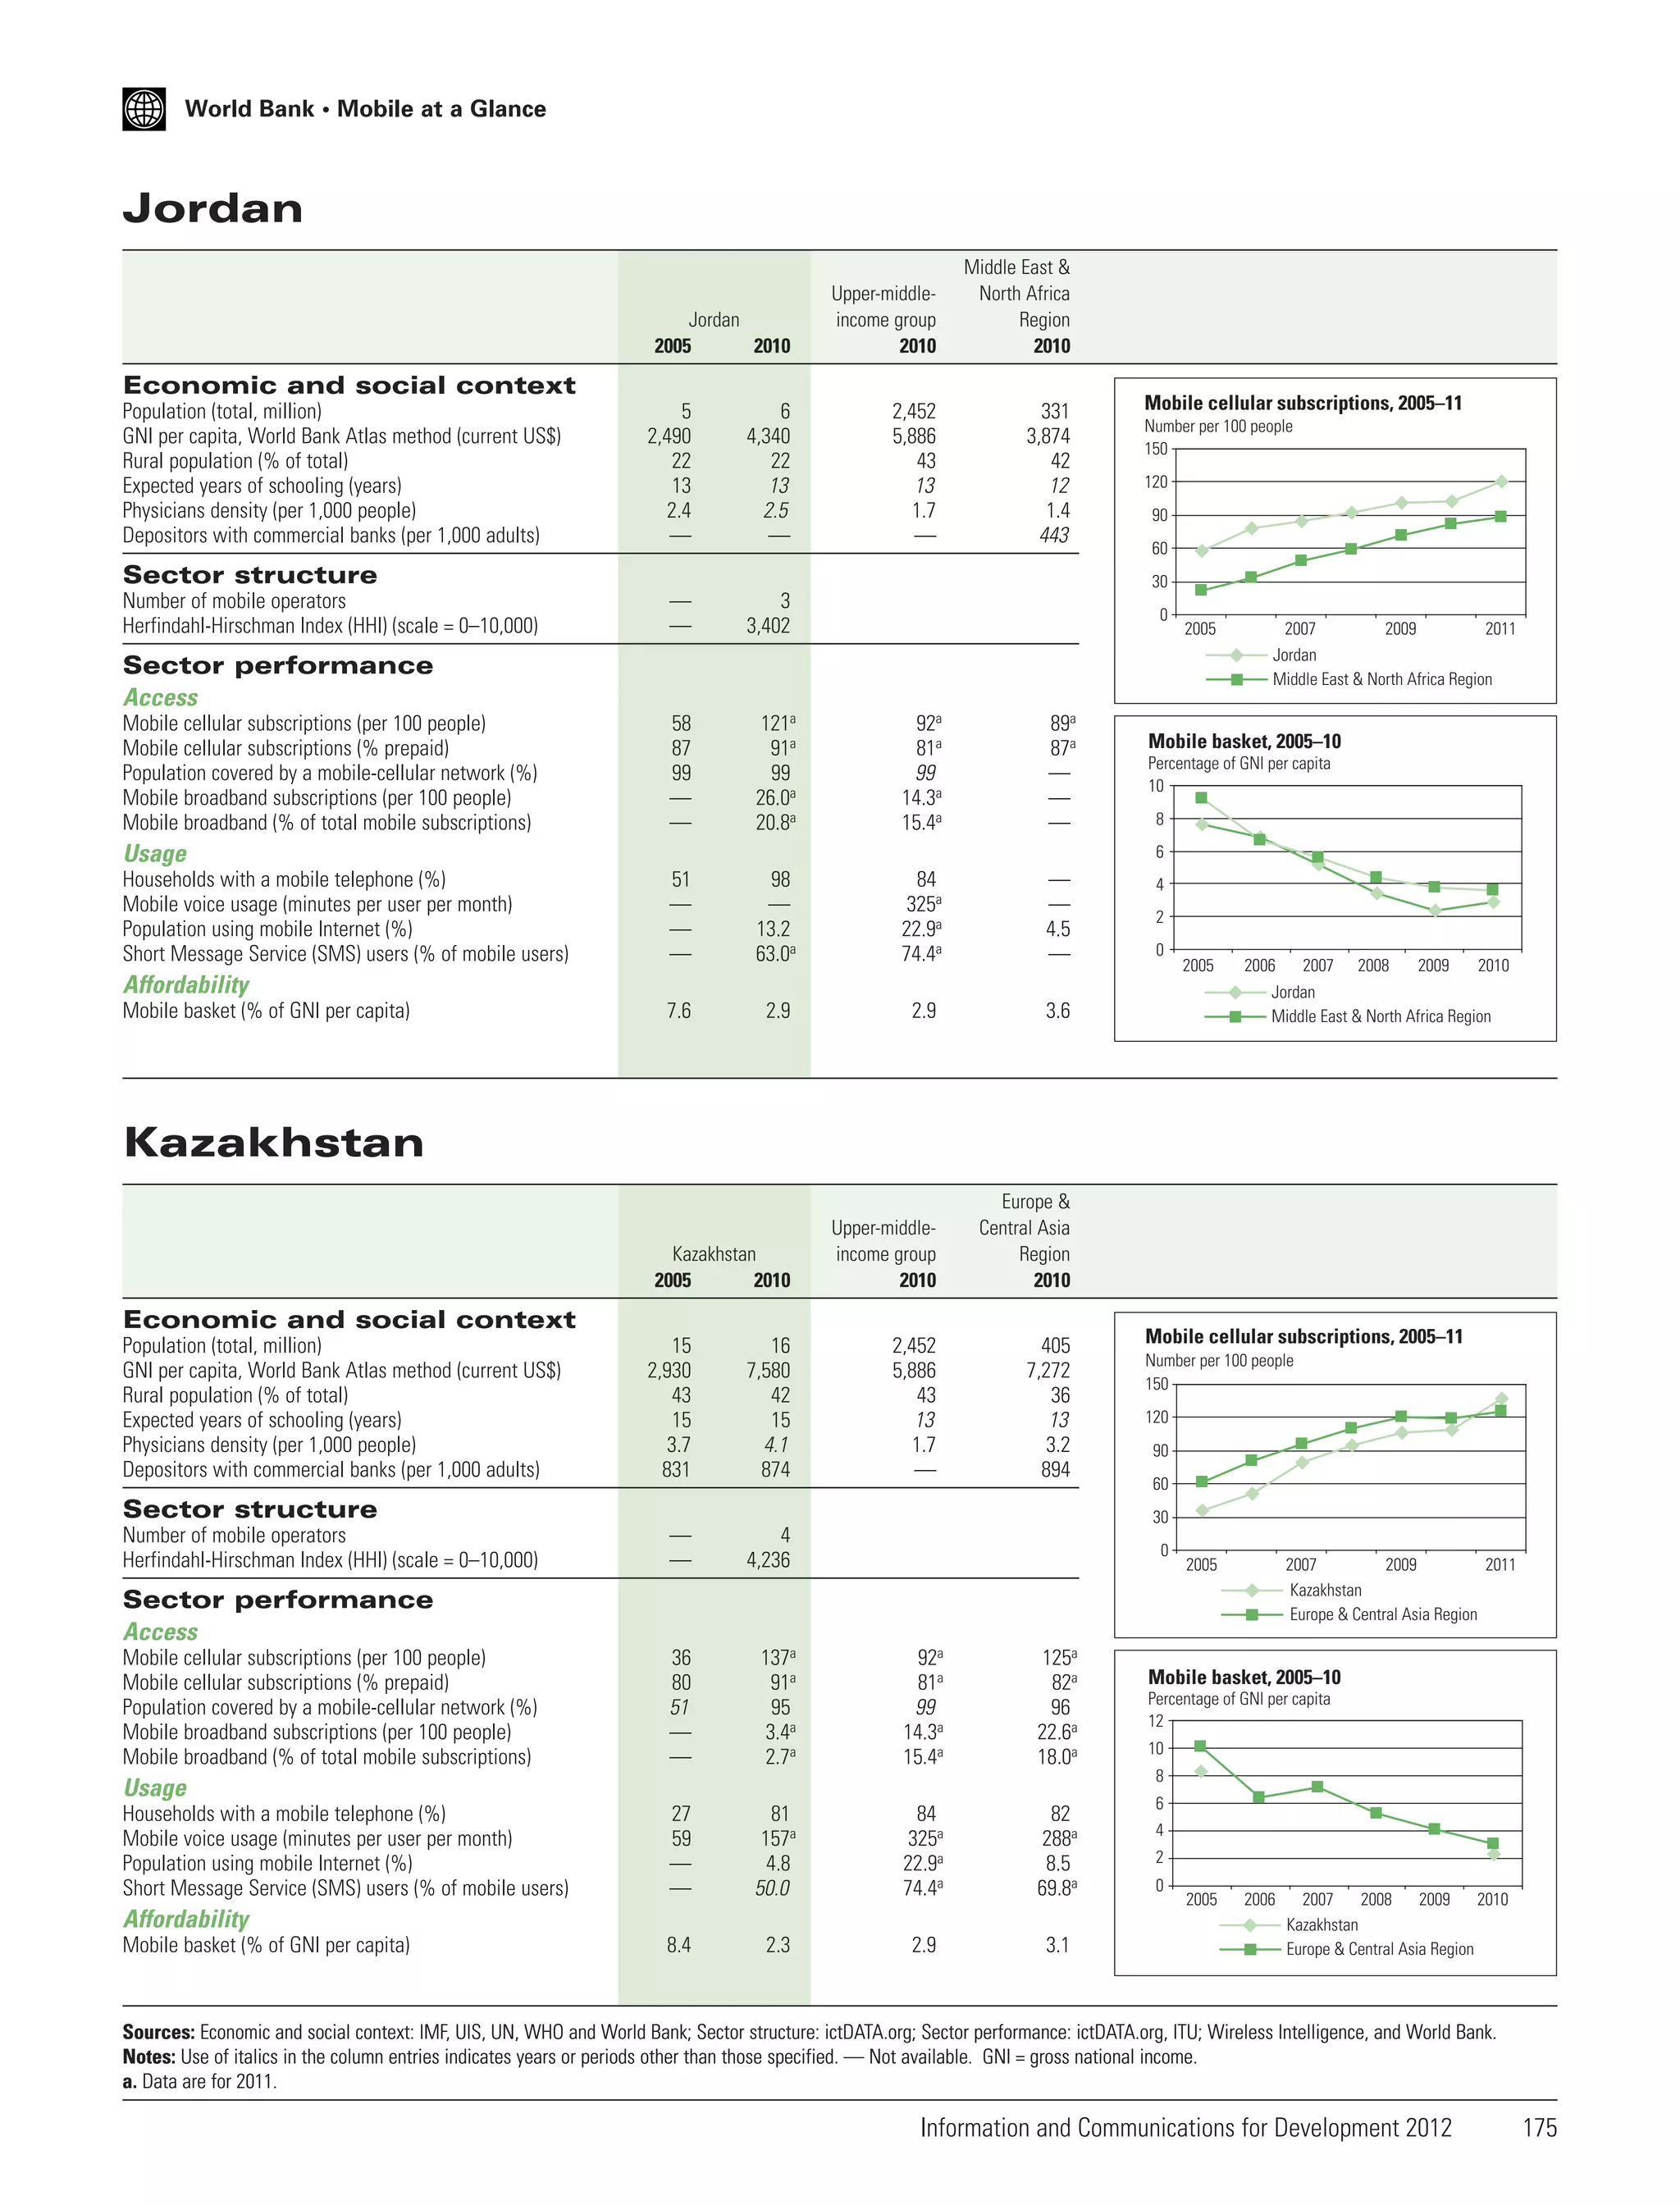
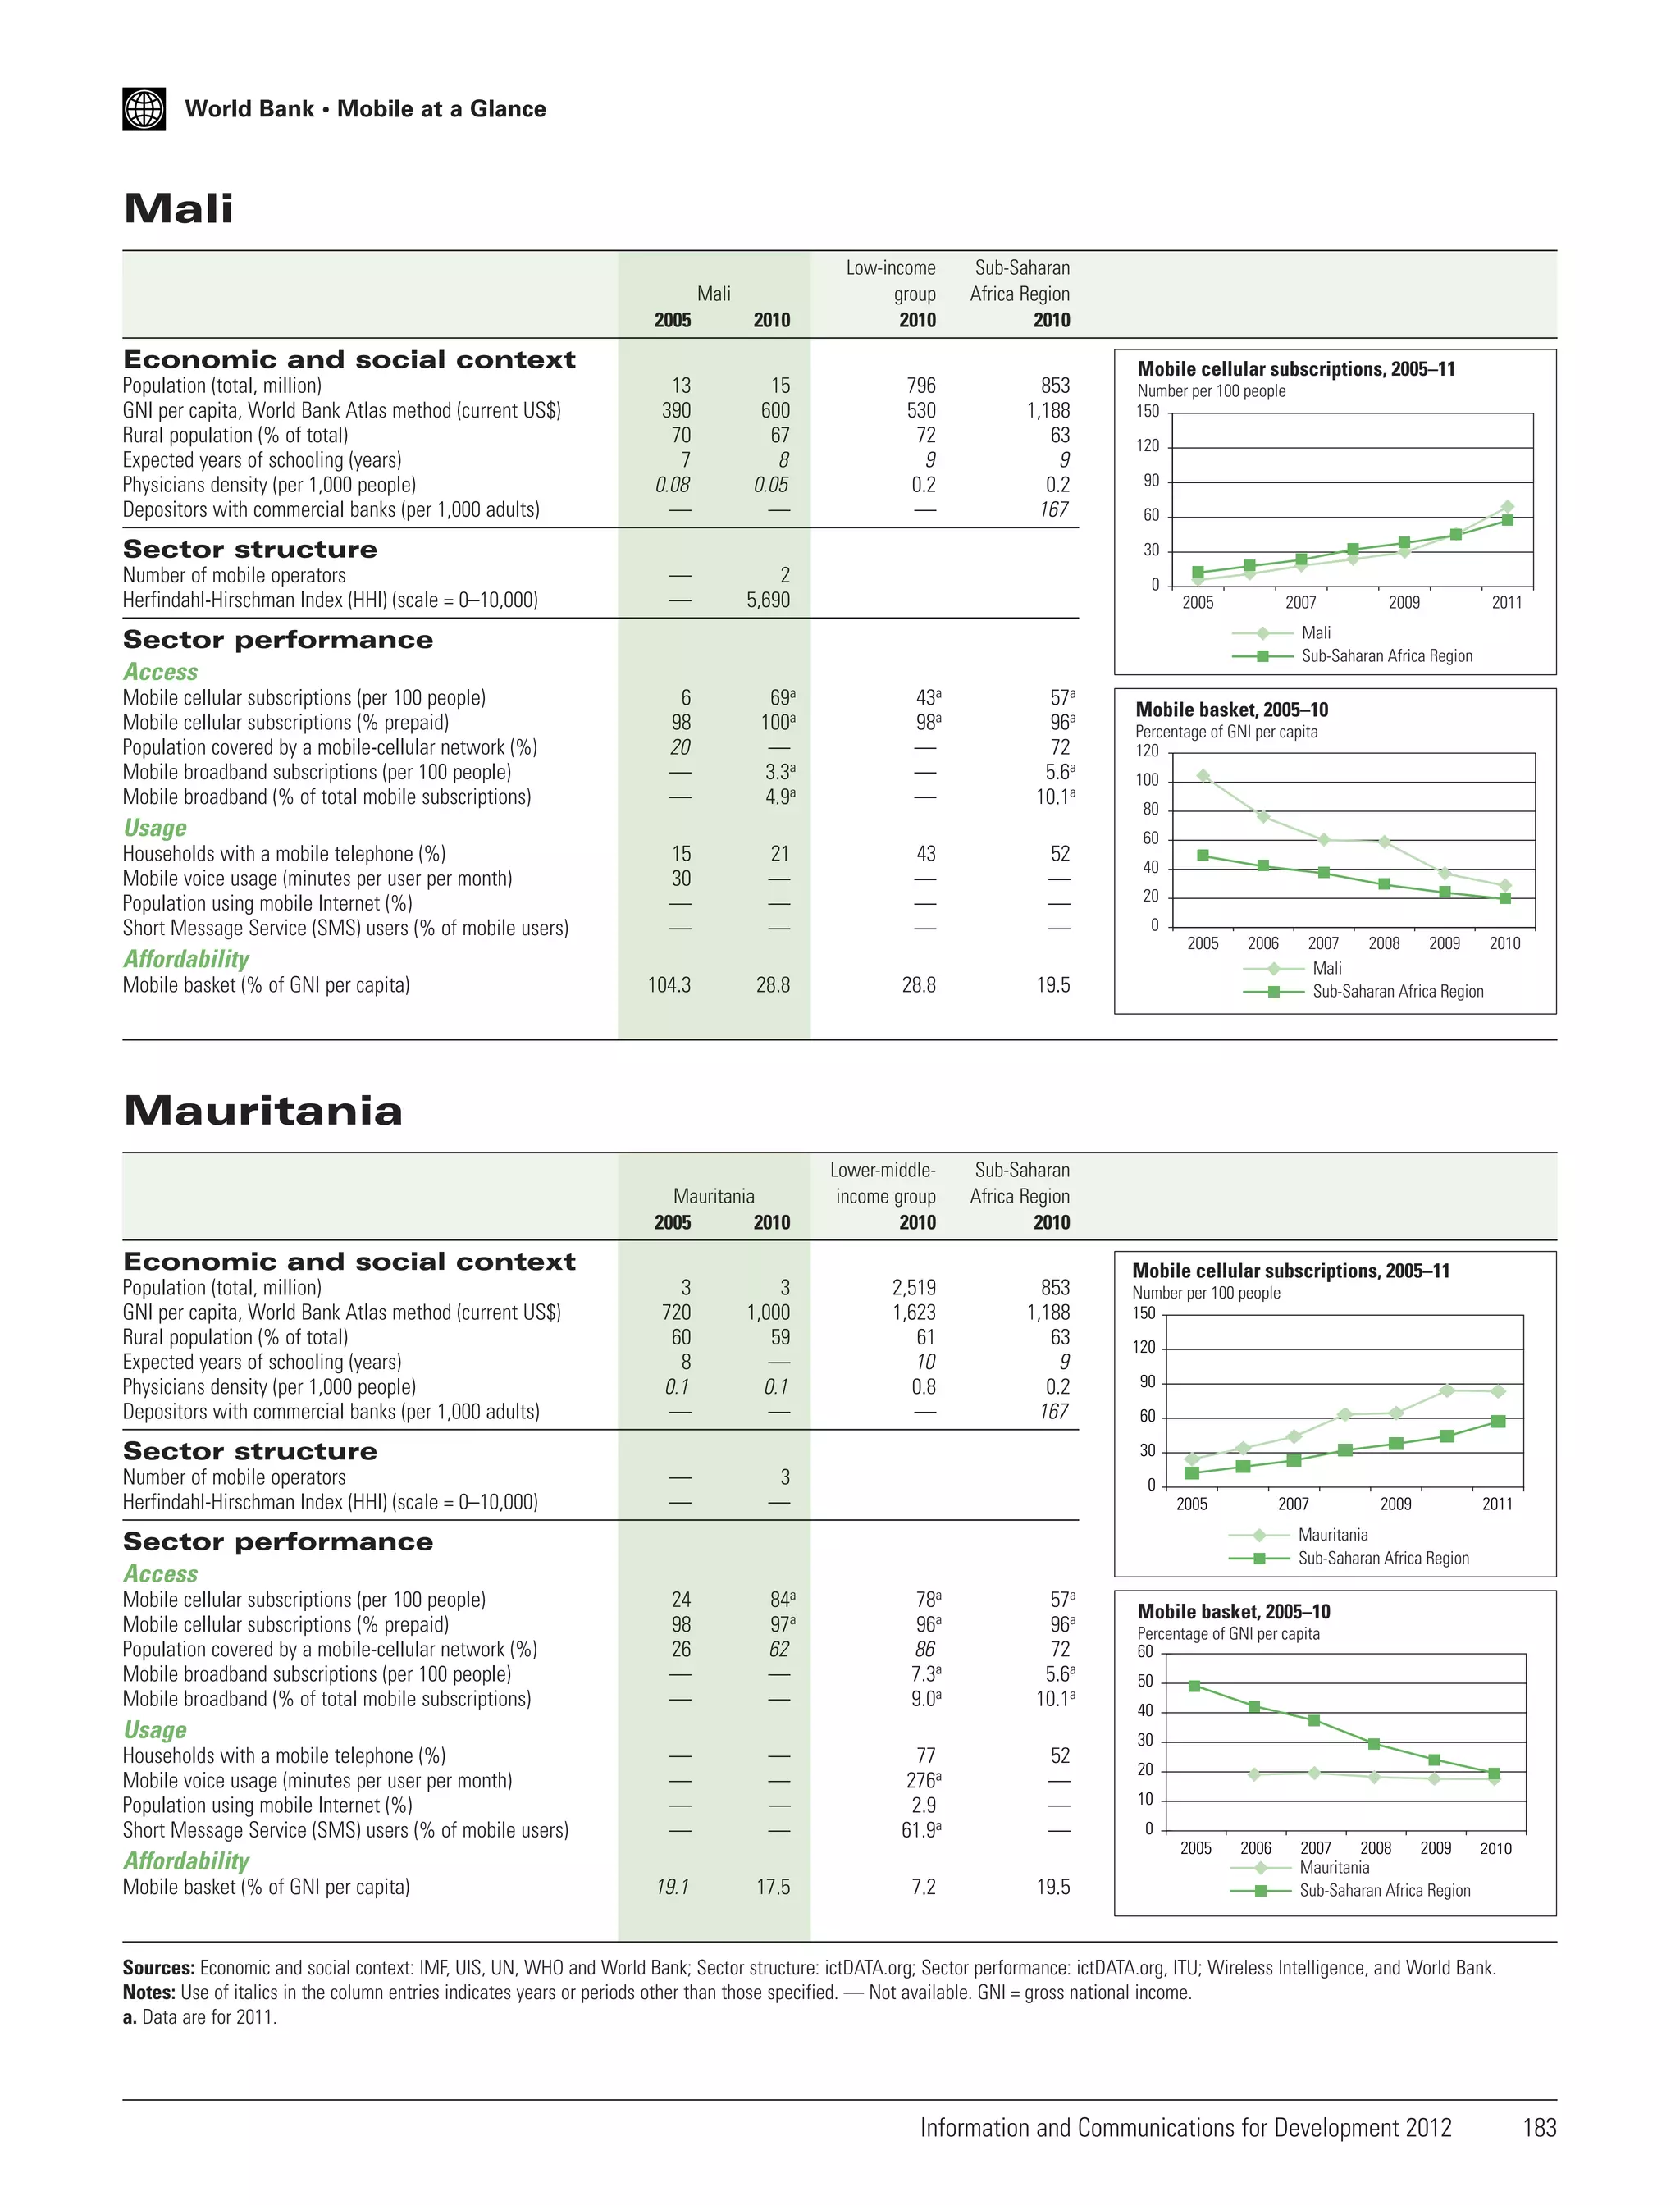
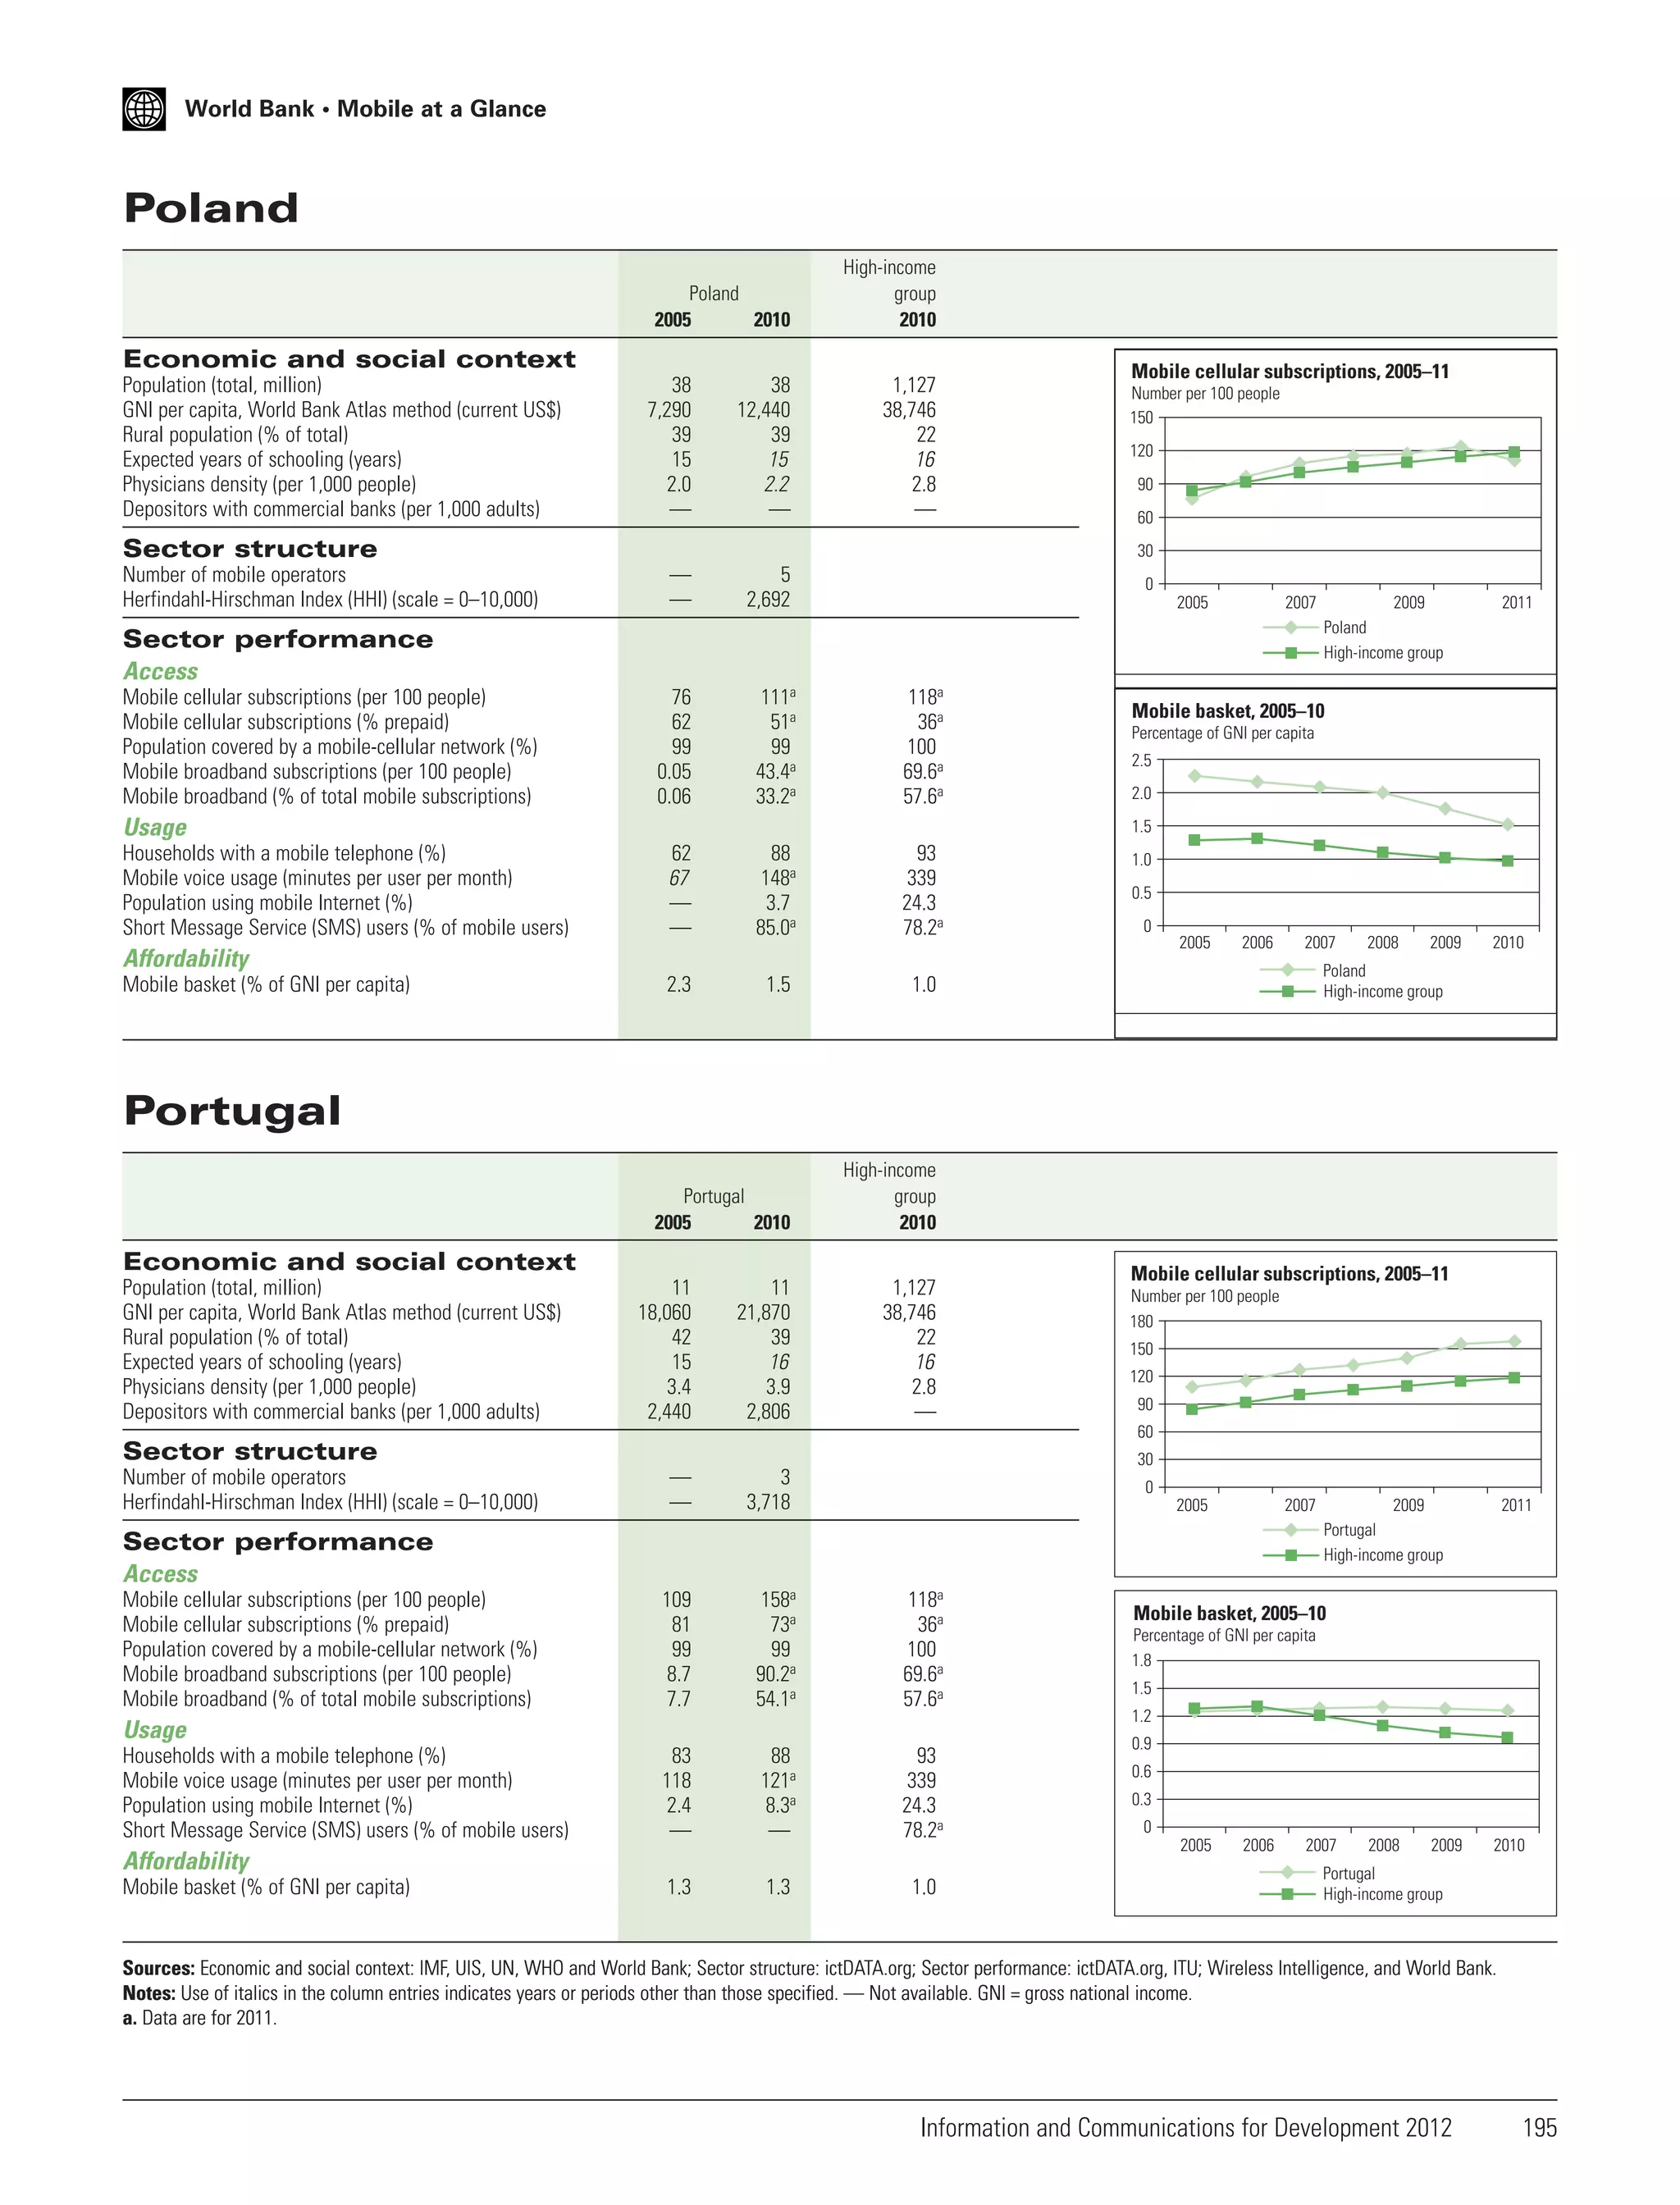
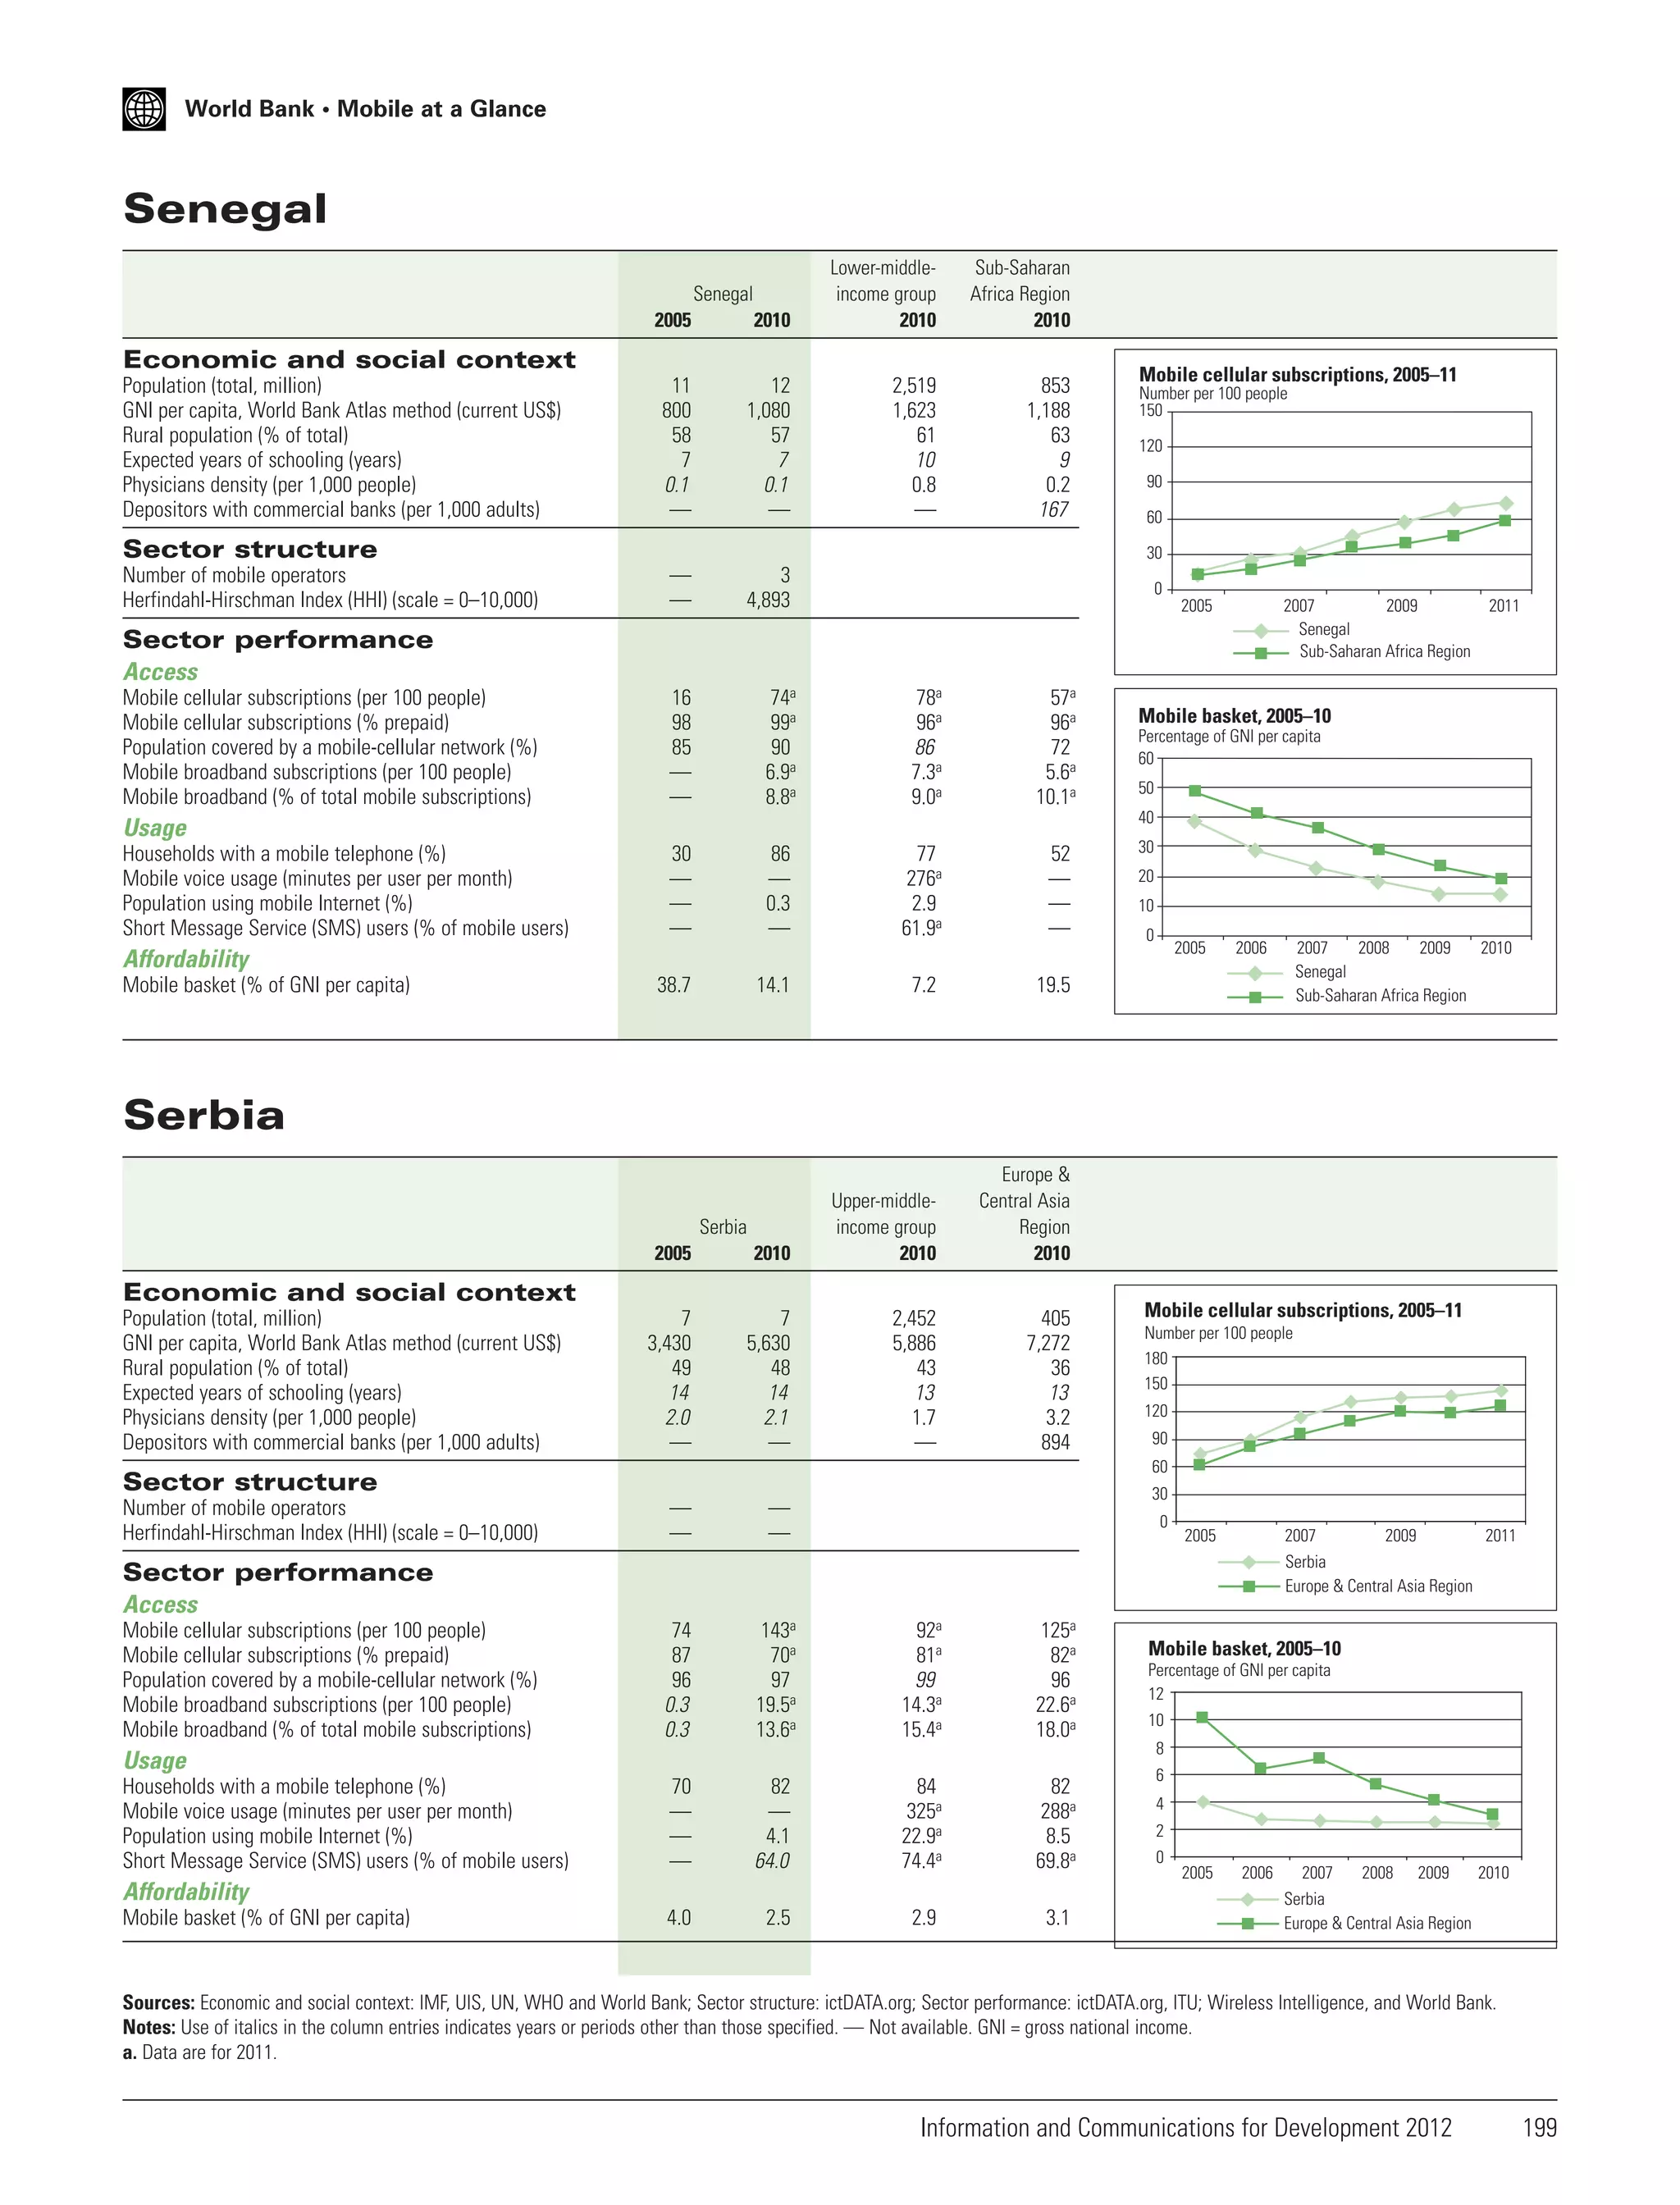
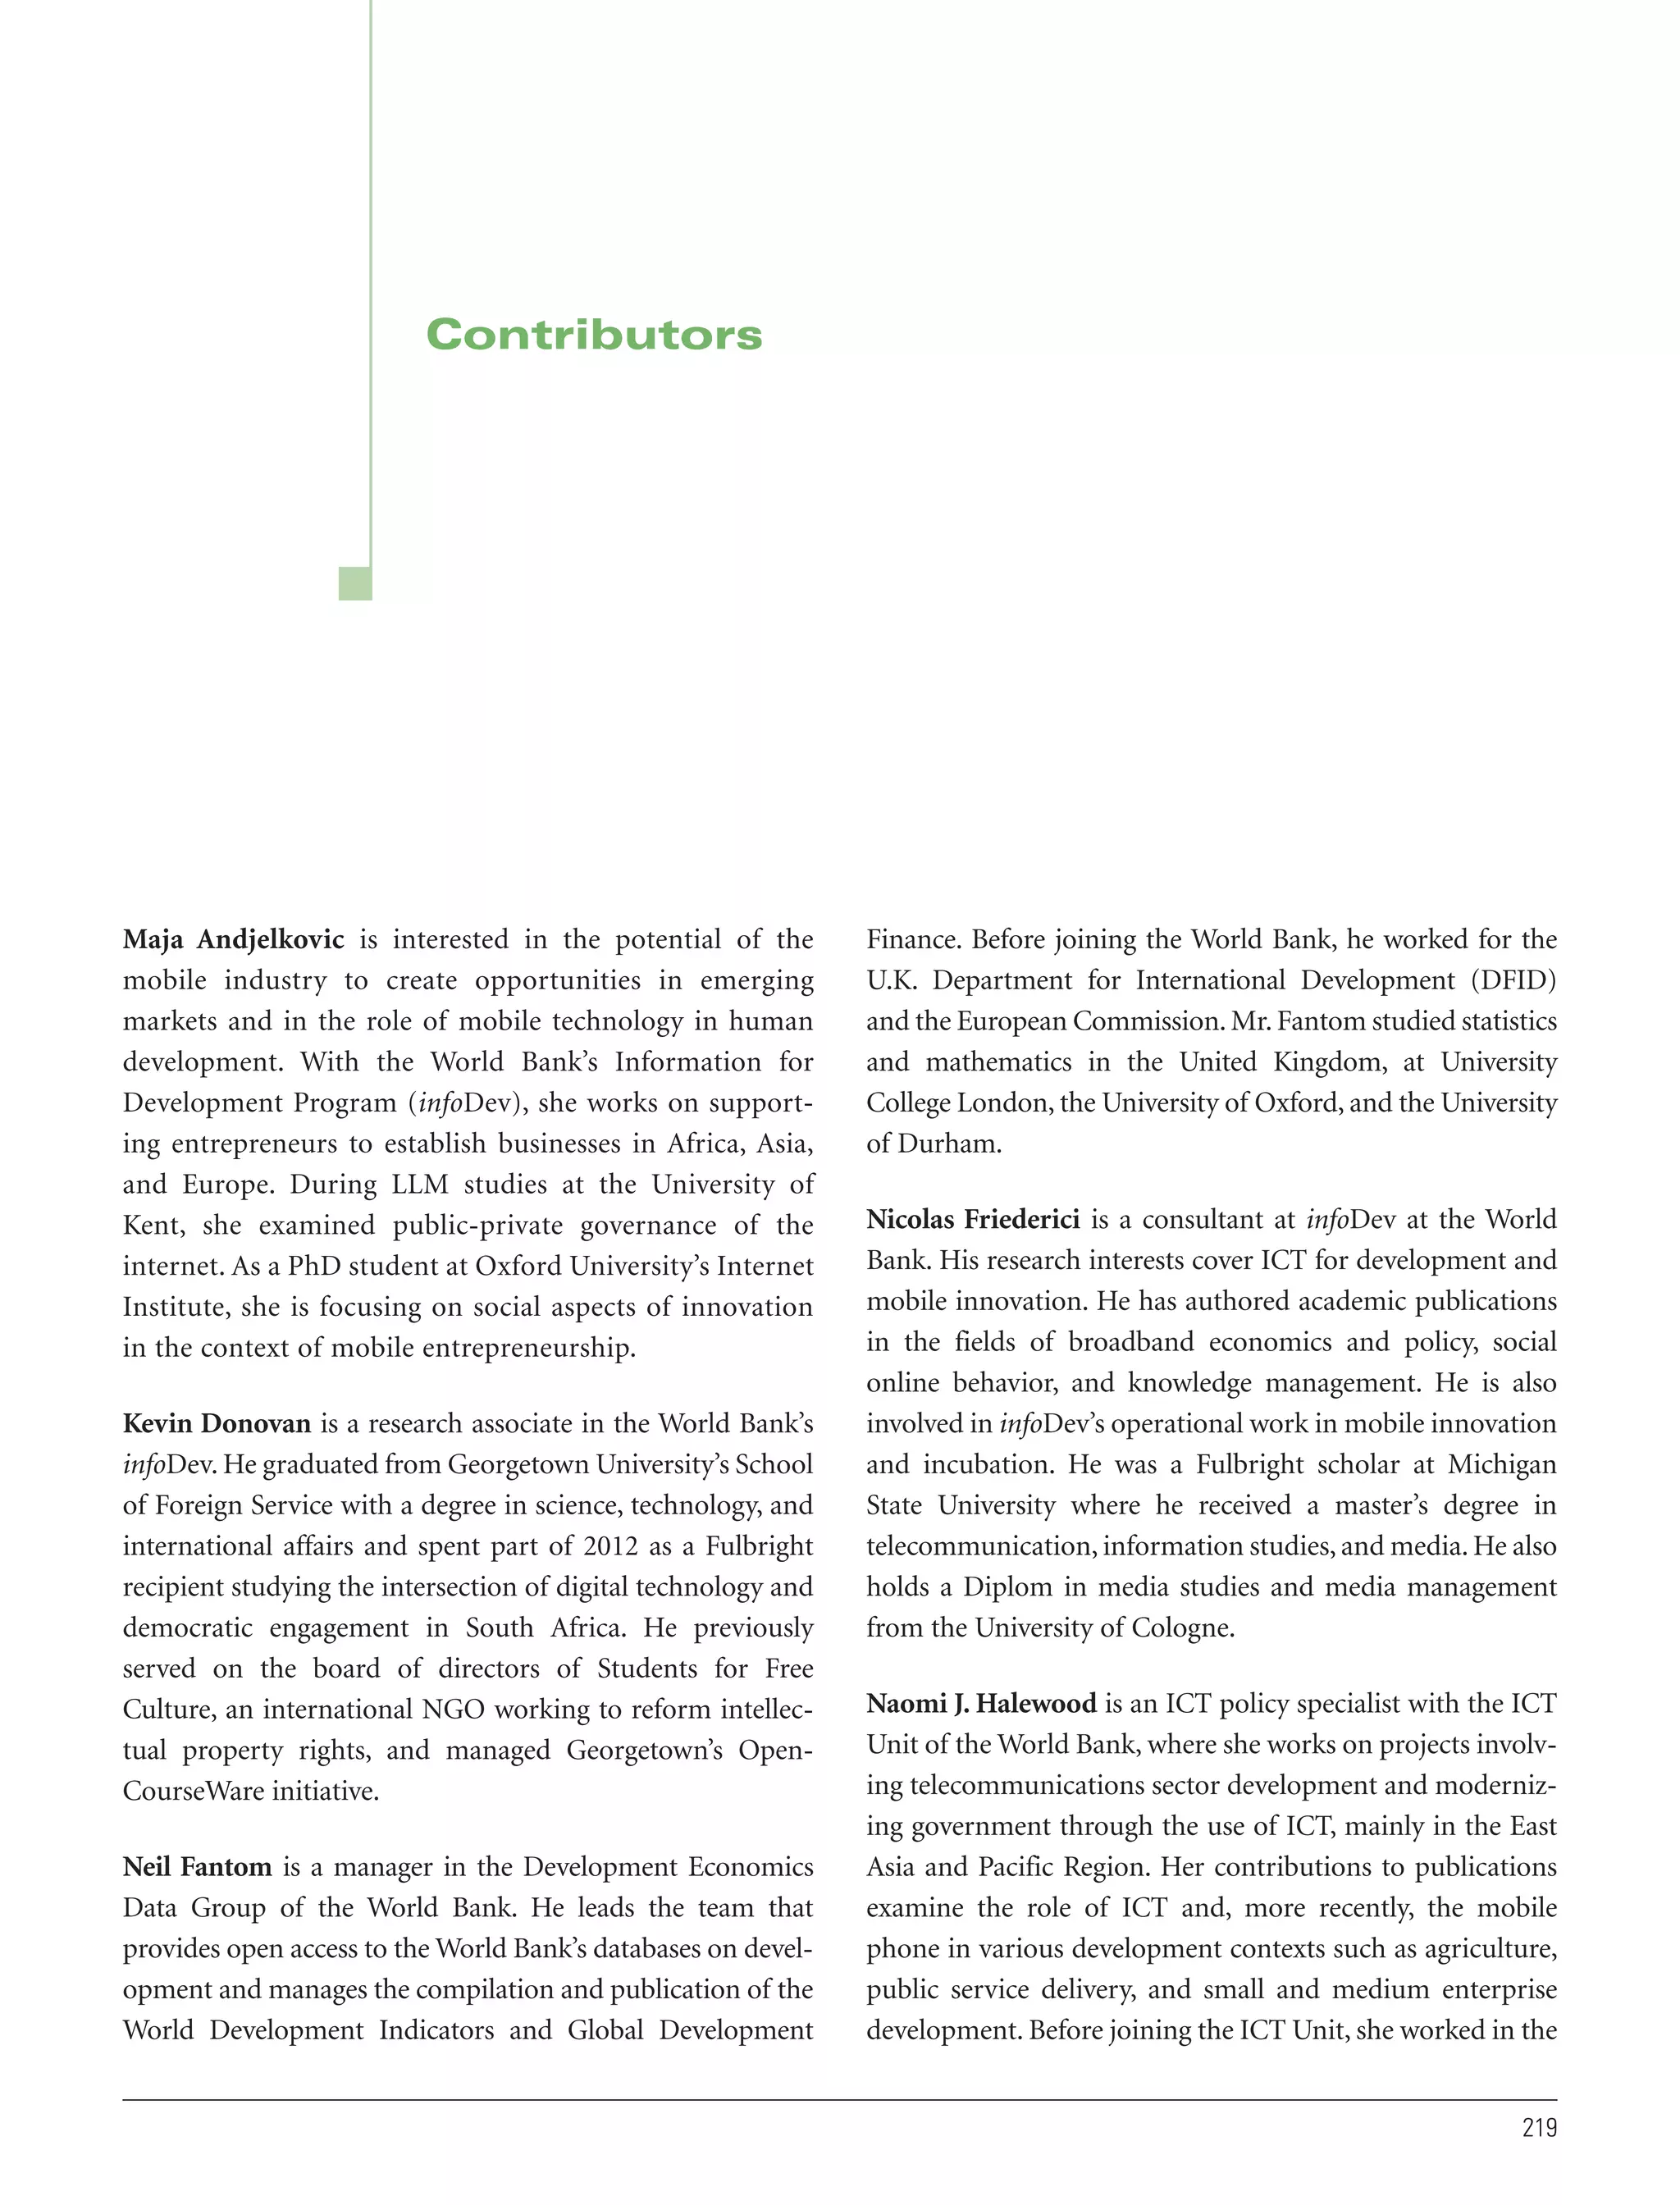
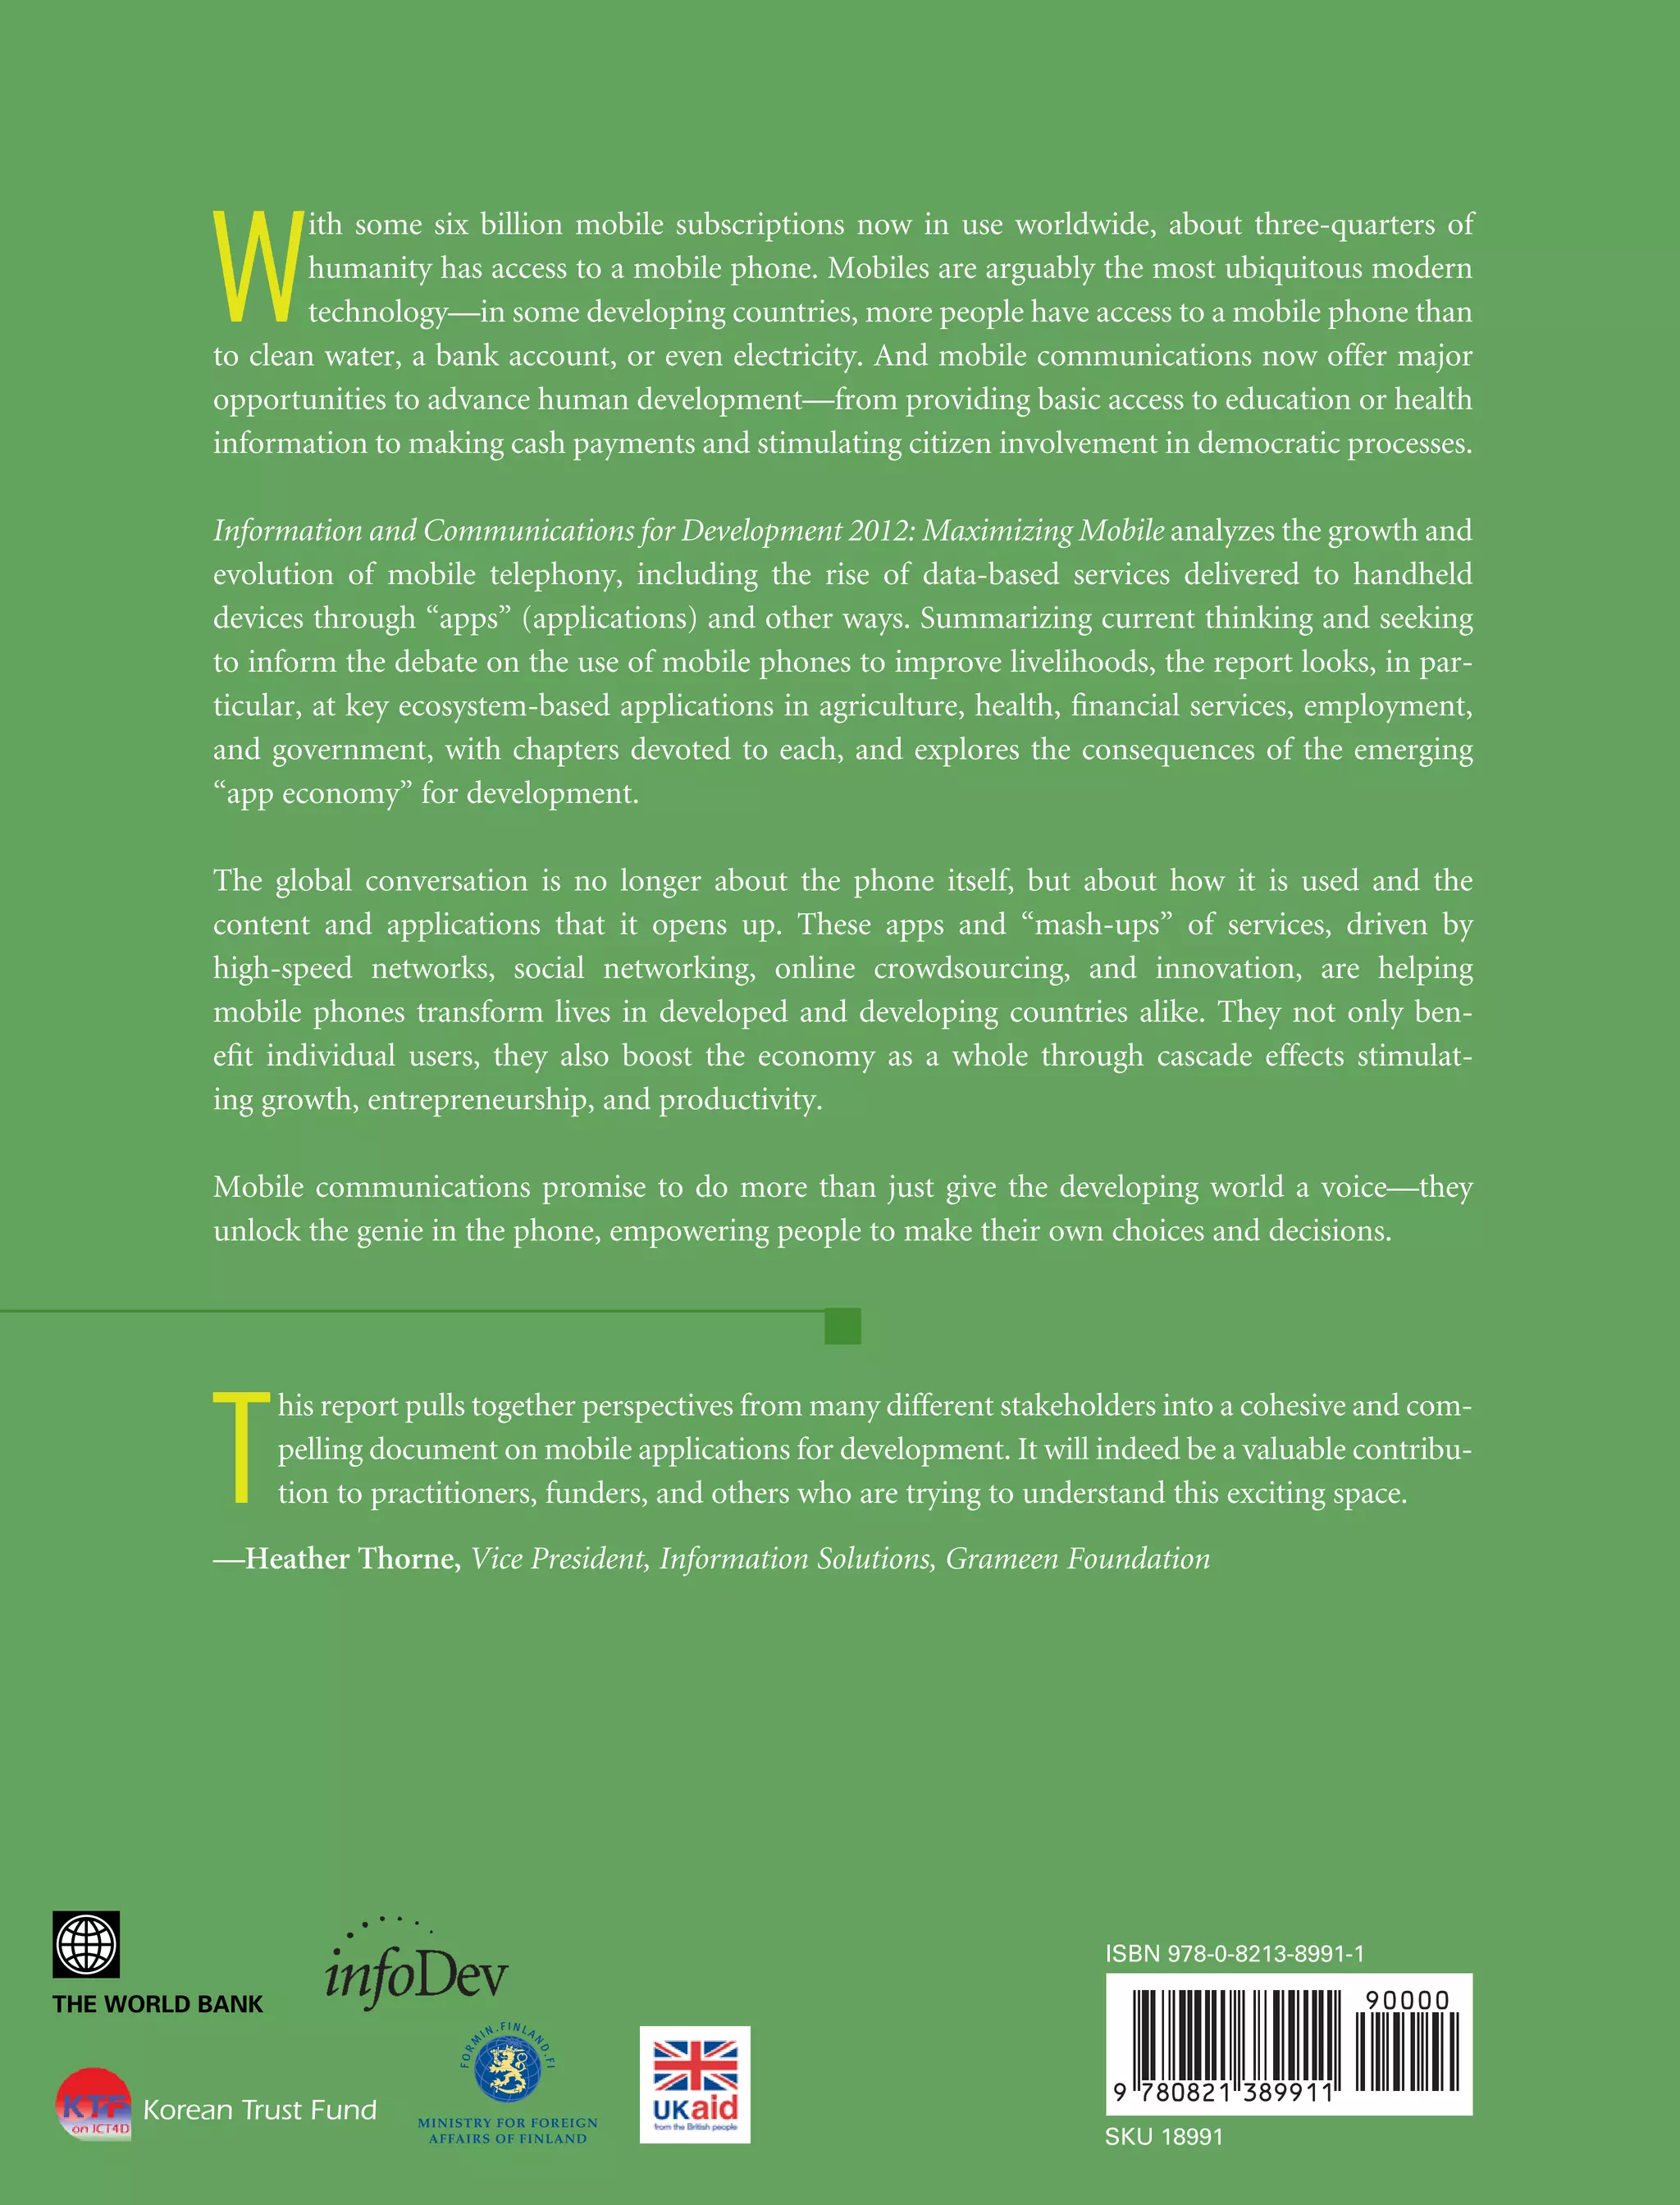
![Figure 1.9 Mobile phone versus internet access household availability
a. Household availability, 2009
100
97
b. Mobile phone usage, Egypt, 2011
95
90
Send text
messages
80
80
Percent
70
72
64
64
60
55
Take pictures or
video
50
58
40
30
23
21
20
15
Use the Internet
9
10
3
Mobile phone
Ye
me
n
t
Eg
yp
ria
Sy
a
Tu
nis
i
Ba
hr
a
in
0
0
20
40
60
80
Internet access
Sources: Gallup 2009; Pew Research Center 2011.
from cell phones to the Al-Jazeera news organization during
the Egyptian protests.23
Although governments can try to restrict access to the
internet and mobile networks, they may pay a heavy price.
The Organisation for Economic Co-operation and Development (OECD 2011) estimated that the direct costs to the
Egyptian government of shutting down the internet and
mobile phone networks during demonstrations was
$18 million a day, with a much wider economic impact when
factoring in industries such as eCommerce, tourism, and business process outsourcing. Restricting access also tends to have
a reverse effect: according to a survey of Egyptian and
Tunisian citizens, blocking networks causes “people to be more
active, [and] decisive and to find ways to be more creative
about communicating and organizing even more” (Dubai
School of Government 2011). Short of a complete shutdown,
users can find workarounds to blocked applications by using
proxies; if close enough, they can also pick up cellular signals
from neighboring countries. Intriguingly, some of the countries identified as having the heaviest internet restrictions were
also those where social-media-driven demonstrations have
taken place (Reporters Without Borders 2009).
Structure of the report
The rest of this report explores these themes in more detail.
The report distills work carried out by the World Bank
Group and its development partners since the last edition of
this report, in 2009, with a particular focus on mobile applications for development. Chapters 2, 3, and 4 have a sectoral
focus on the use of mobile applications in agriculture and
rural development, health, and financial services respectively. Chapters 5 and 6 are cross-cutting, looking at how
mobile communications are contributing to entrepreneurship and employment and how they are being used to bring
citizens and government closer together. Finally, chapter 7
looks at the shift from narrowband to broadband mobile
networks and the policy implications involved. The Statistical Appendix provides an overview of recent trends in the
mobile sector and introduces a new analytical tool. The
Country Tables at the end of the report provide an at-aglance view of the status of mobile communications in
World Bank member countries.
Notes
1. “[Y]oung people around the world are more immersed in
mobile technology than any previous generation.” See Nielsen
2010.
2. http://www.cisco.com/en/US/solutions/collateral/ns341/
ns525/ns537/ns705/ns827/white_paper_c11-520862.html.
3. h t t p : / / w w w. s e c . g ov / Arch ive s / e d g a r / d a t a / 1 4 9 8 2 0 9 /
000119312510182561/ds1.htm.
4. A “tweet” is 140 characters (compared to 160 characters for an
SMS).
5. For mobile users of Twitter growth in 2010, see http://blog
.twitter.com/2011/03/numbers.html.
Overview
27](https://image.slidesharecdn.com/random-140112120019-phpapp01/75/2012-47-2048.jpg)
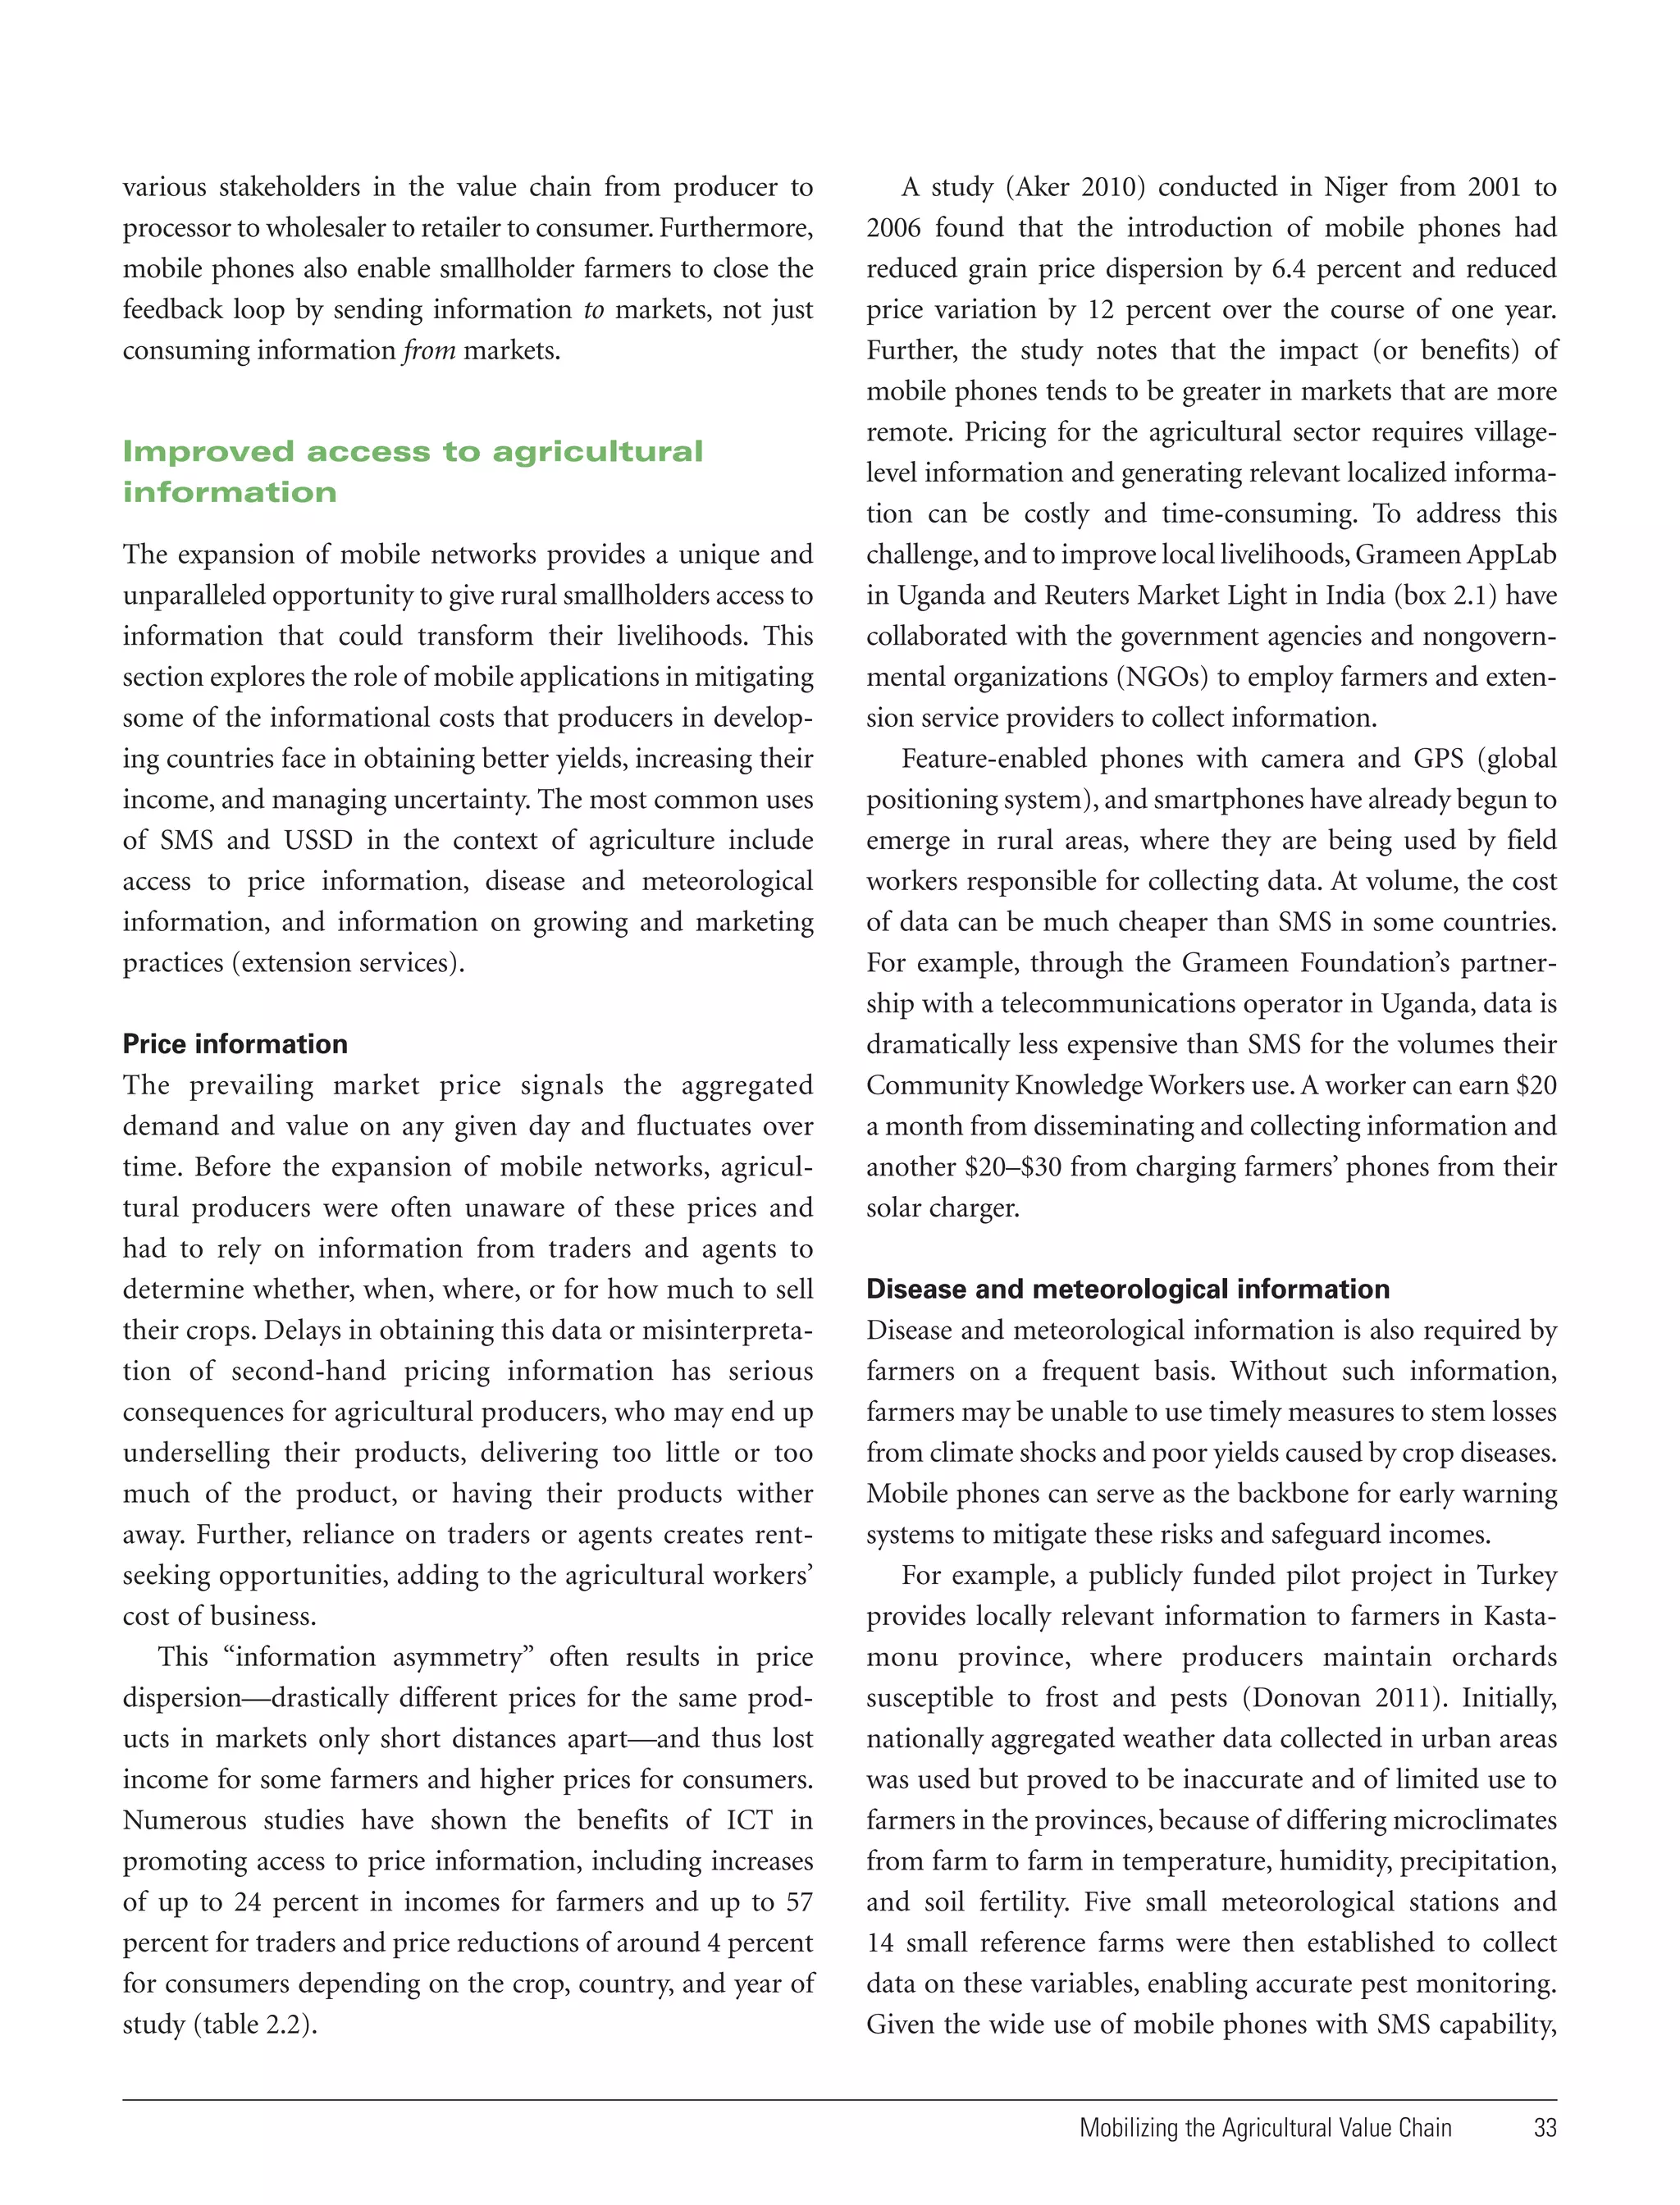

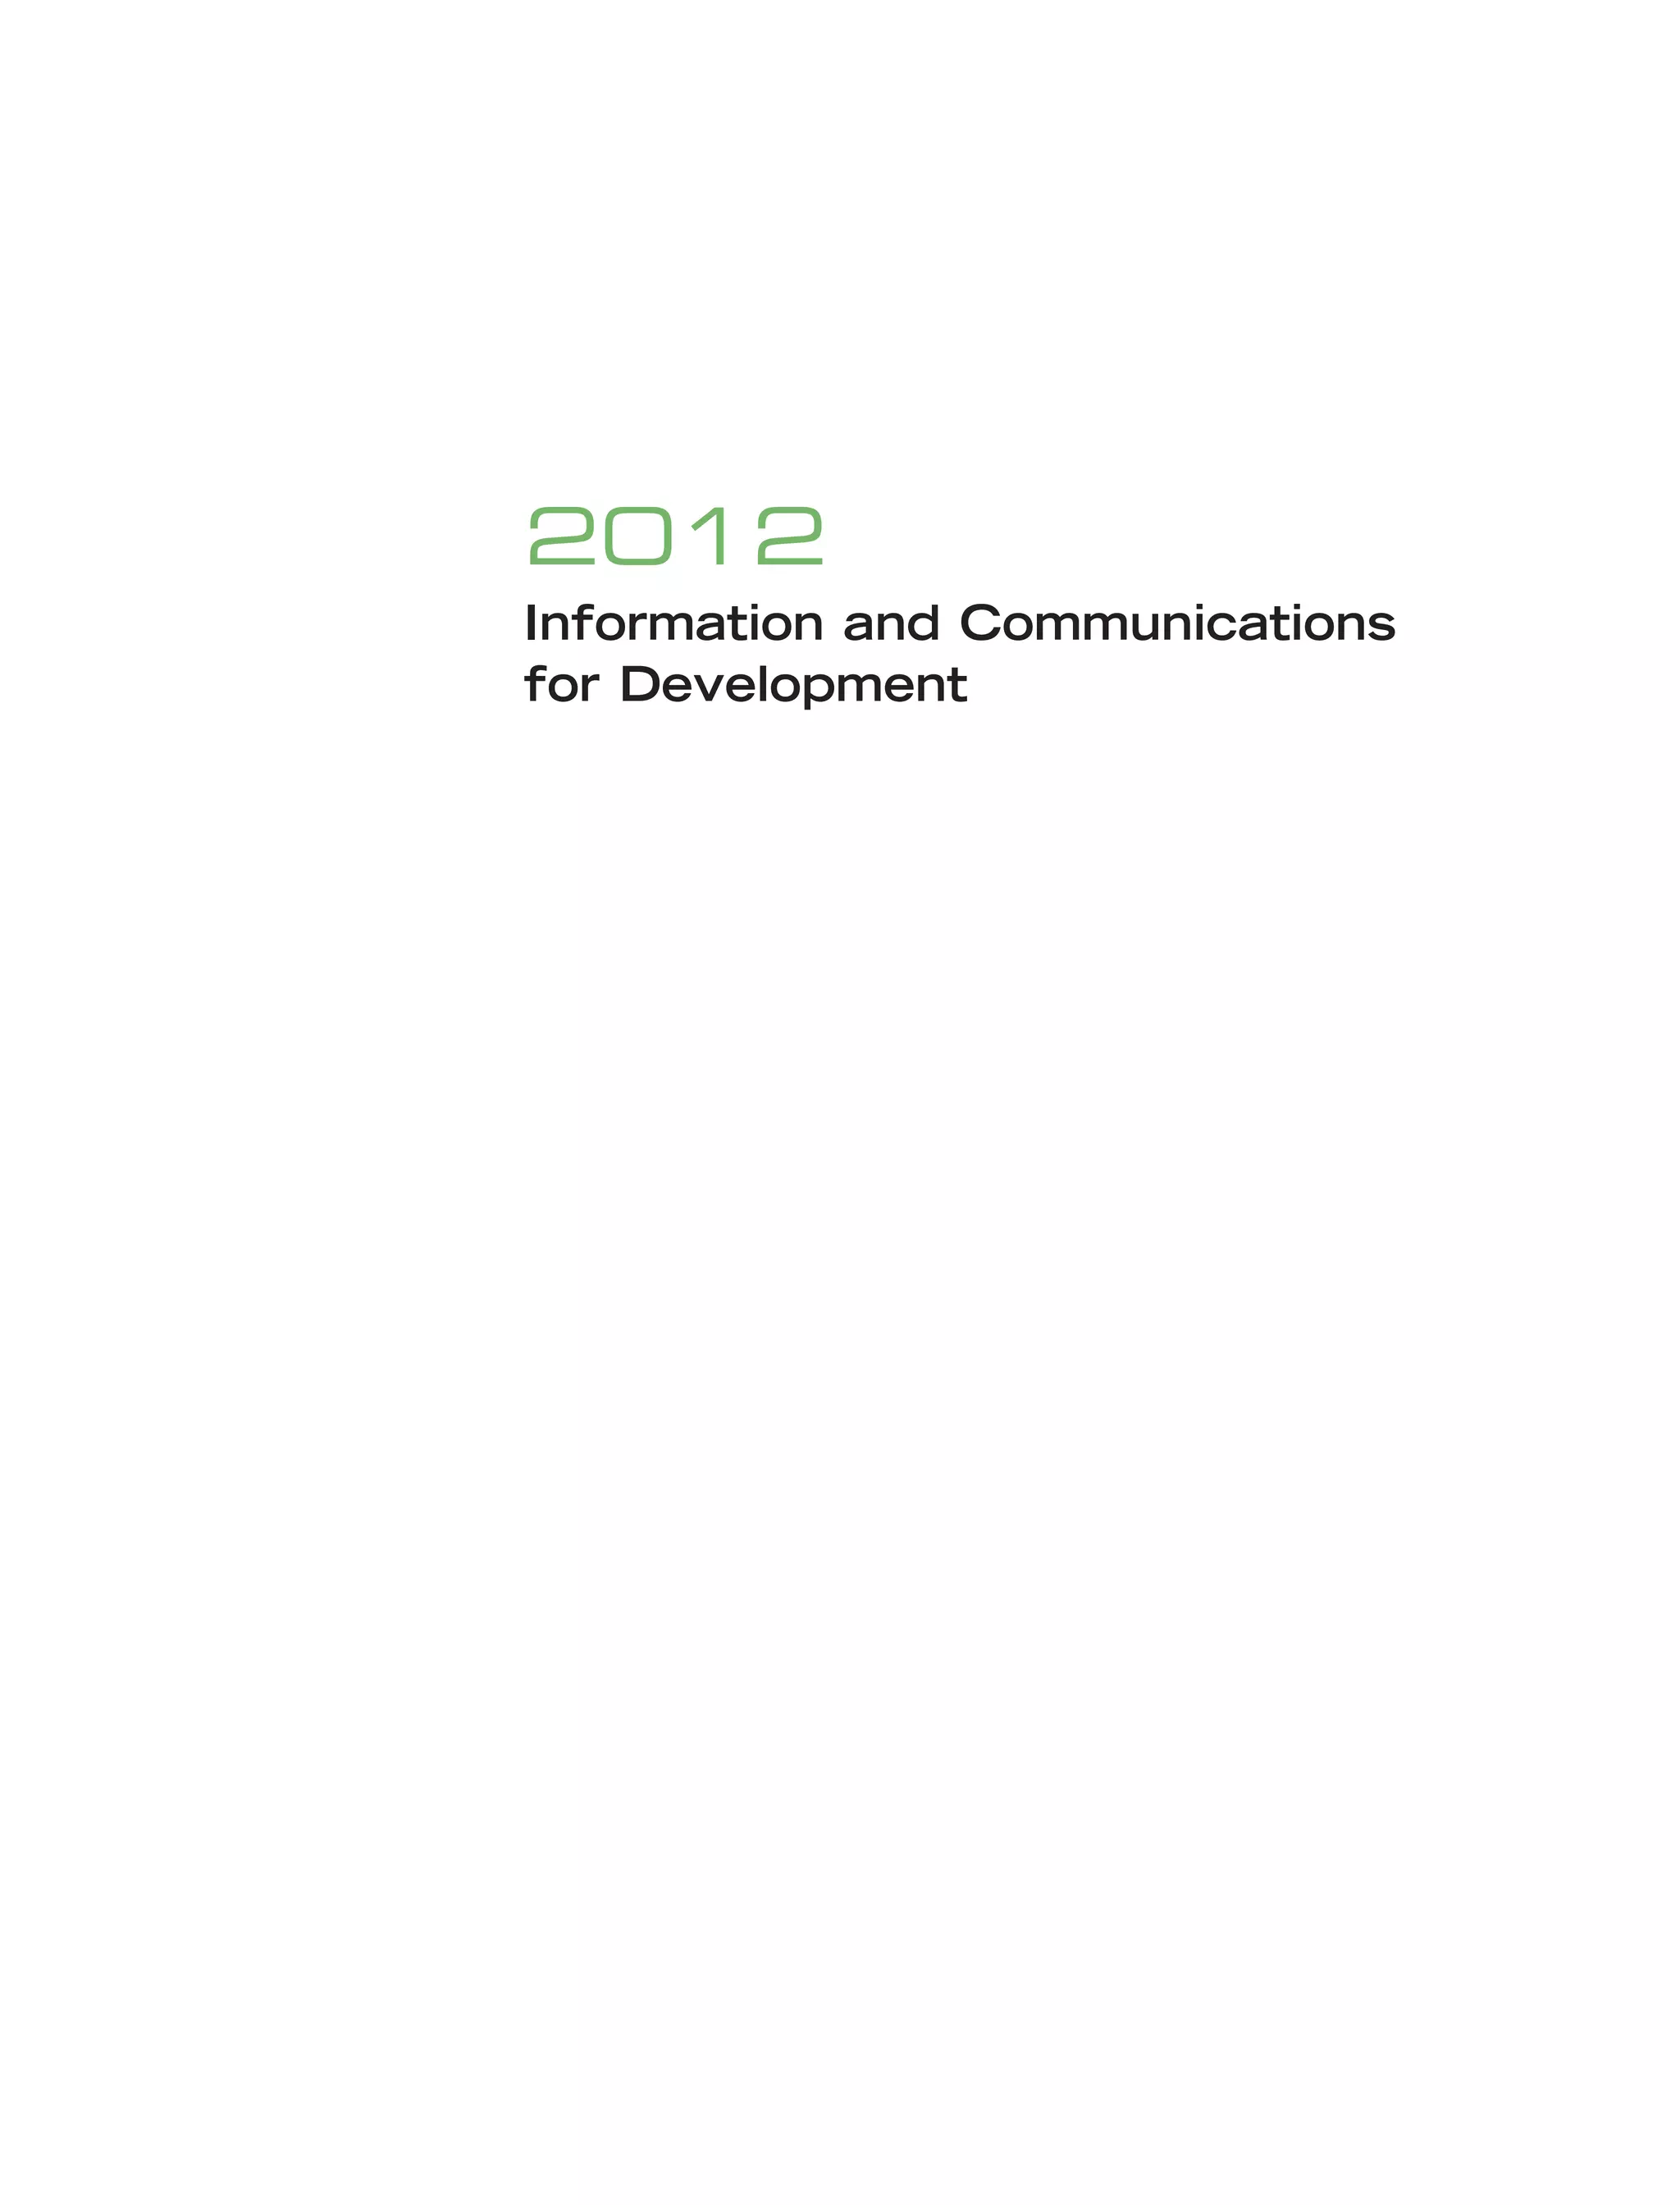
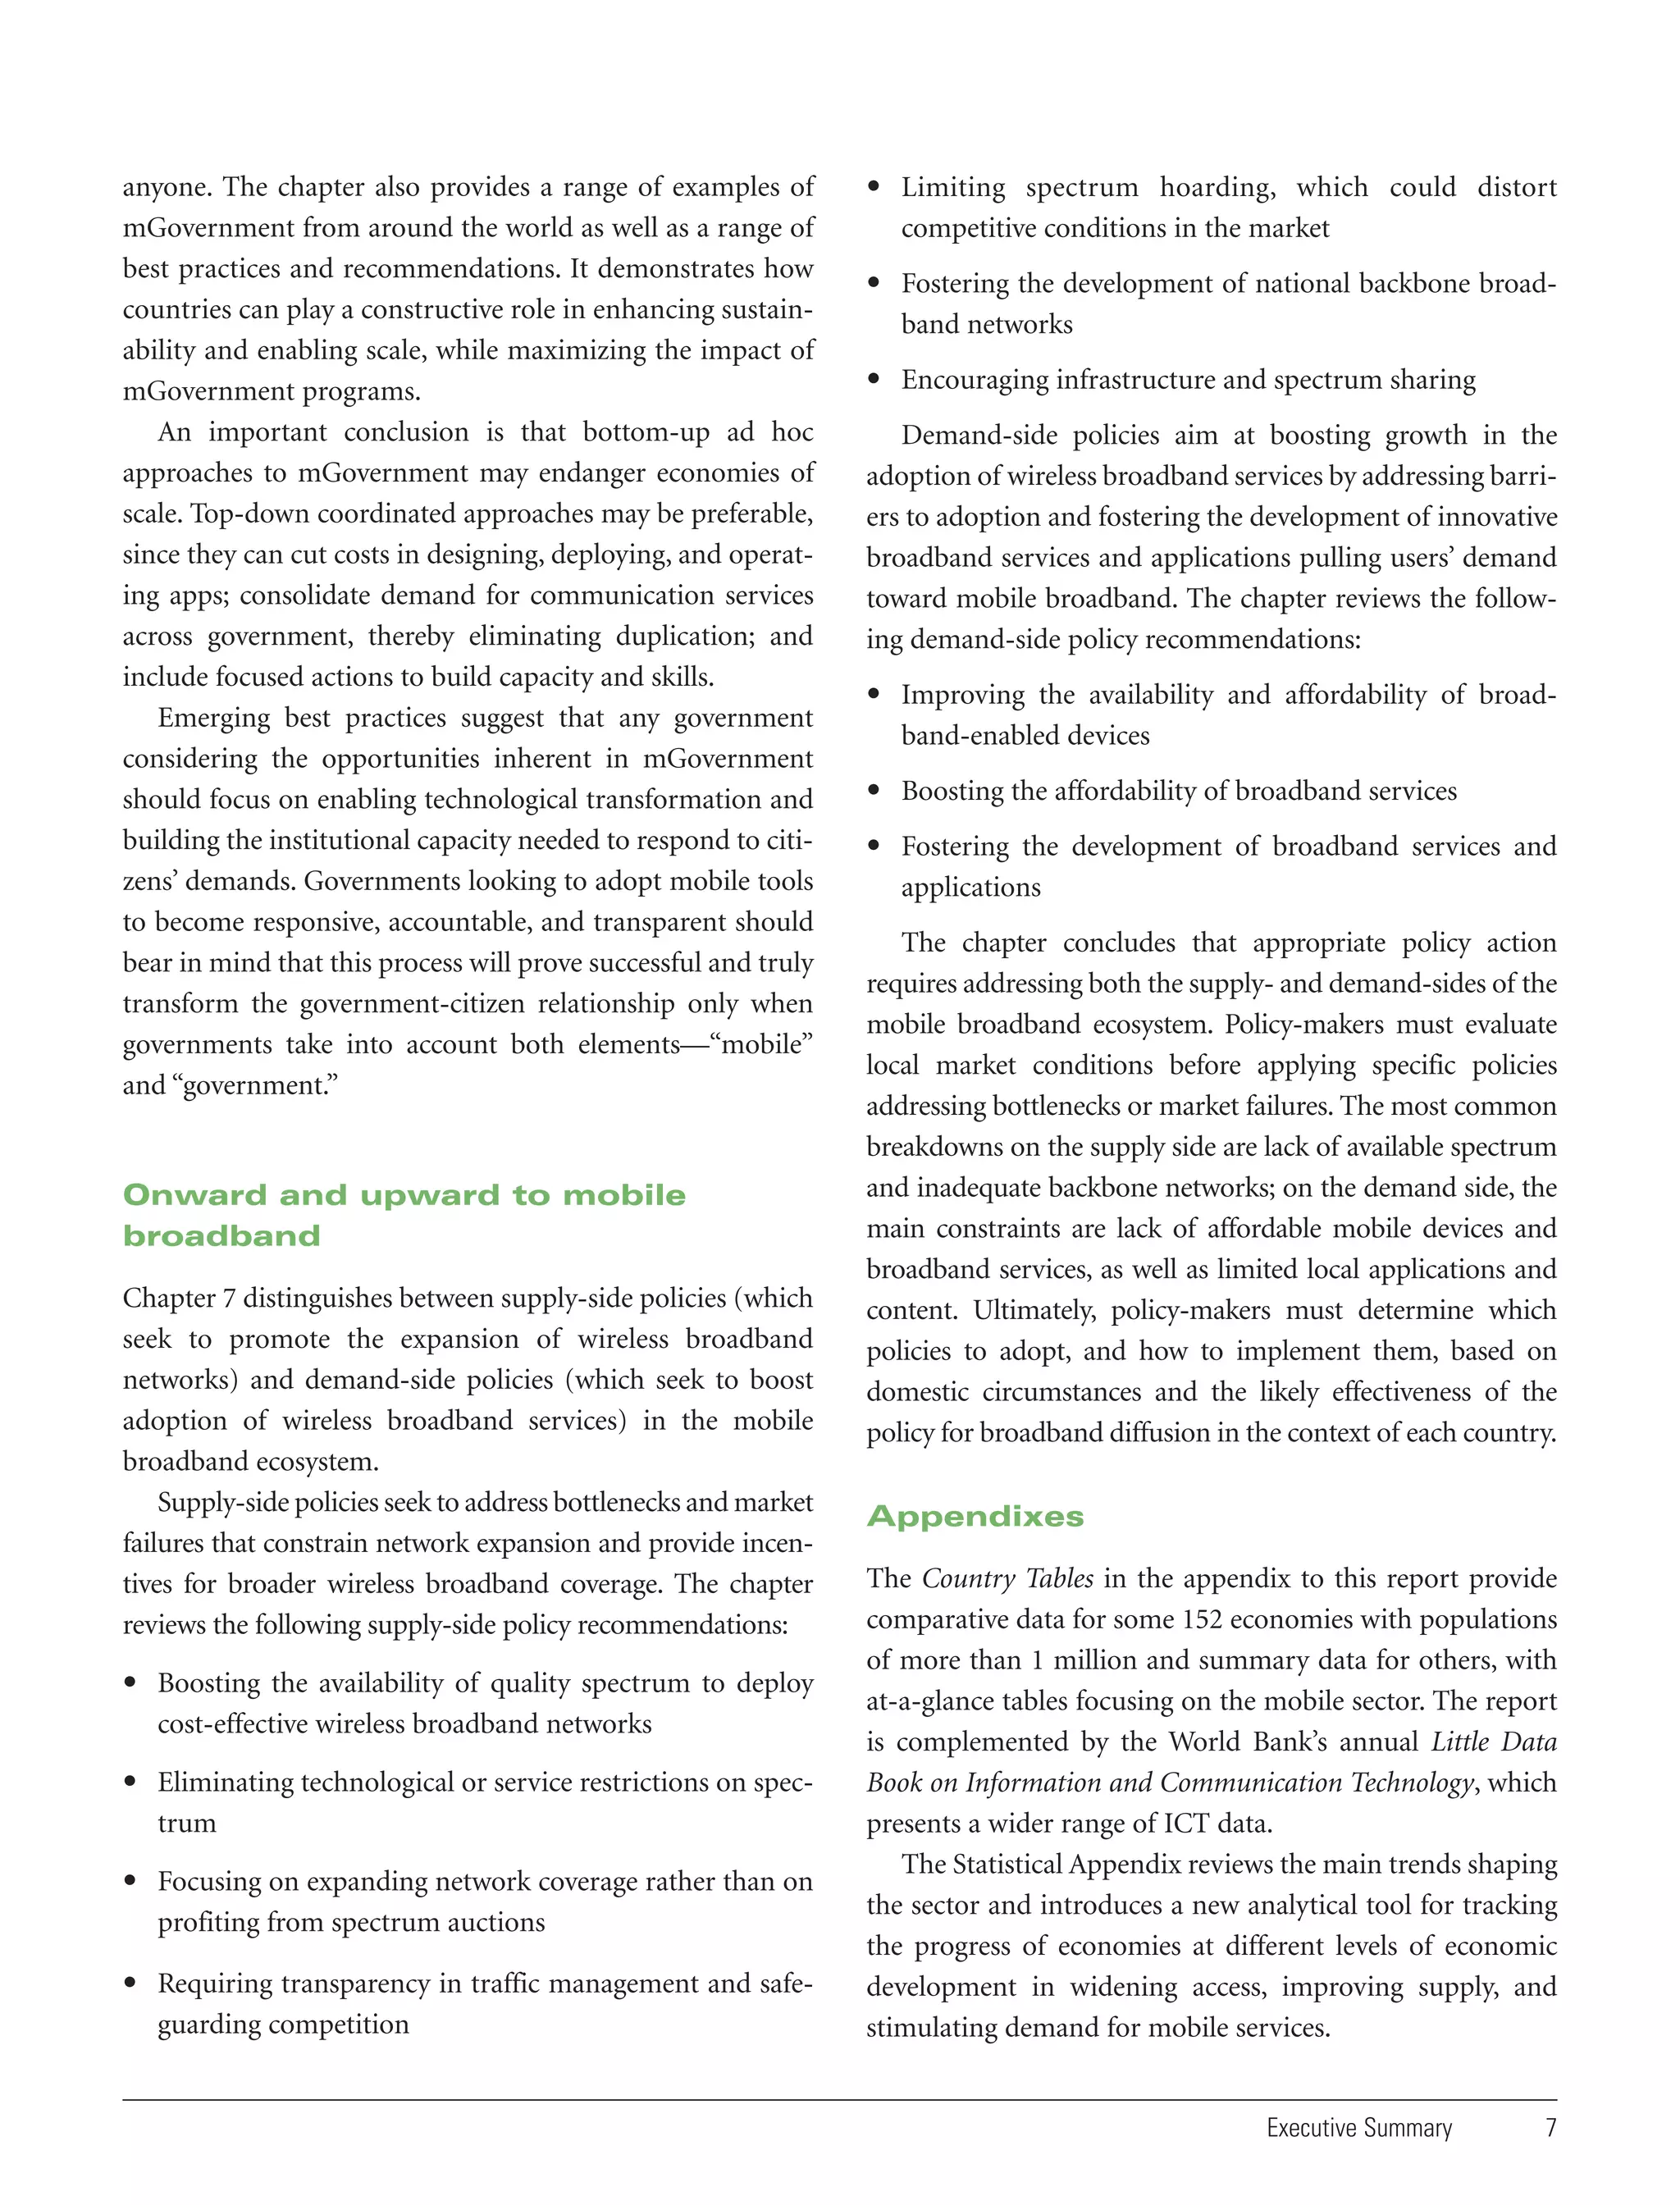
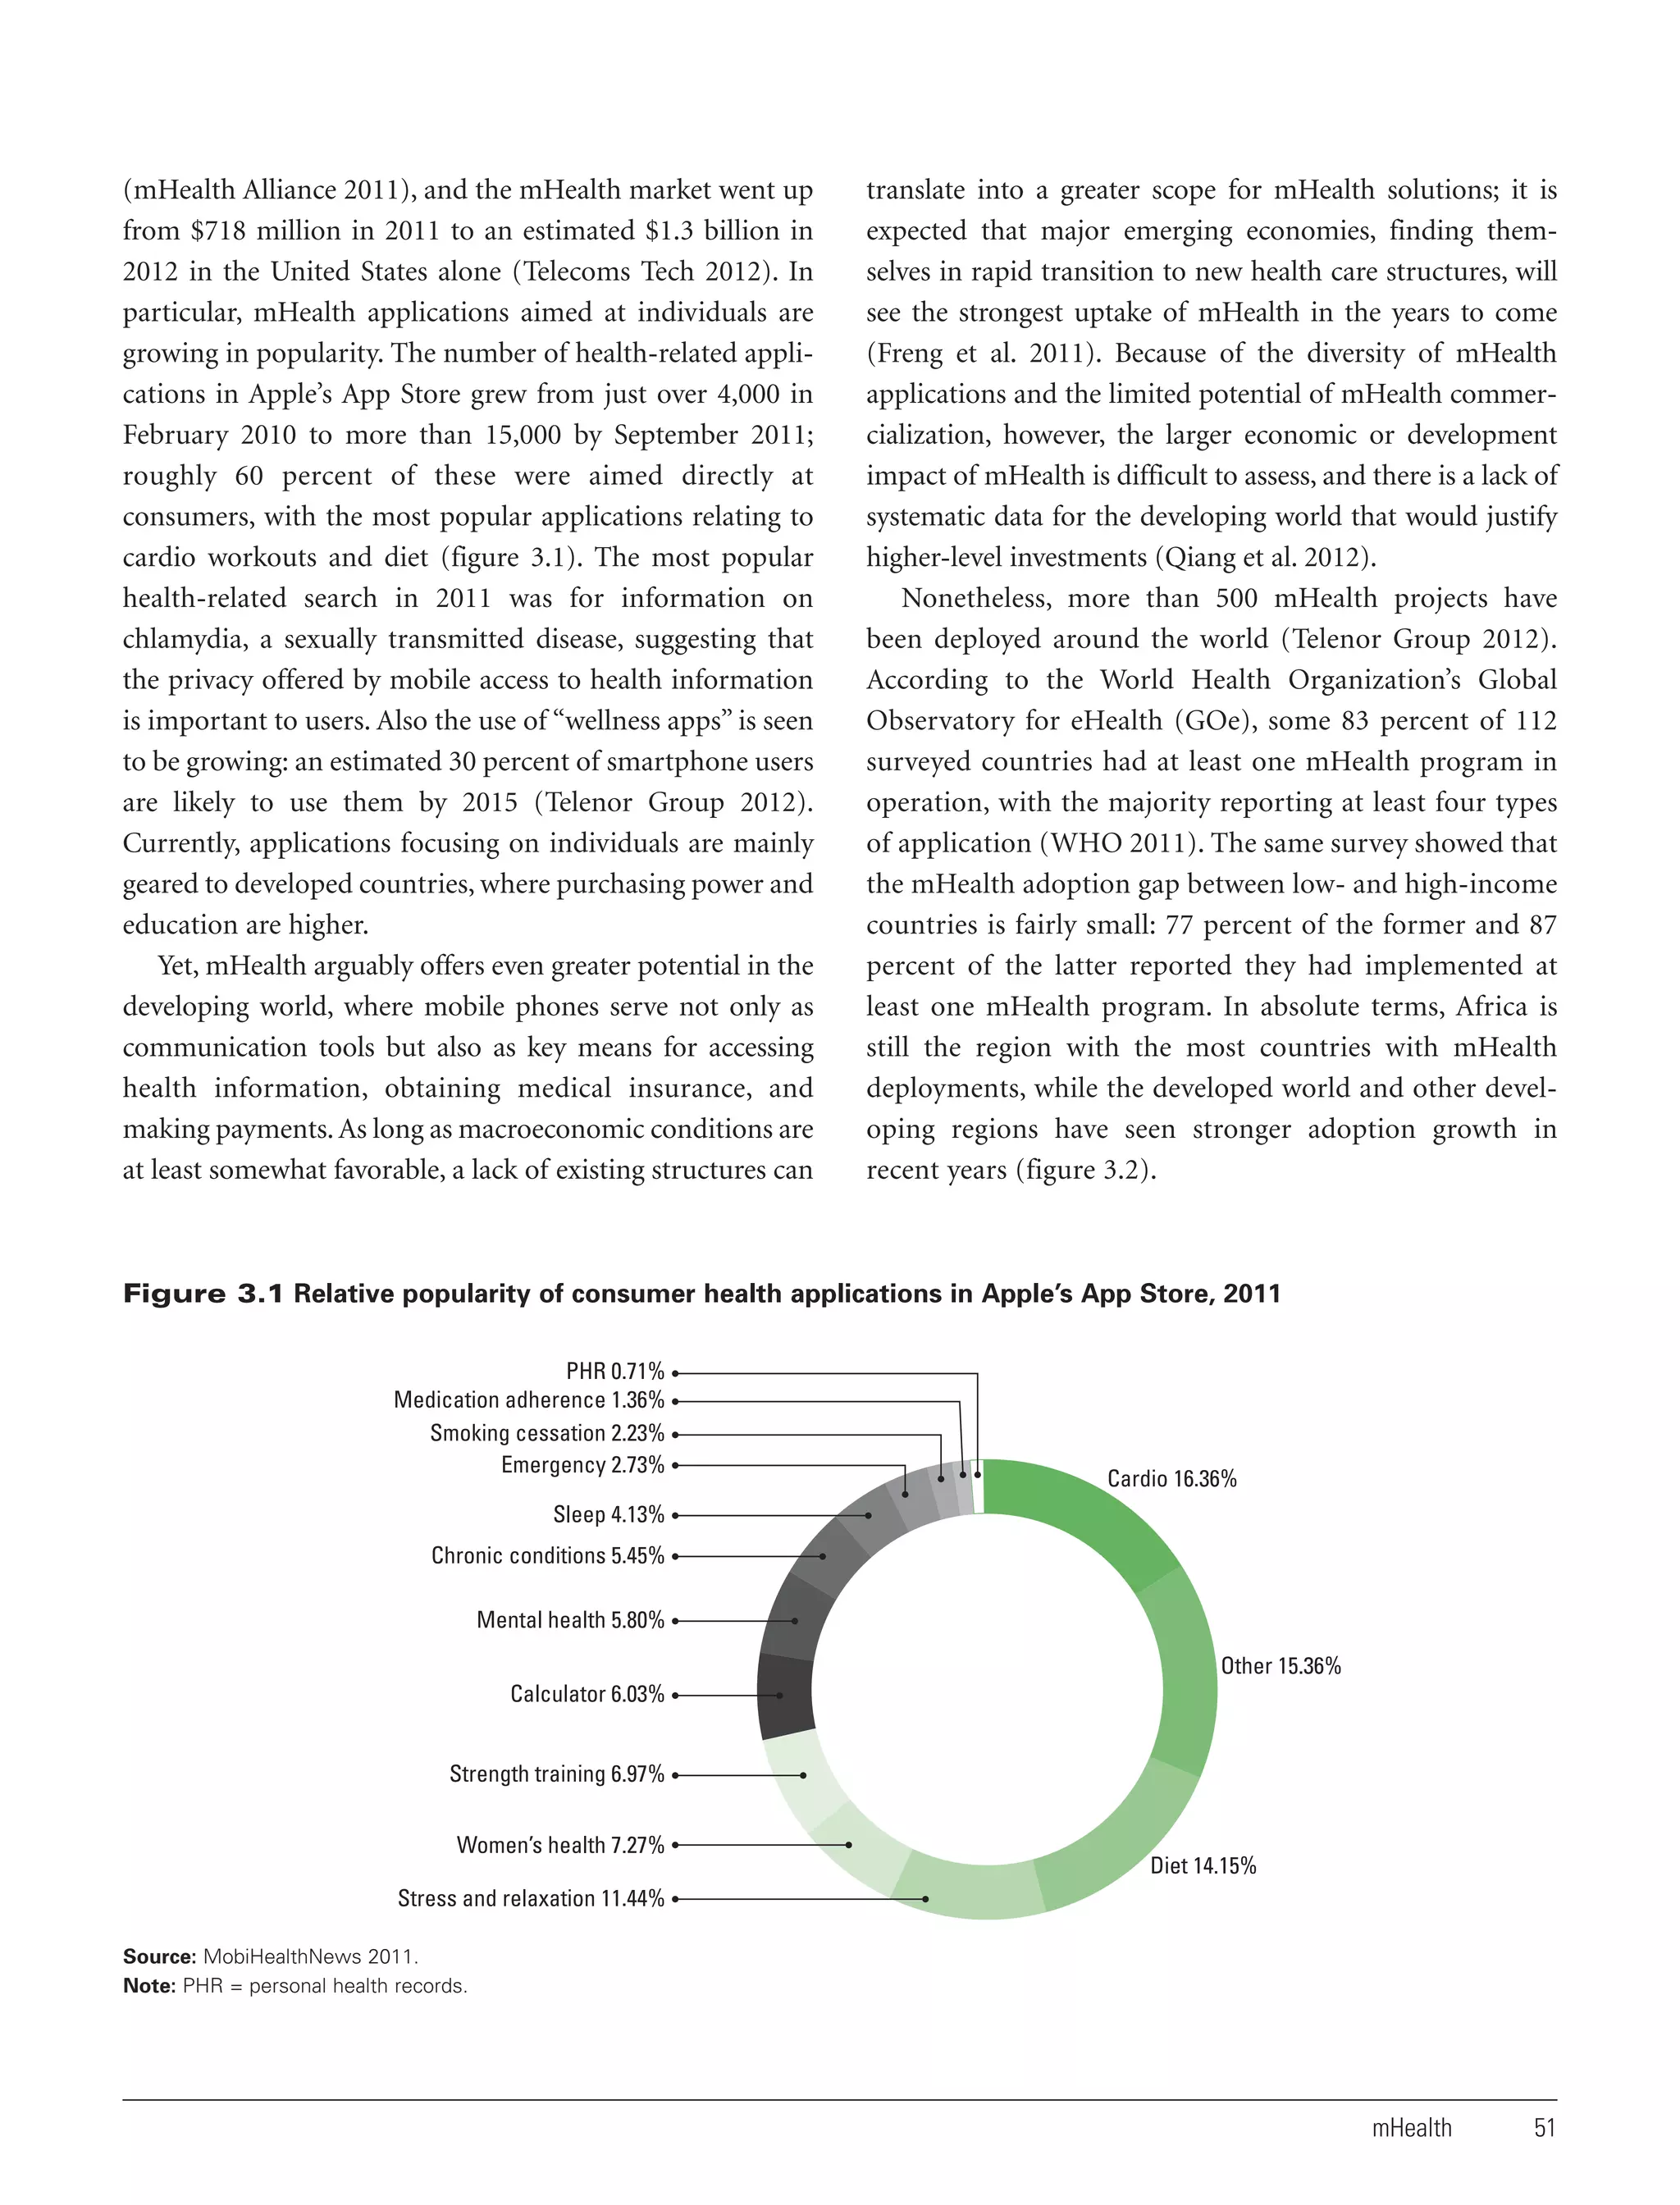
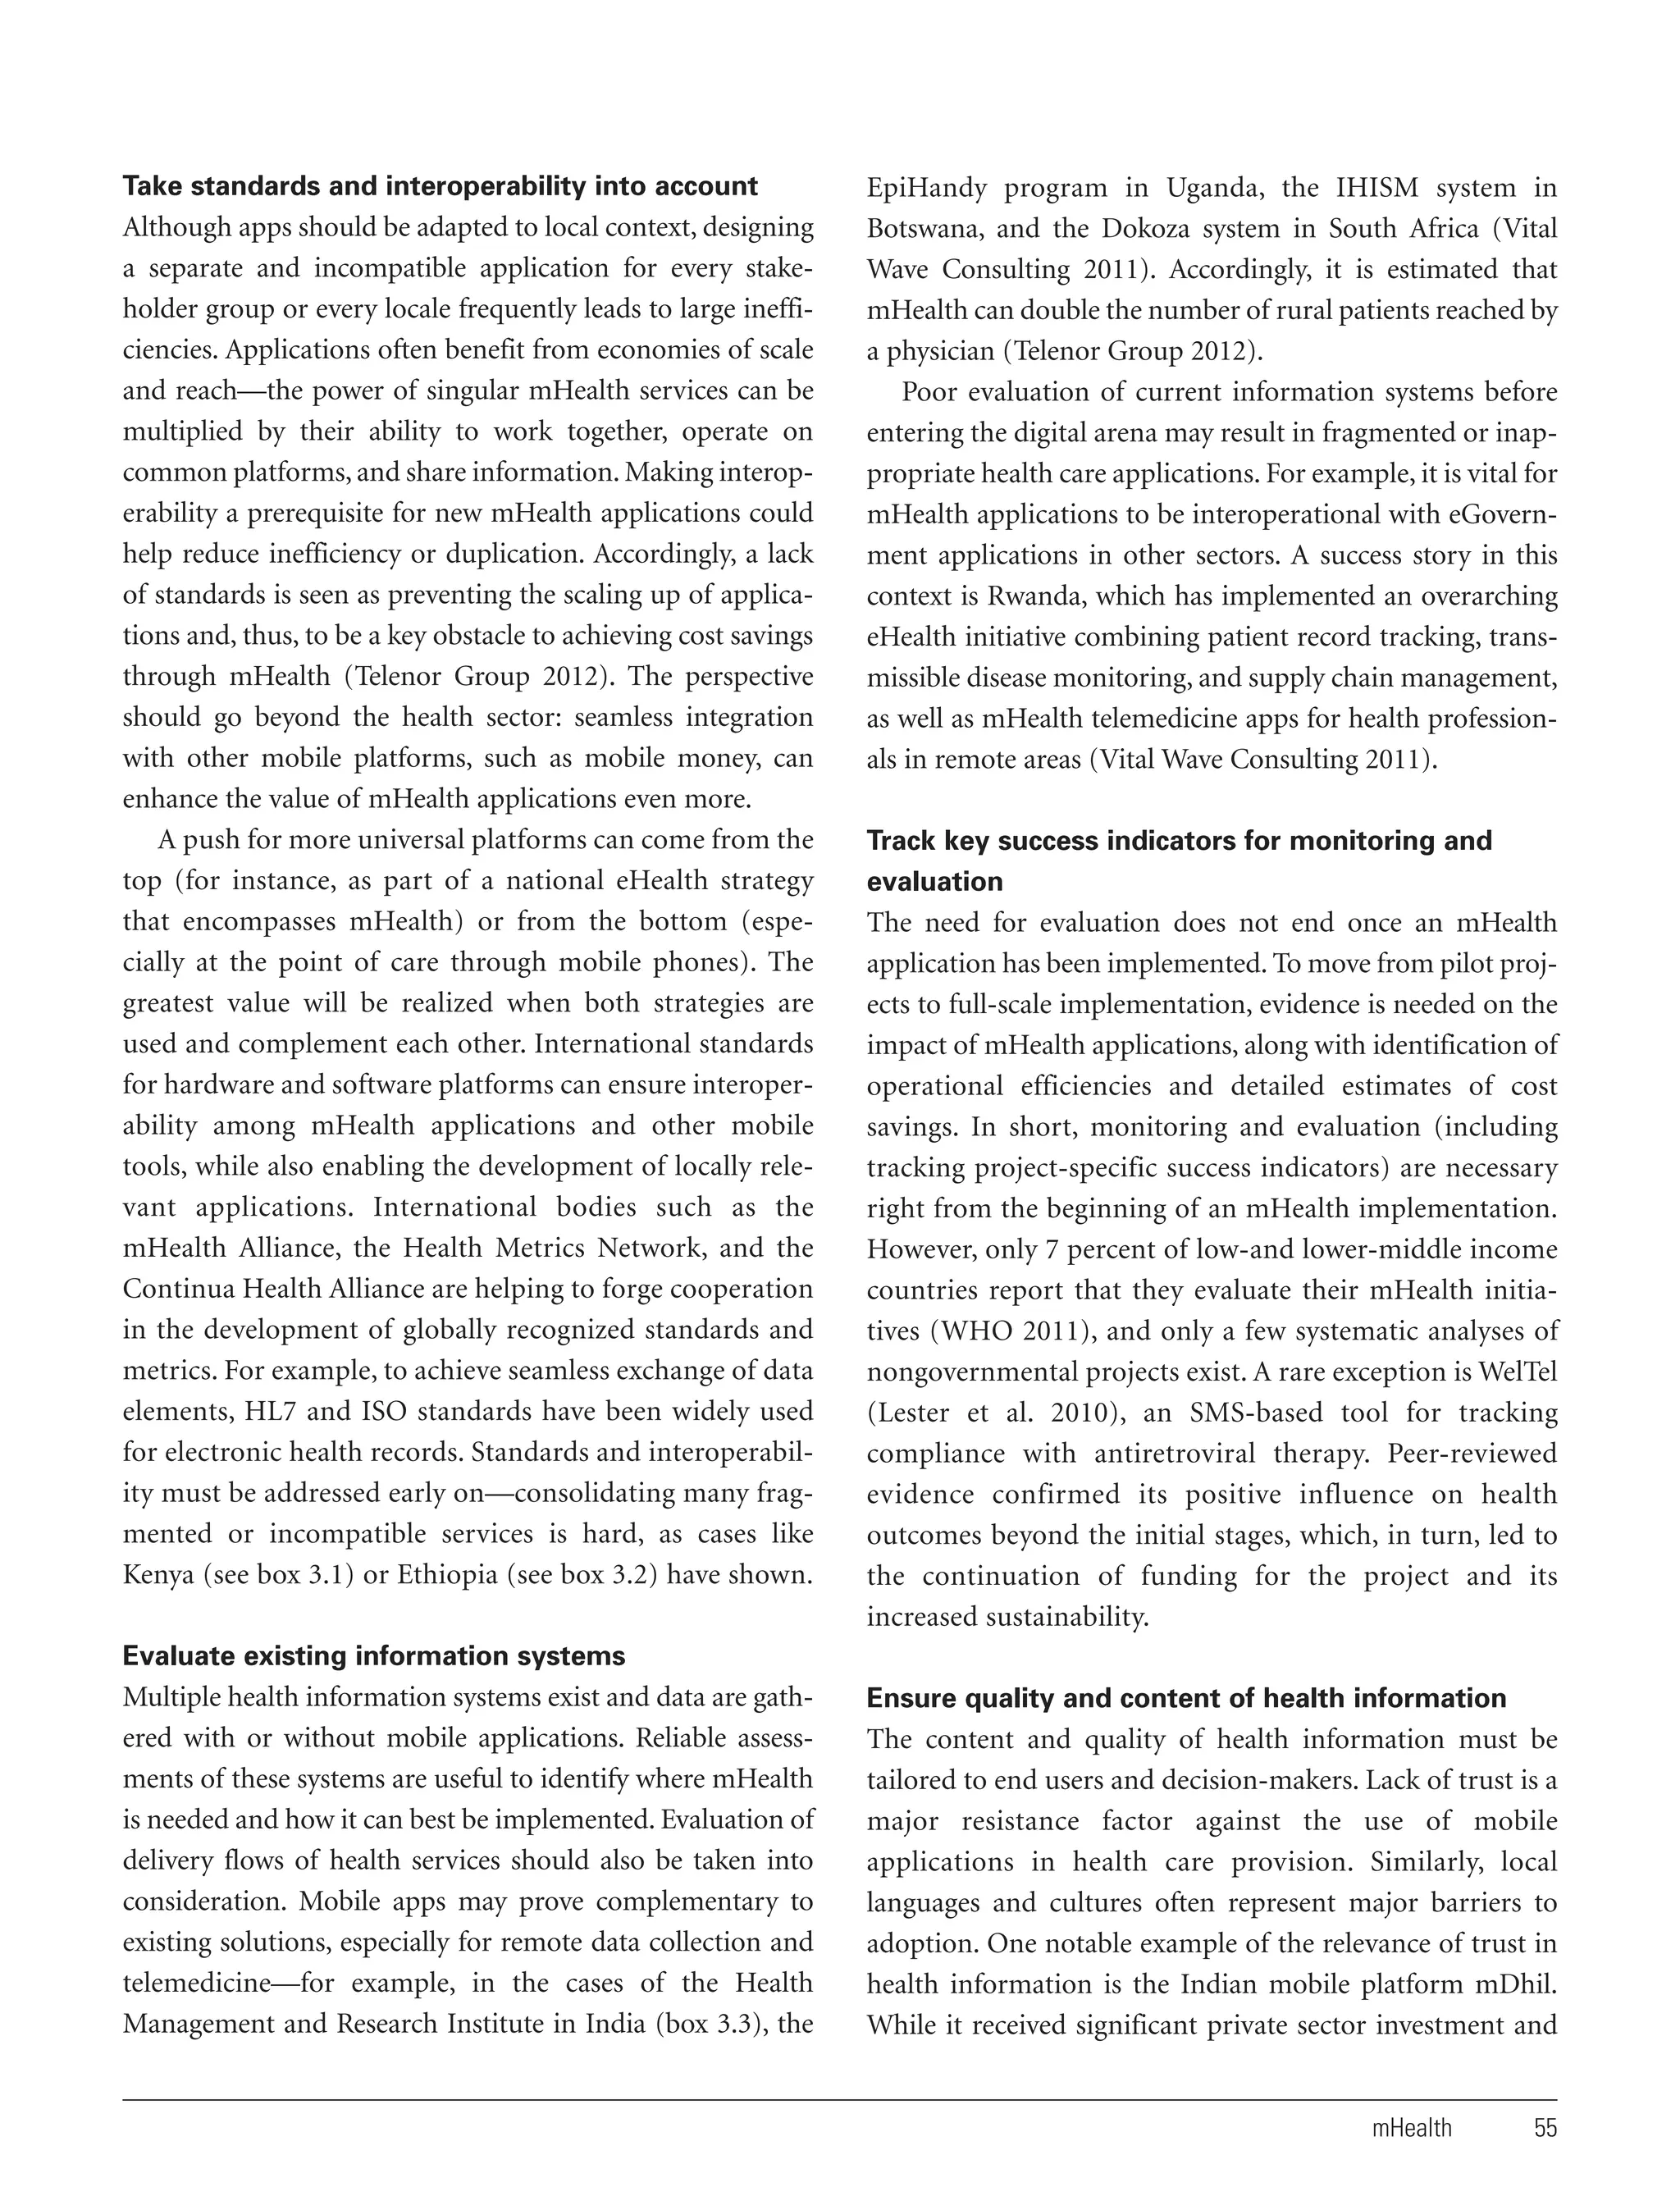
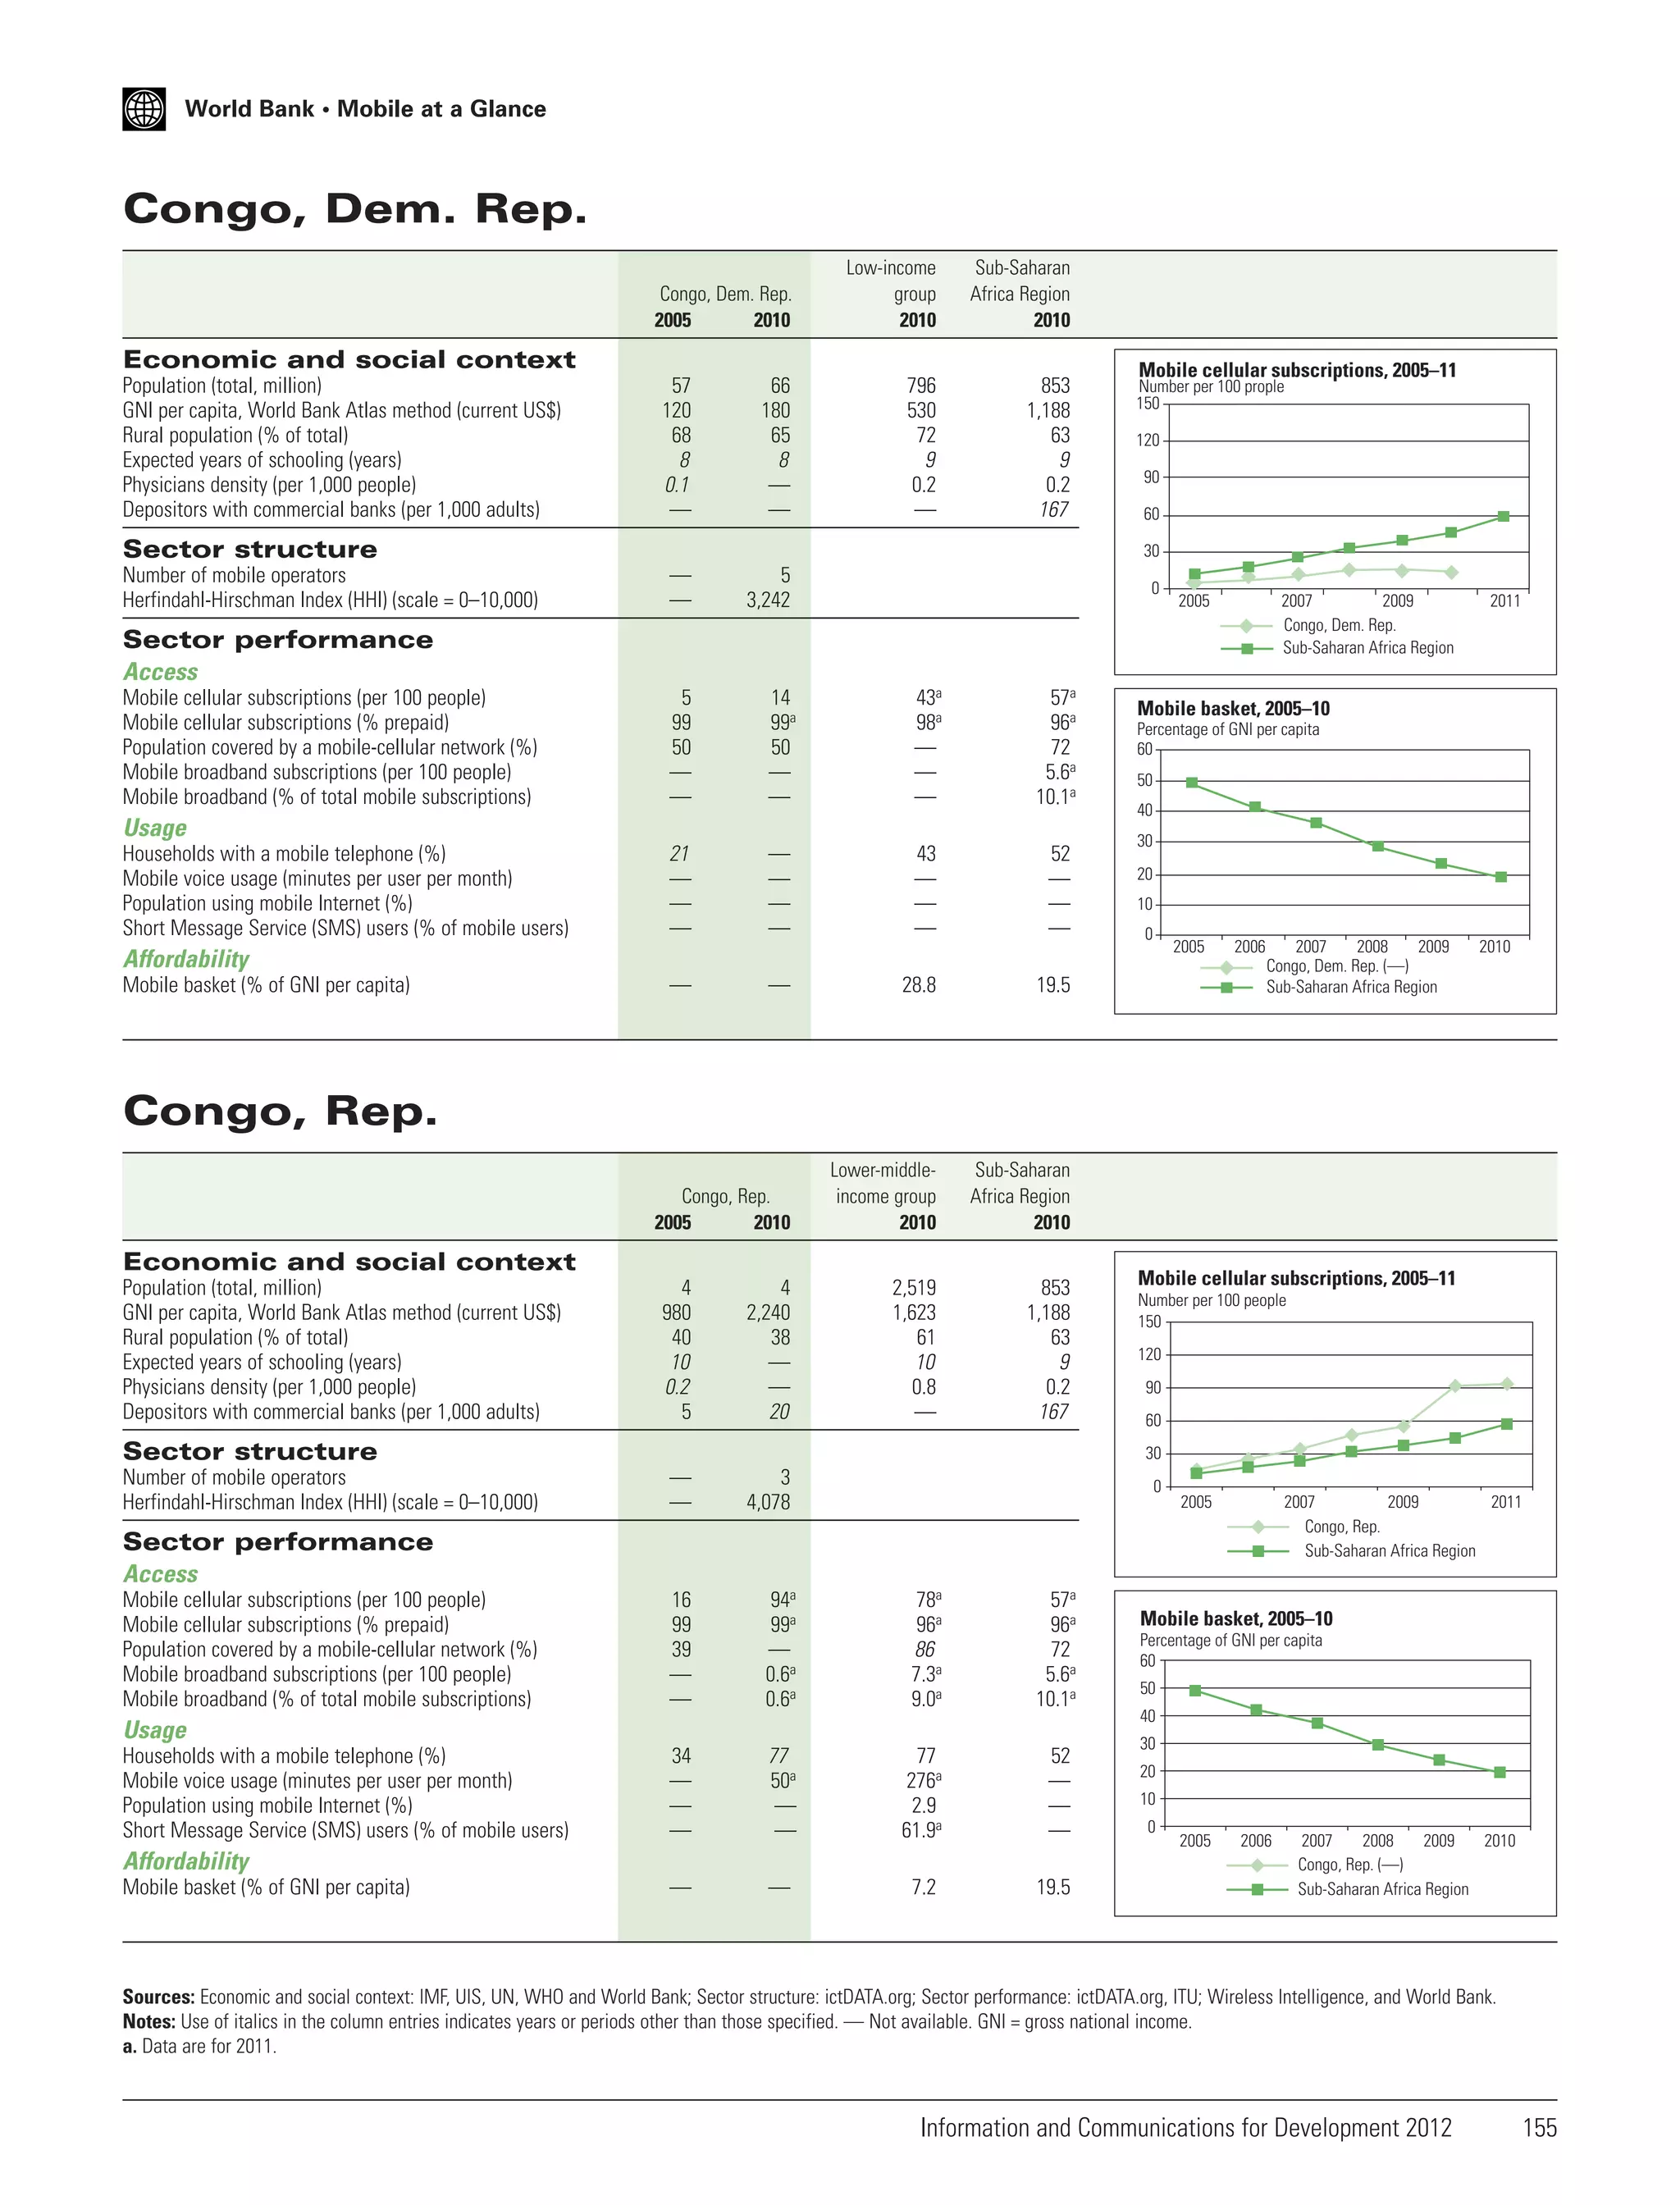
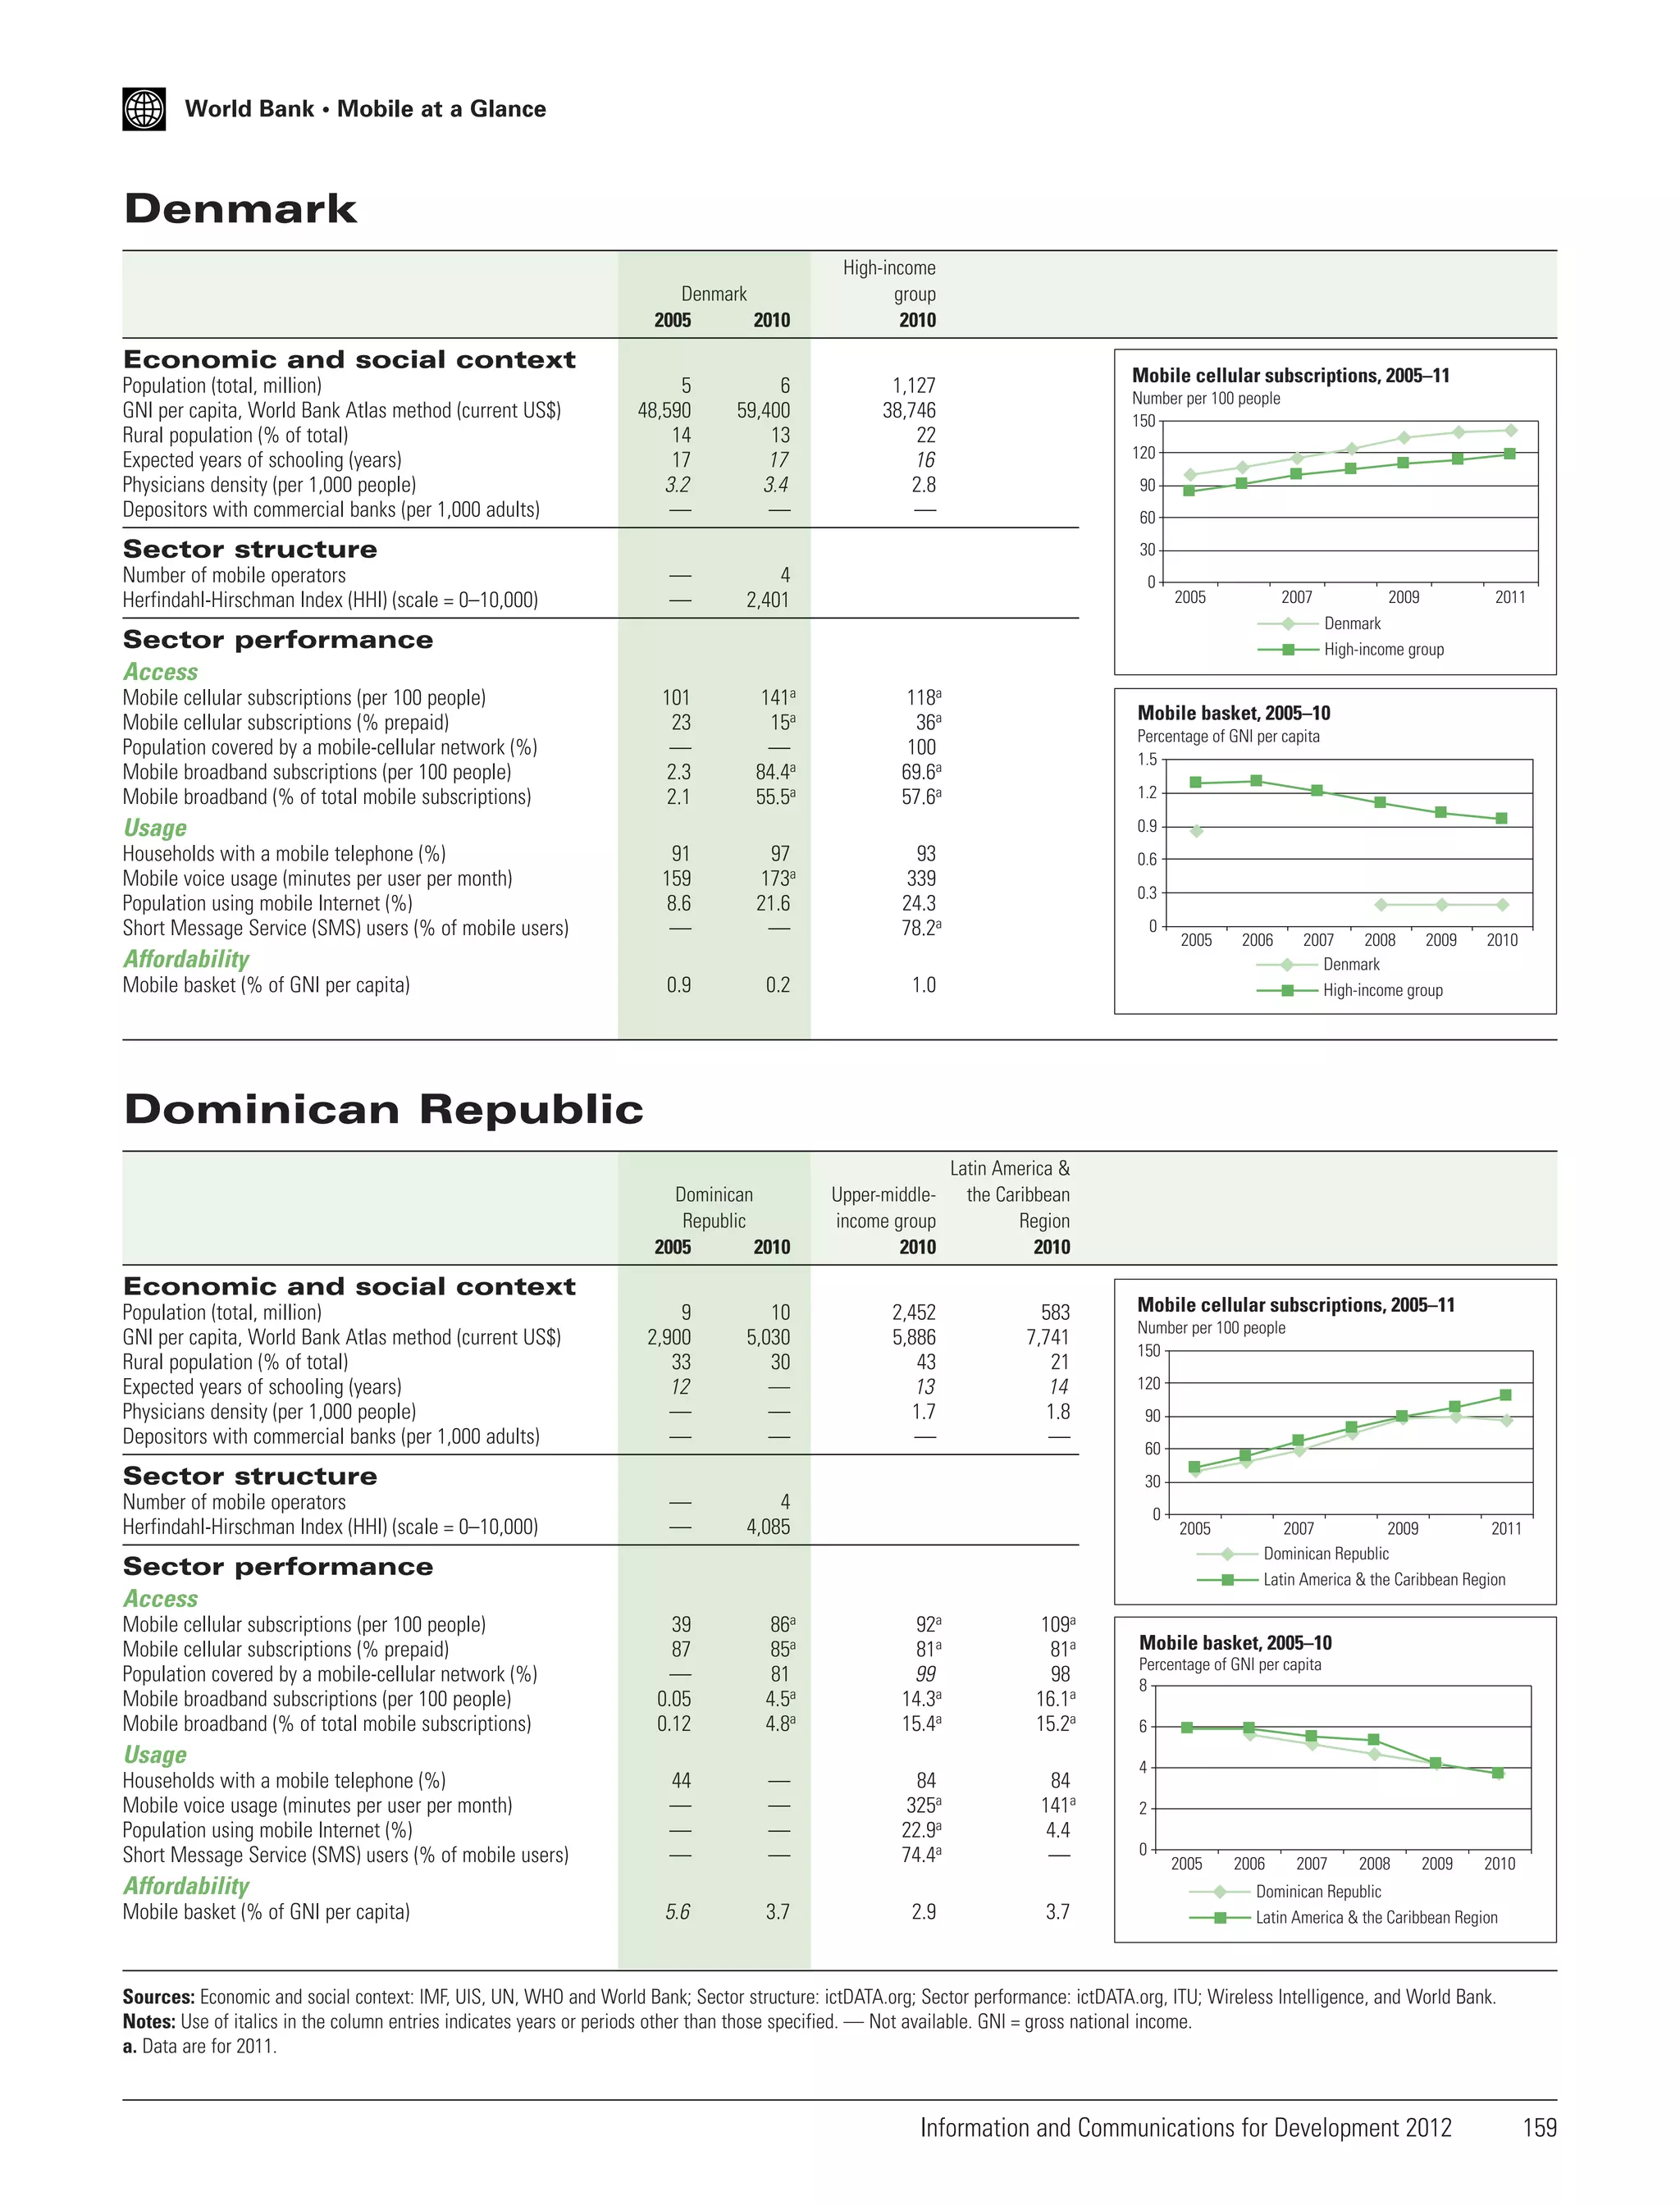
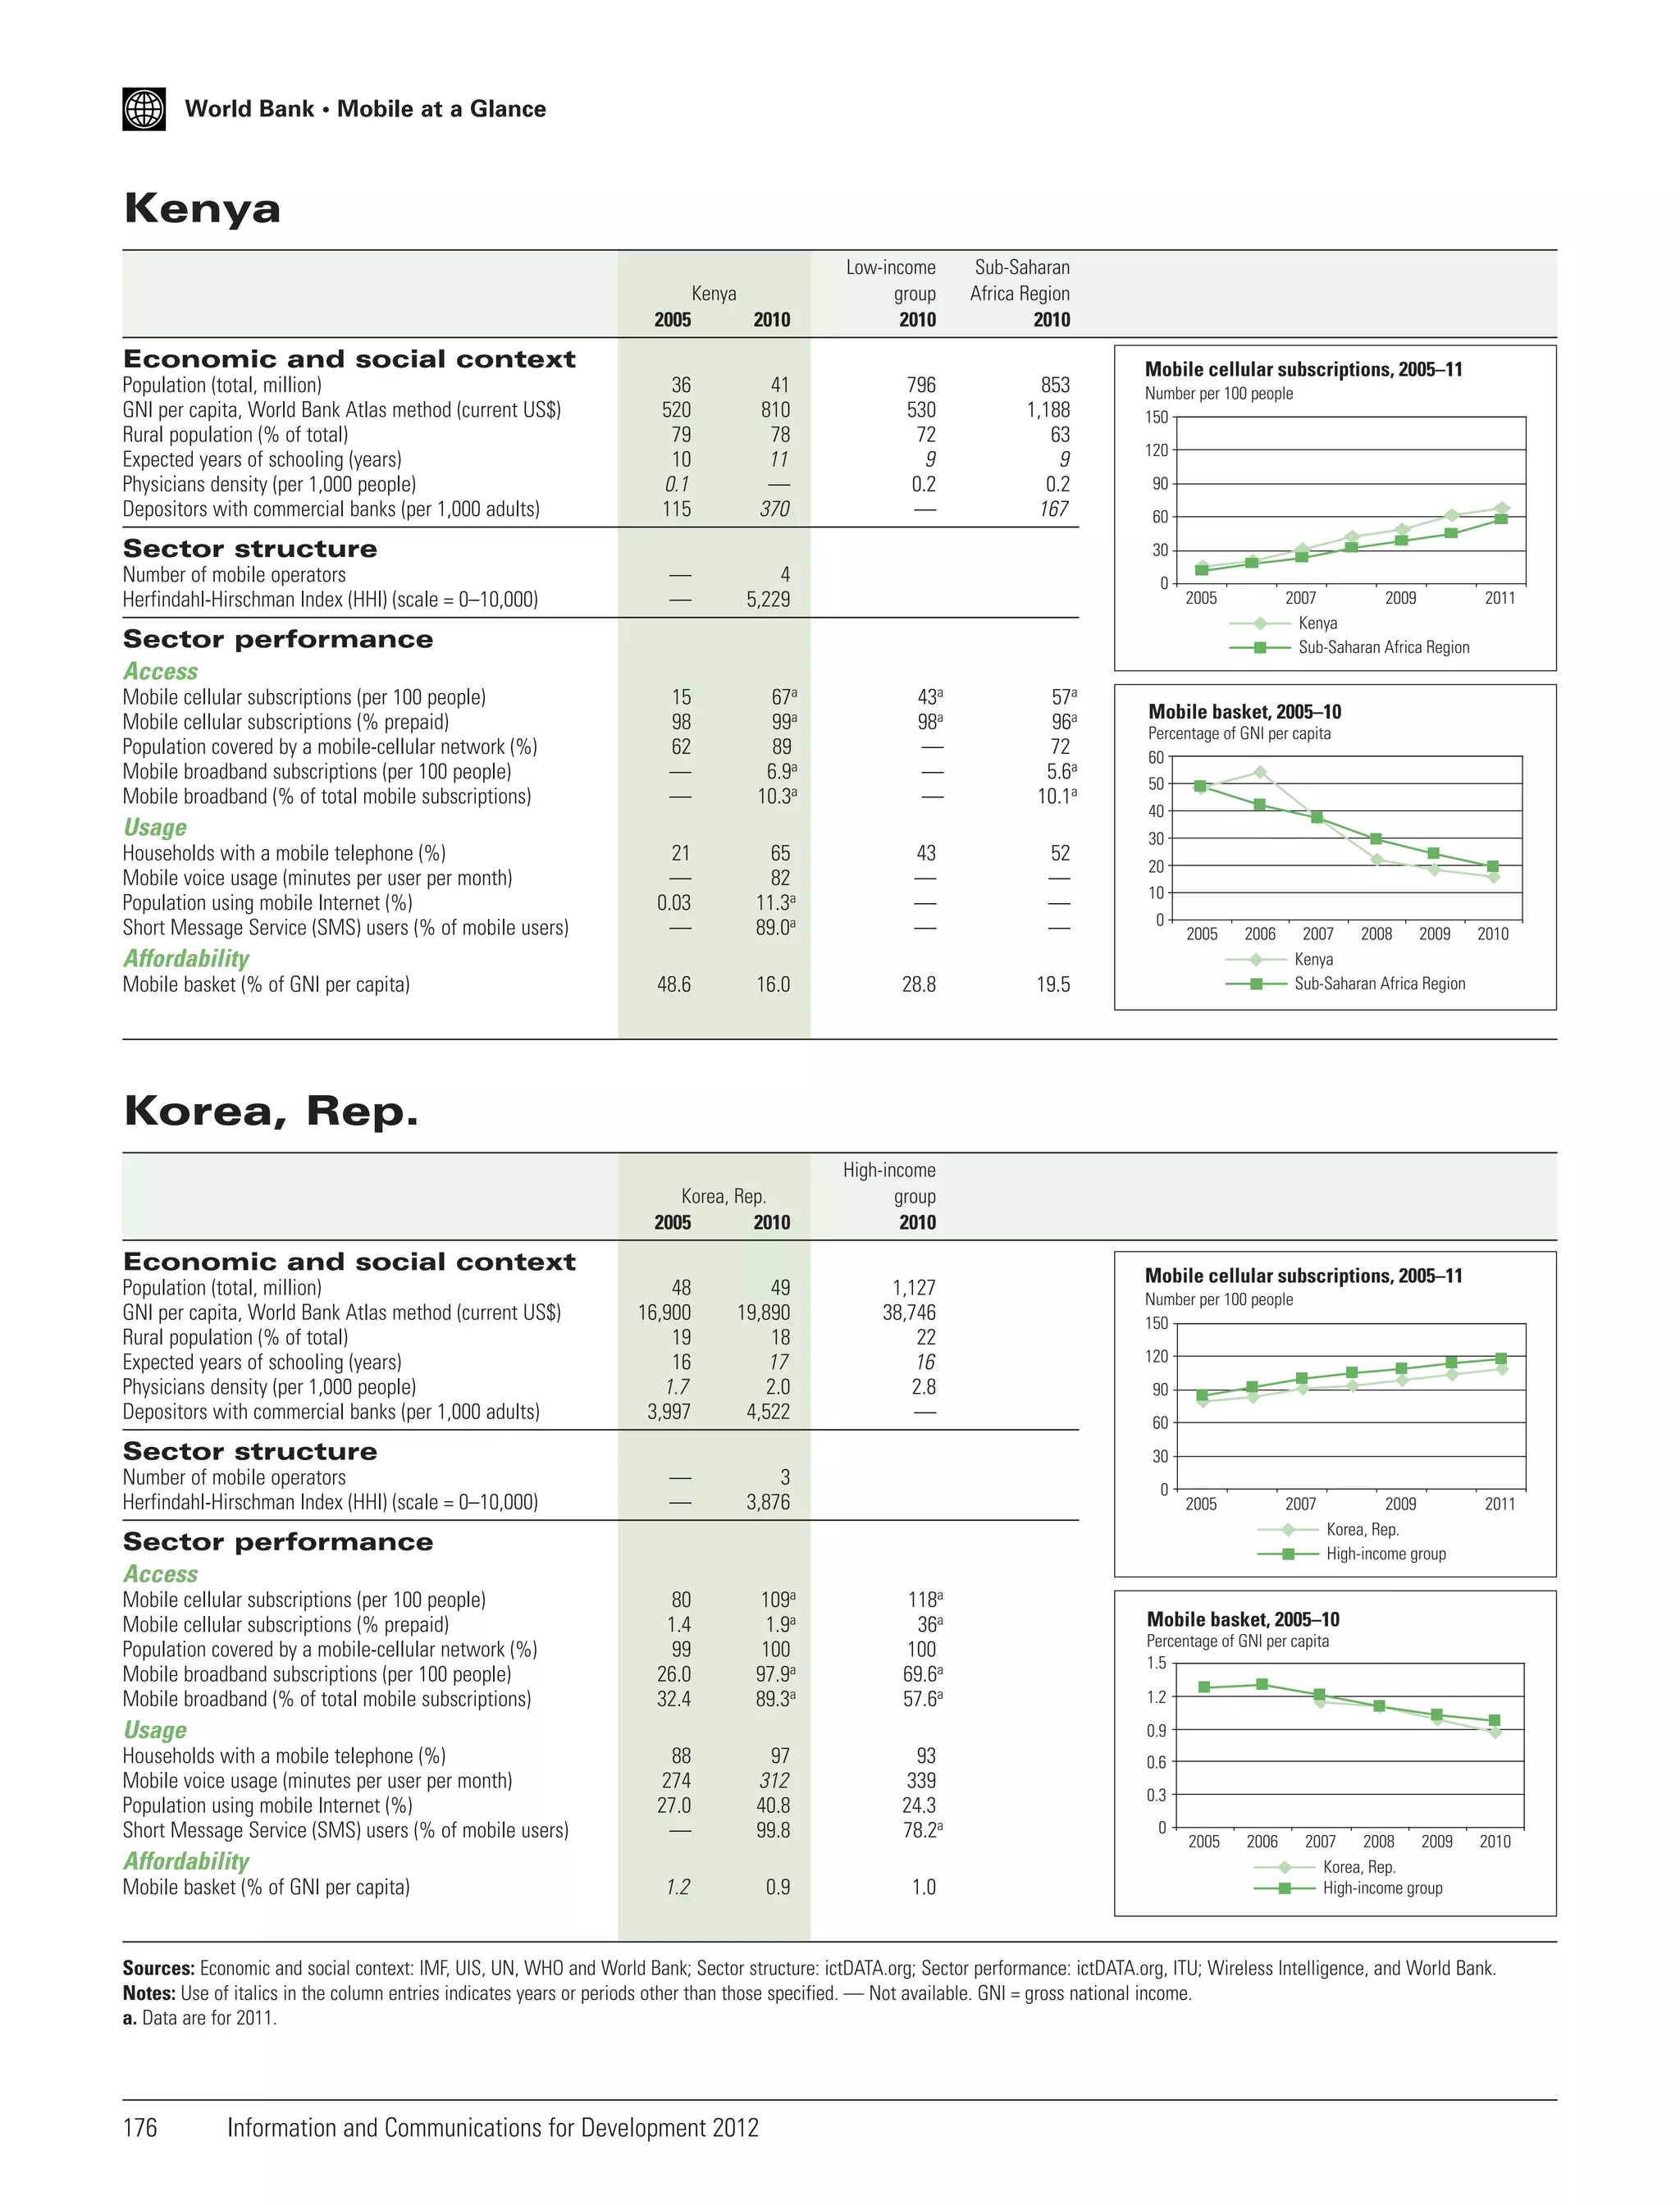
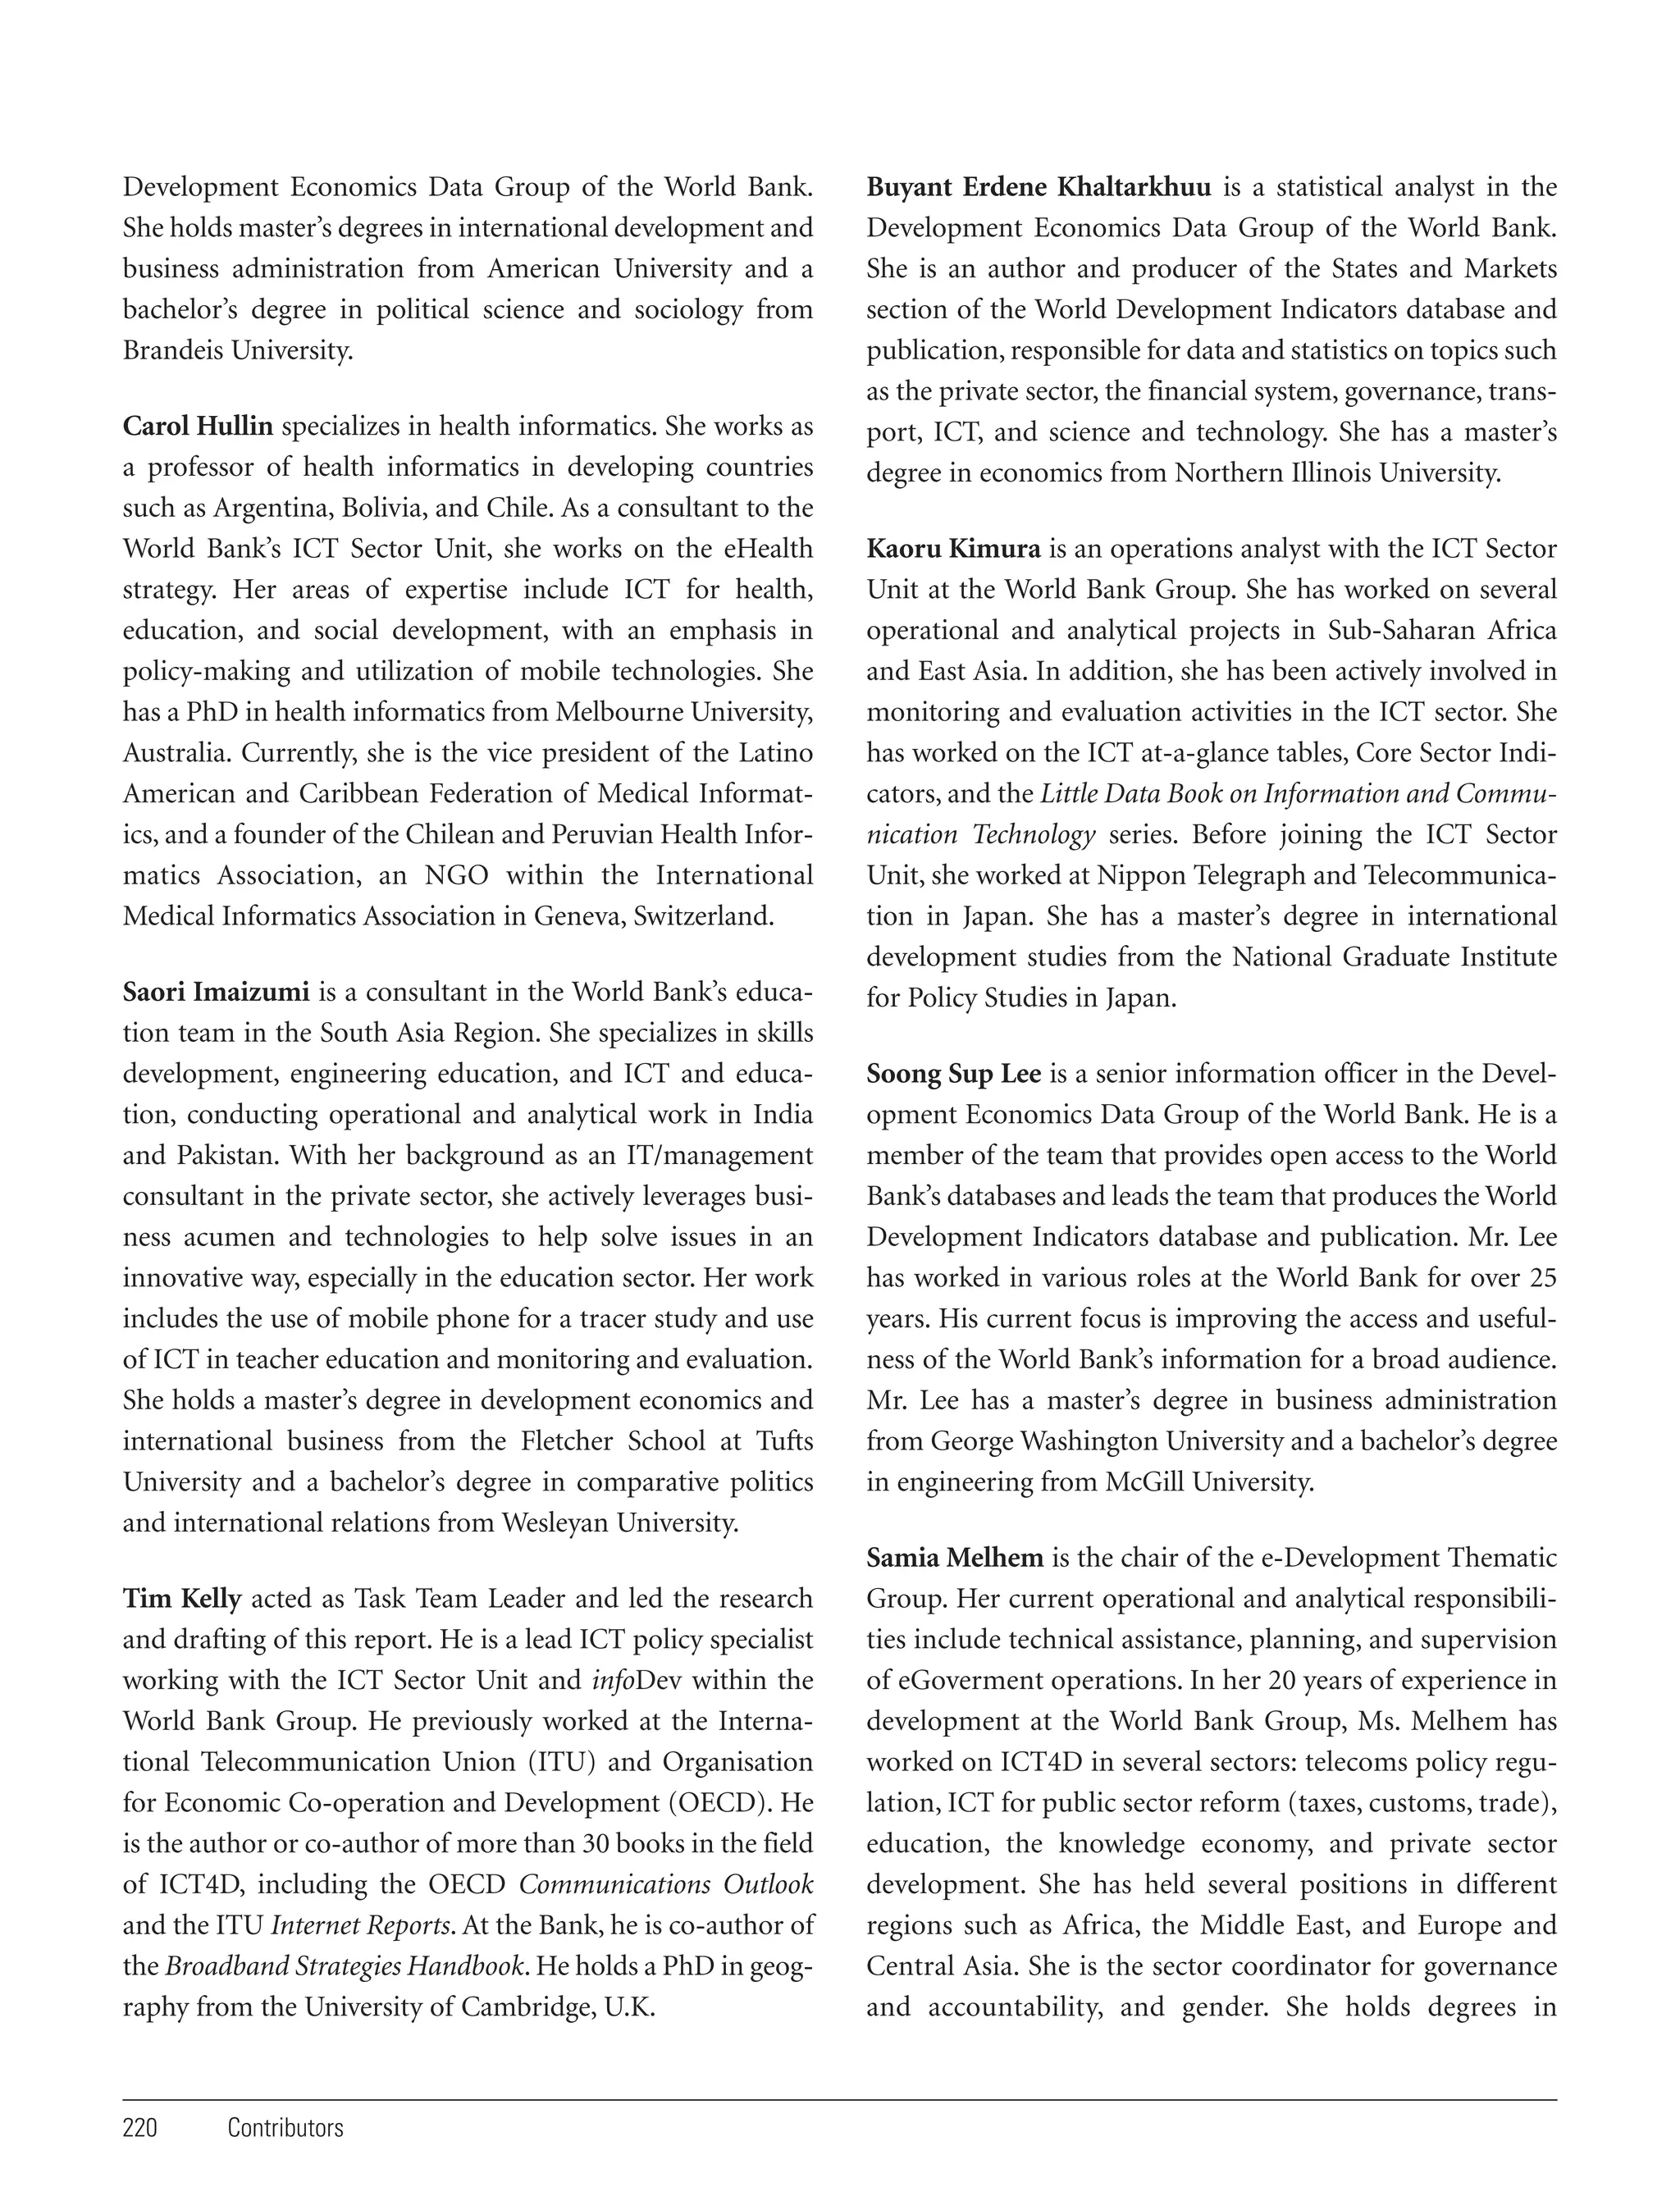
![Chapter 3
mHealth
Nicolas Friederici, Carol Hullin, and Masatake Yamamichi
alling a doctor is a natural response to getting sick
in most of the developed world, but that is not
always an option in many developing countries.
The spread of mobile phones in developing nations promises
to change that, however, by enabling health professionals to
speak directly with their patients, to arrange health care
services such as appointments, and to monitor symptoms.
This chapter is concerned with what happens once
basic communications are widely available. How can
mobile devices be used to enhance health care? How can
mobile devices improve the efficiency and effectiveness of
health care interactions between patients and immediate
health care providers (such as doctors and hospitals), as
well as between patients, providers, and other institutions
involved with health (such as health information portals,
insurance companies, and government agencies)?
Early on, the term mHealth was narrowly defined to
mean wireless telemedicine involving the use of mobile
telecommunications and multimedia technologies and their
integration with mobile health care delivery systems
(Istepanian and Lacal 2003).1 However, this definition does
not do justice to the wide variety of stakeholders and types
of uses that mHealth spans today. In this report, a broader
definition is adopted: “mHealth encompasses any use of
mobile technology to address health care challenges such as
access, quality, affordability, matching of resources, and
behavioral norms [through] the exchange of information”
(Qiang et al. 2012). It is a dynamic field for innovative new
C
services that move health care away from pure public service
delivery toward seeing the patient as a consumer. Mobile
health software and services have proved to be versatile tools
for collecting data at the point of action, potentially resulting in more accountable management of information in
health care delivery, increasingly going beyond telemedicine.2 Table 3.1 summarizes some of the more important
mHealth categories.
Why mHealth? Opportunities and
challenges
How can mobile communications help to achieve public and
private health sector objectives, and what policies can help
facilitate mHealth deployments? On the supply side, mobile
communications can help provide health care services more
quickly and cheaply in many cases, mainly by focusing on
primary, preventive, and self-empowered approaches to
health care. From the demand perspective, mobile phones
can make it easier and more convenient not only to find relevant information quickly but also to enter health data and
engage in interactive services, such as symptom tracking and
online communities of patients.
For mHealth to deliver, mHealth application developers
should ideally consult with medical or health informaticians trained to understand the information flows
involved in health care processes.3 At the same time, to
reach a wider market and to achieve sustainability, many
45](https://image.slidesharecdn.com/random-140112120019-phpapp01/75/2012-65-2048.jpg)
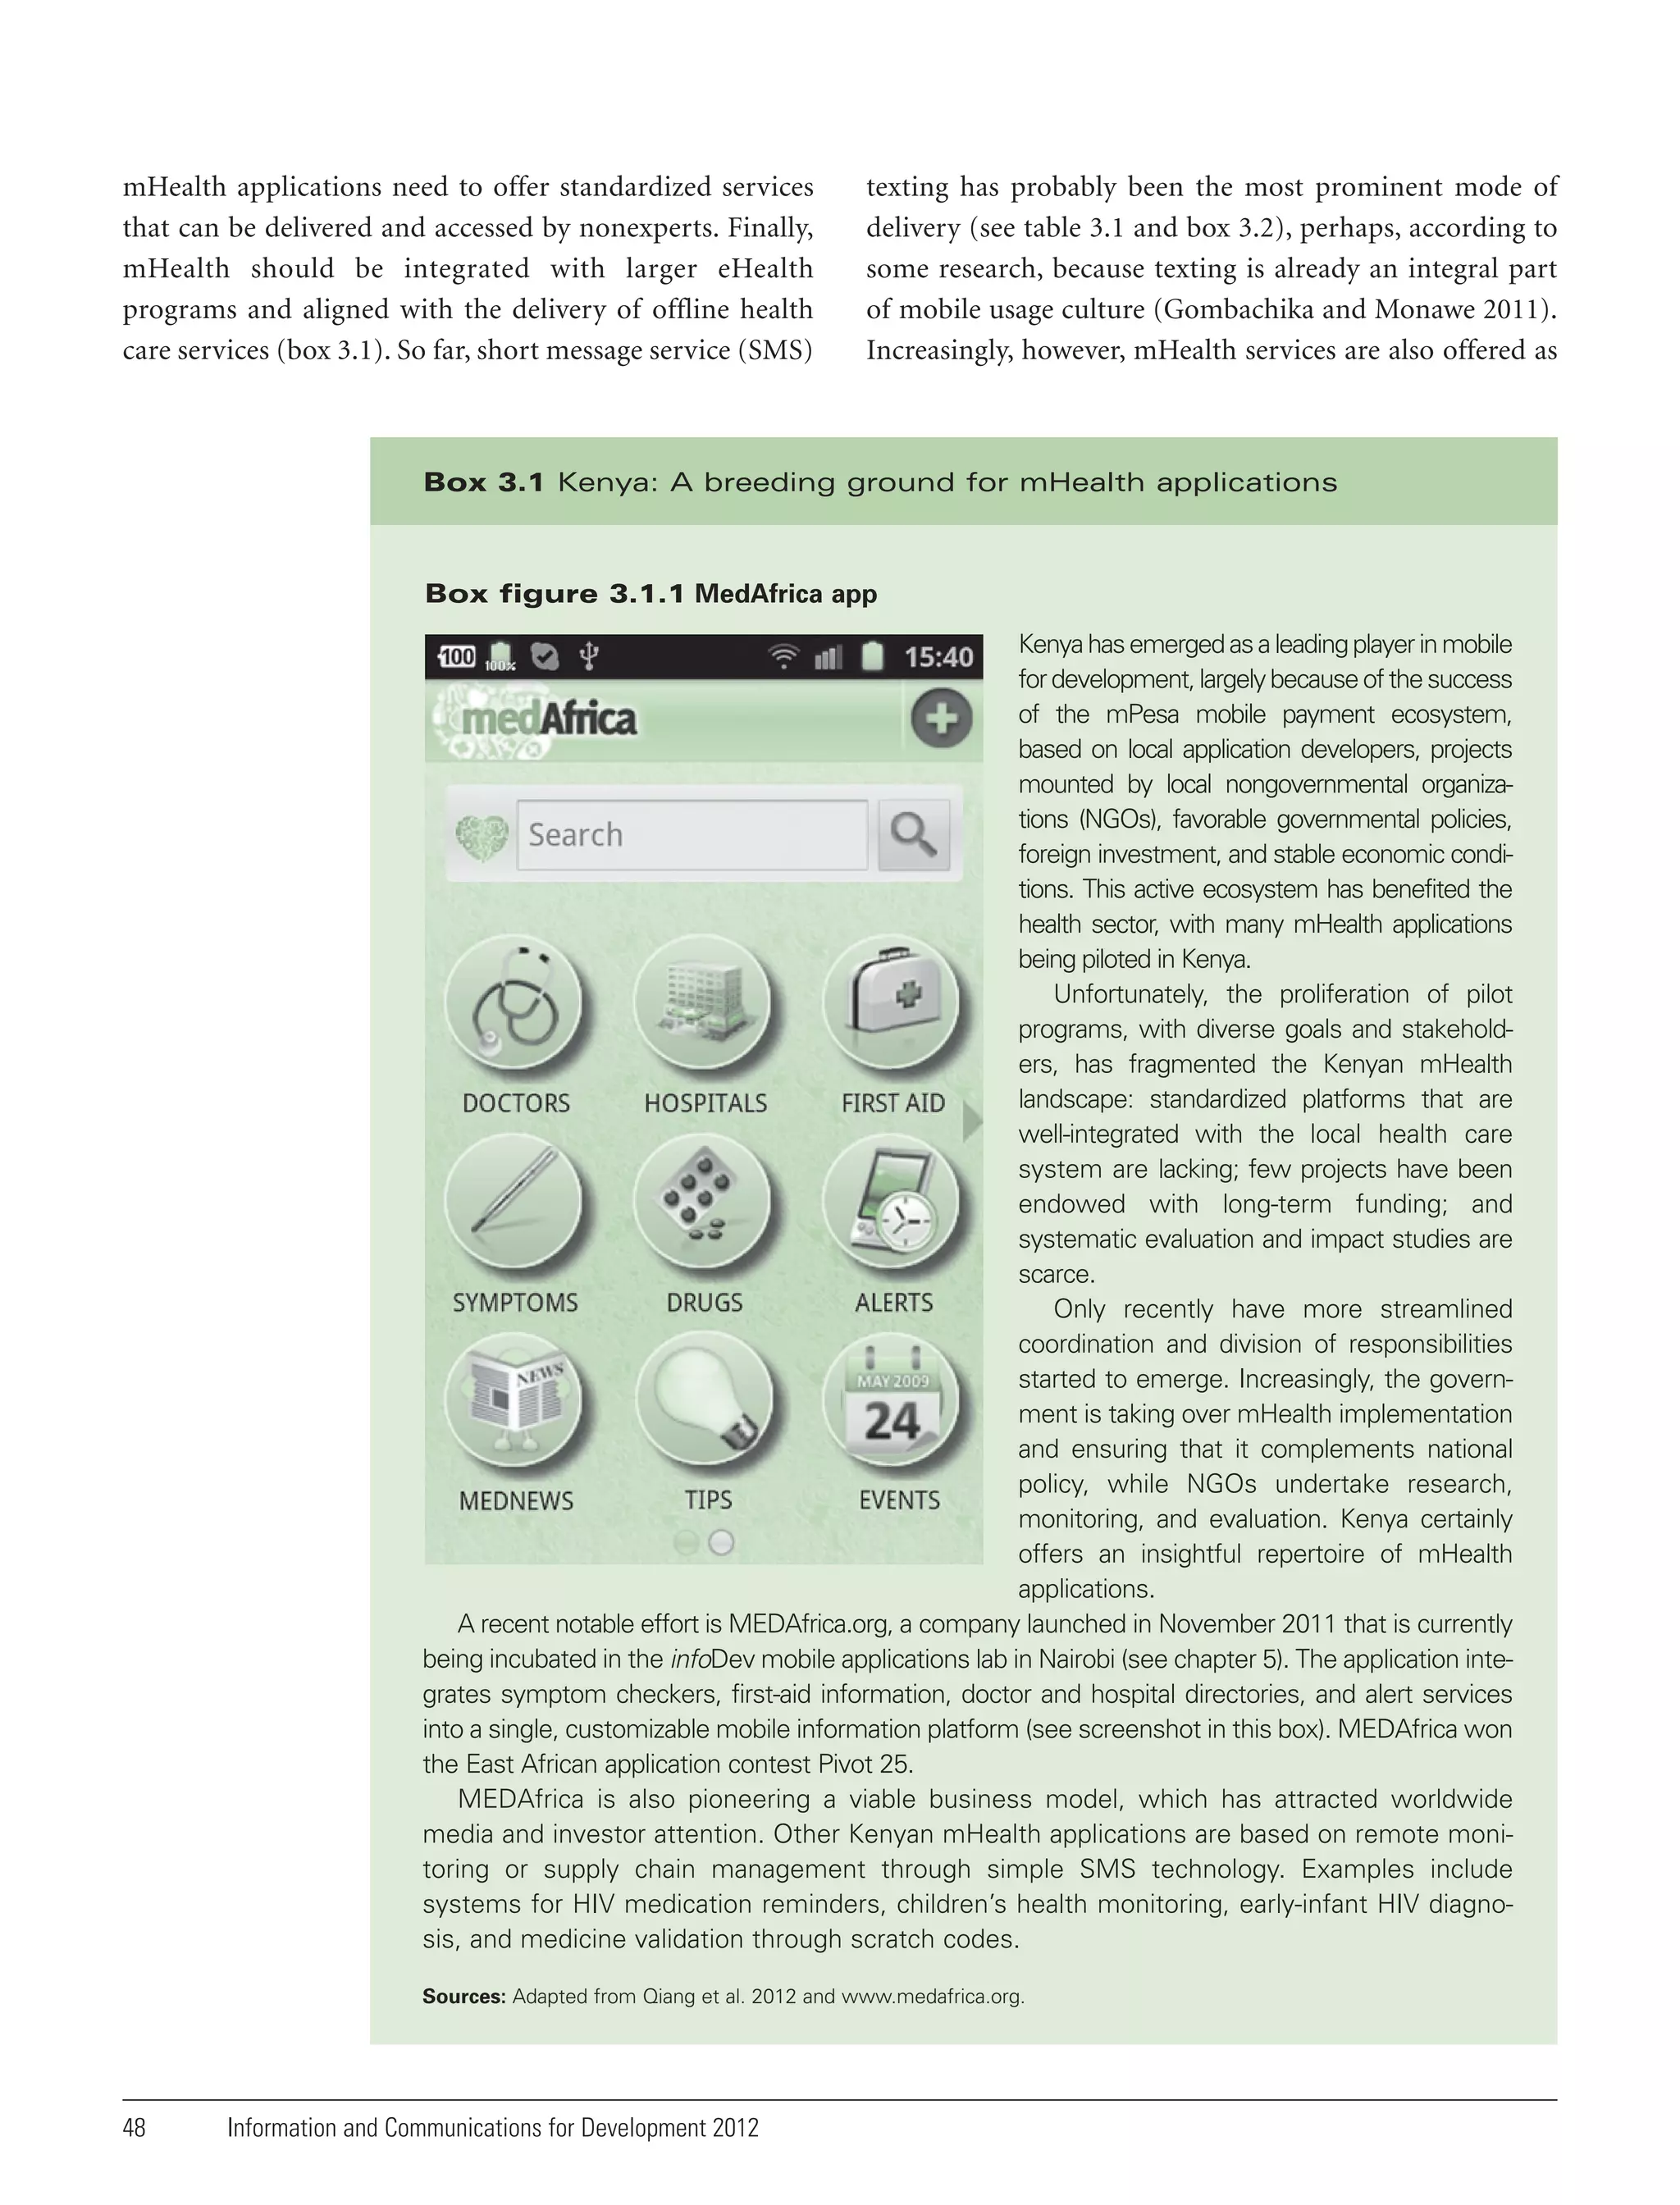
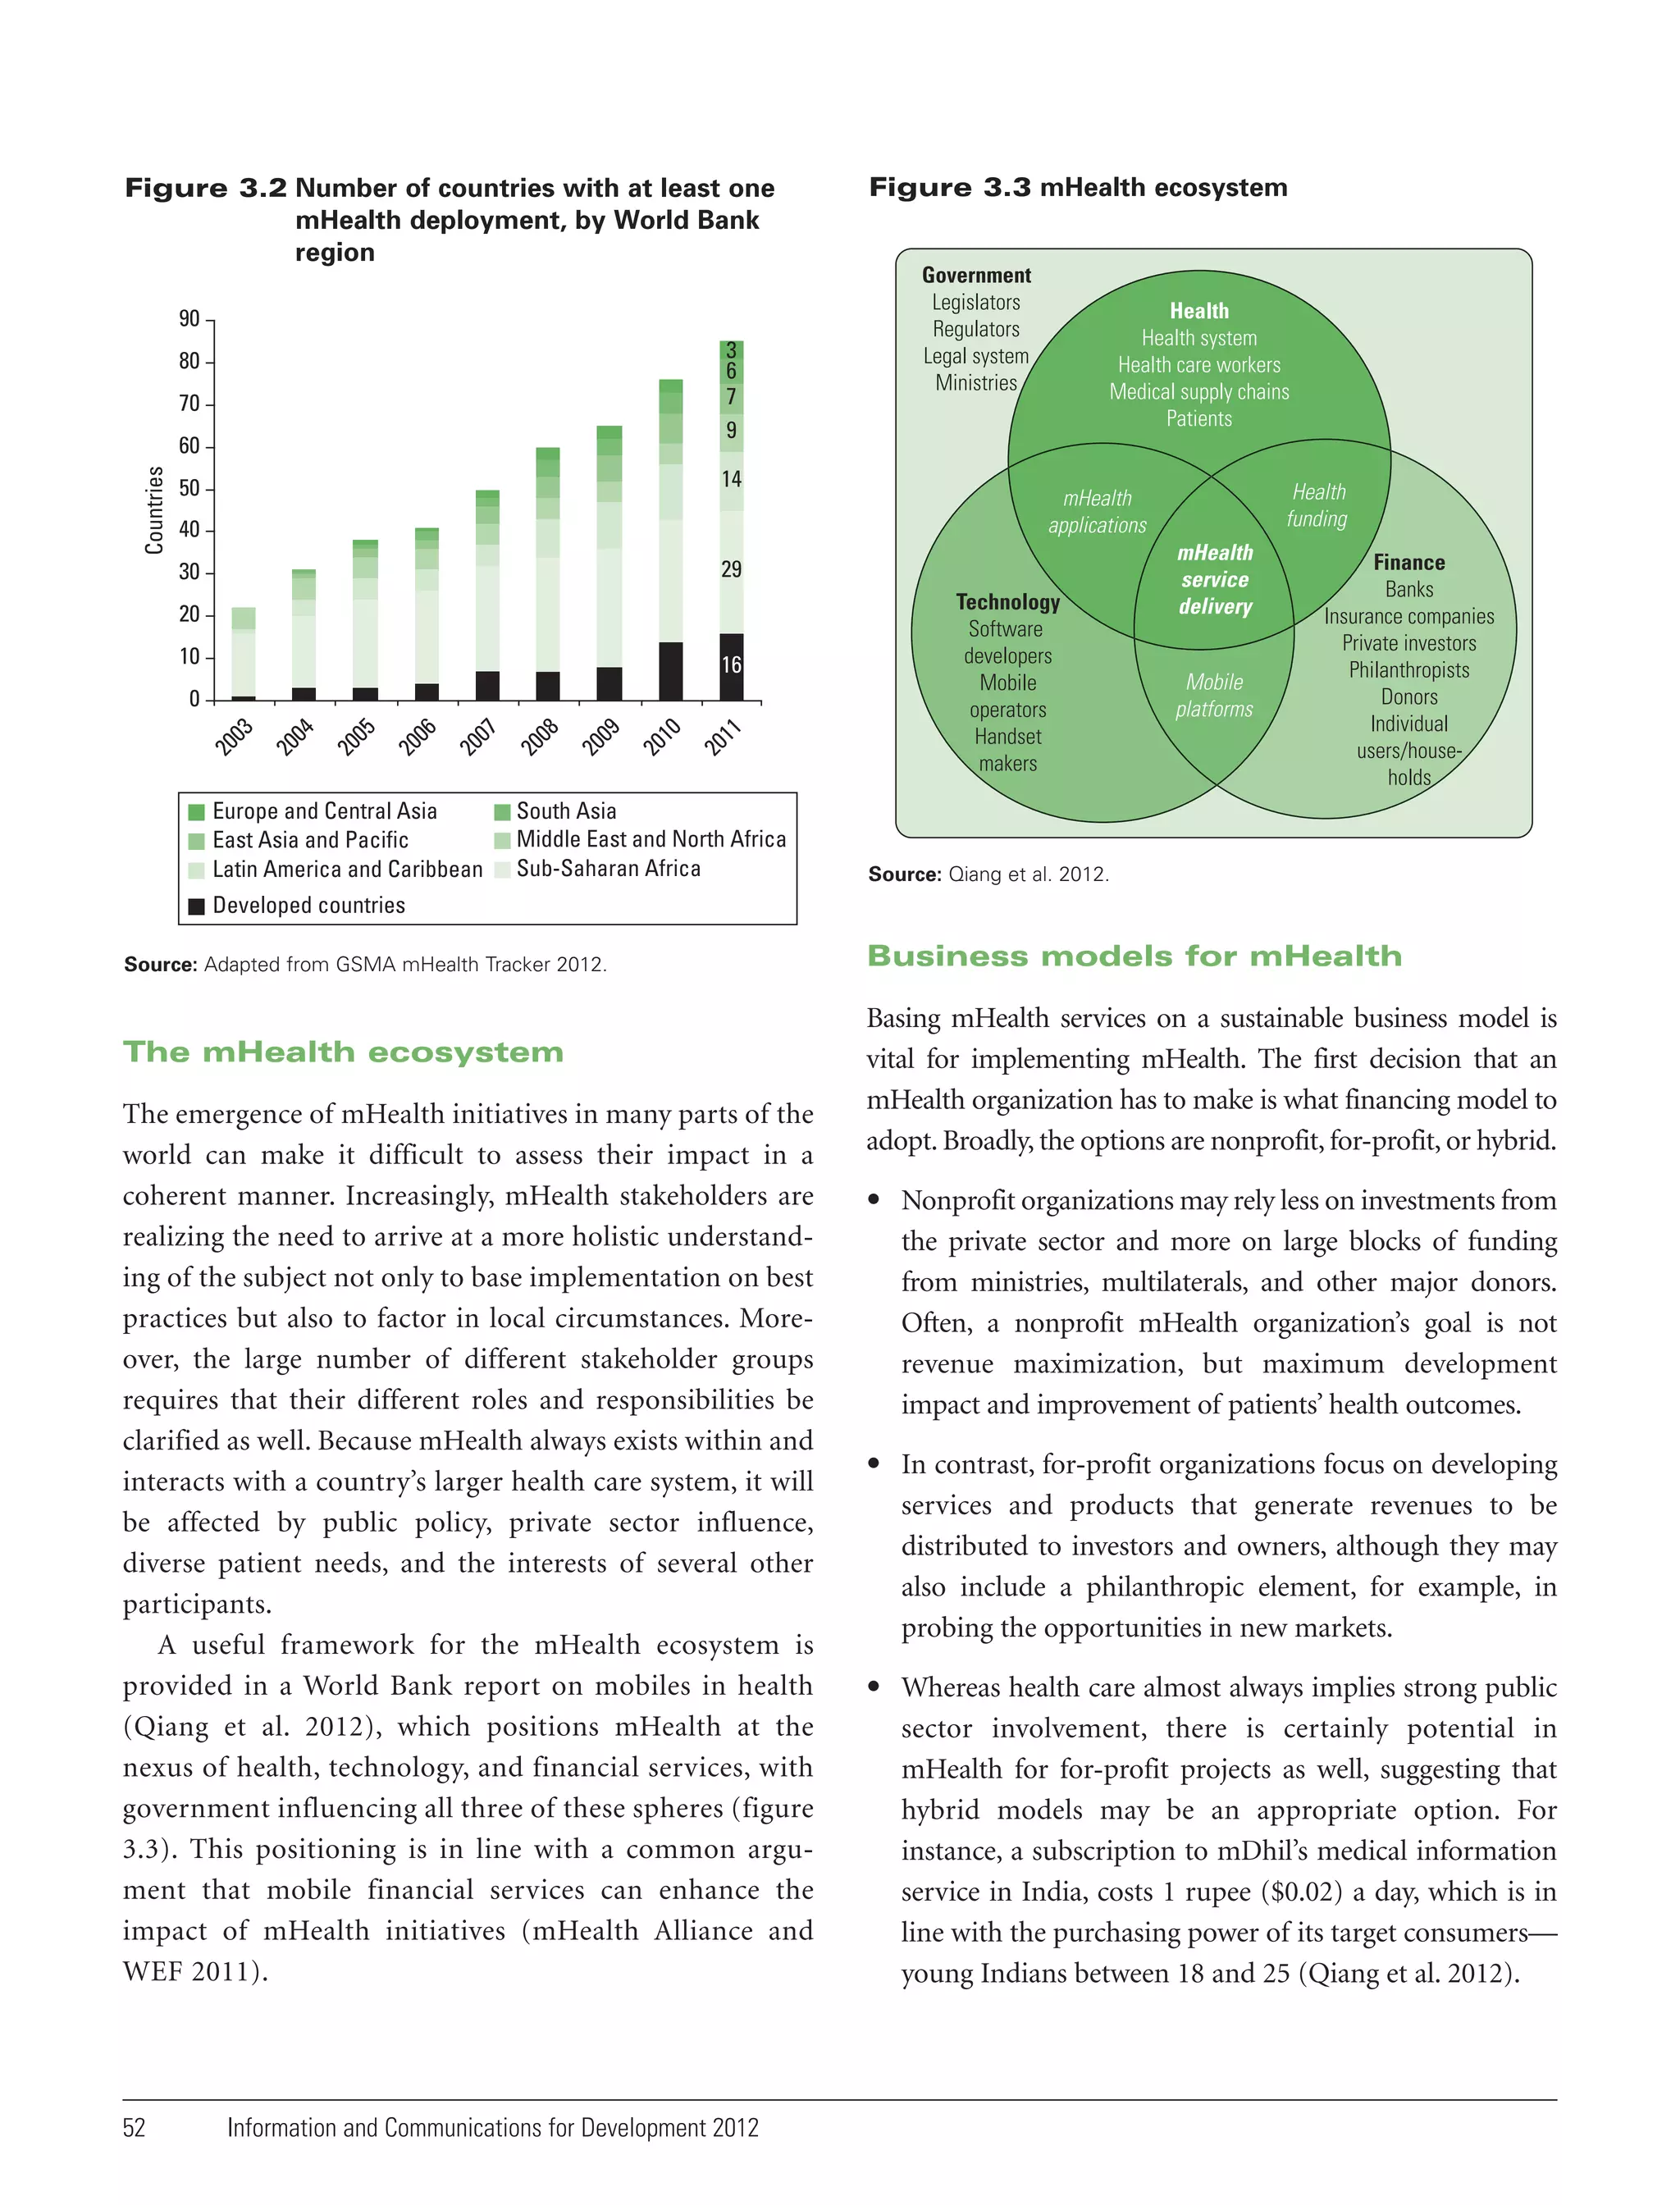
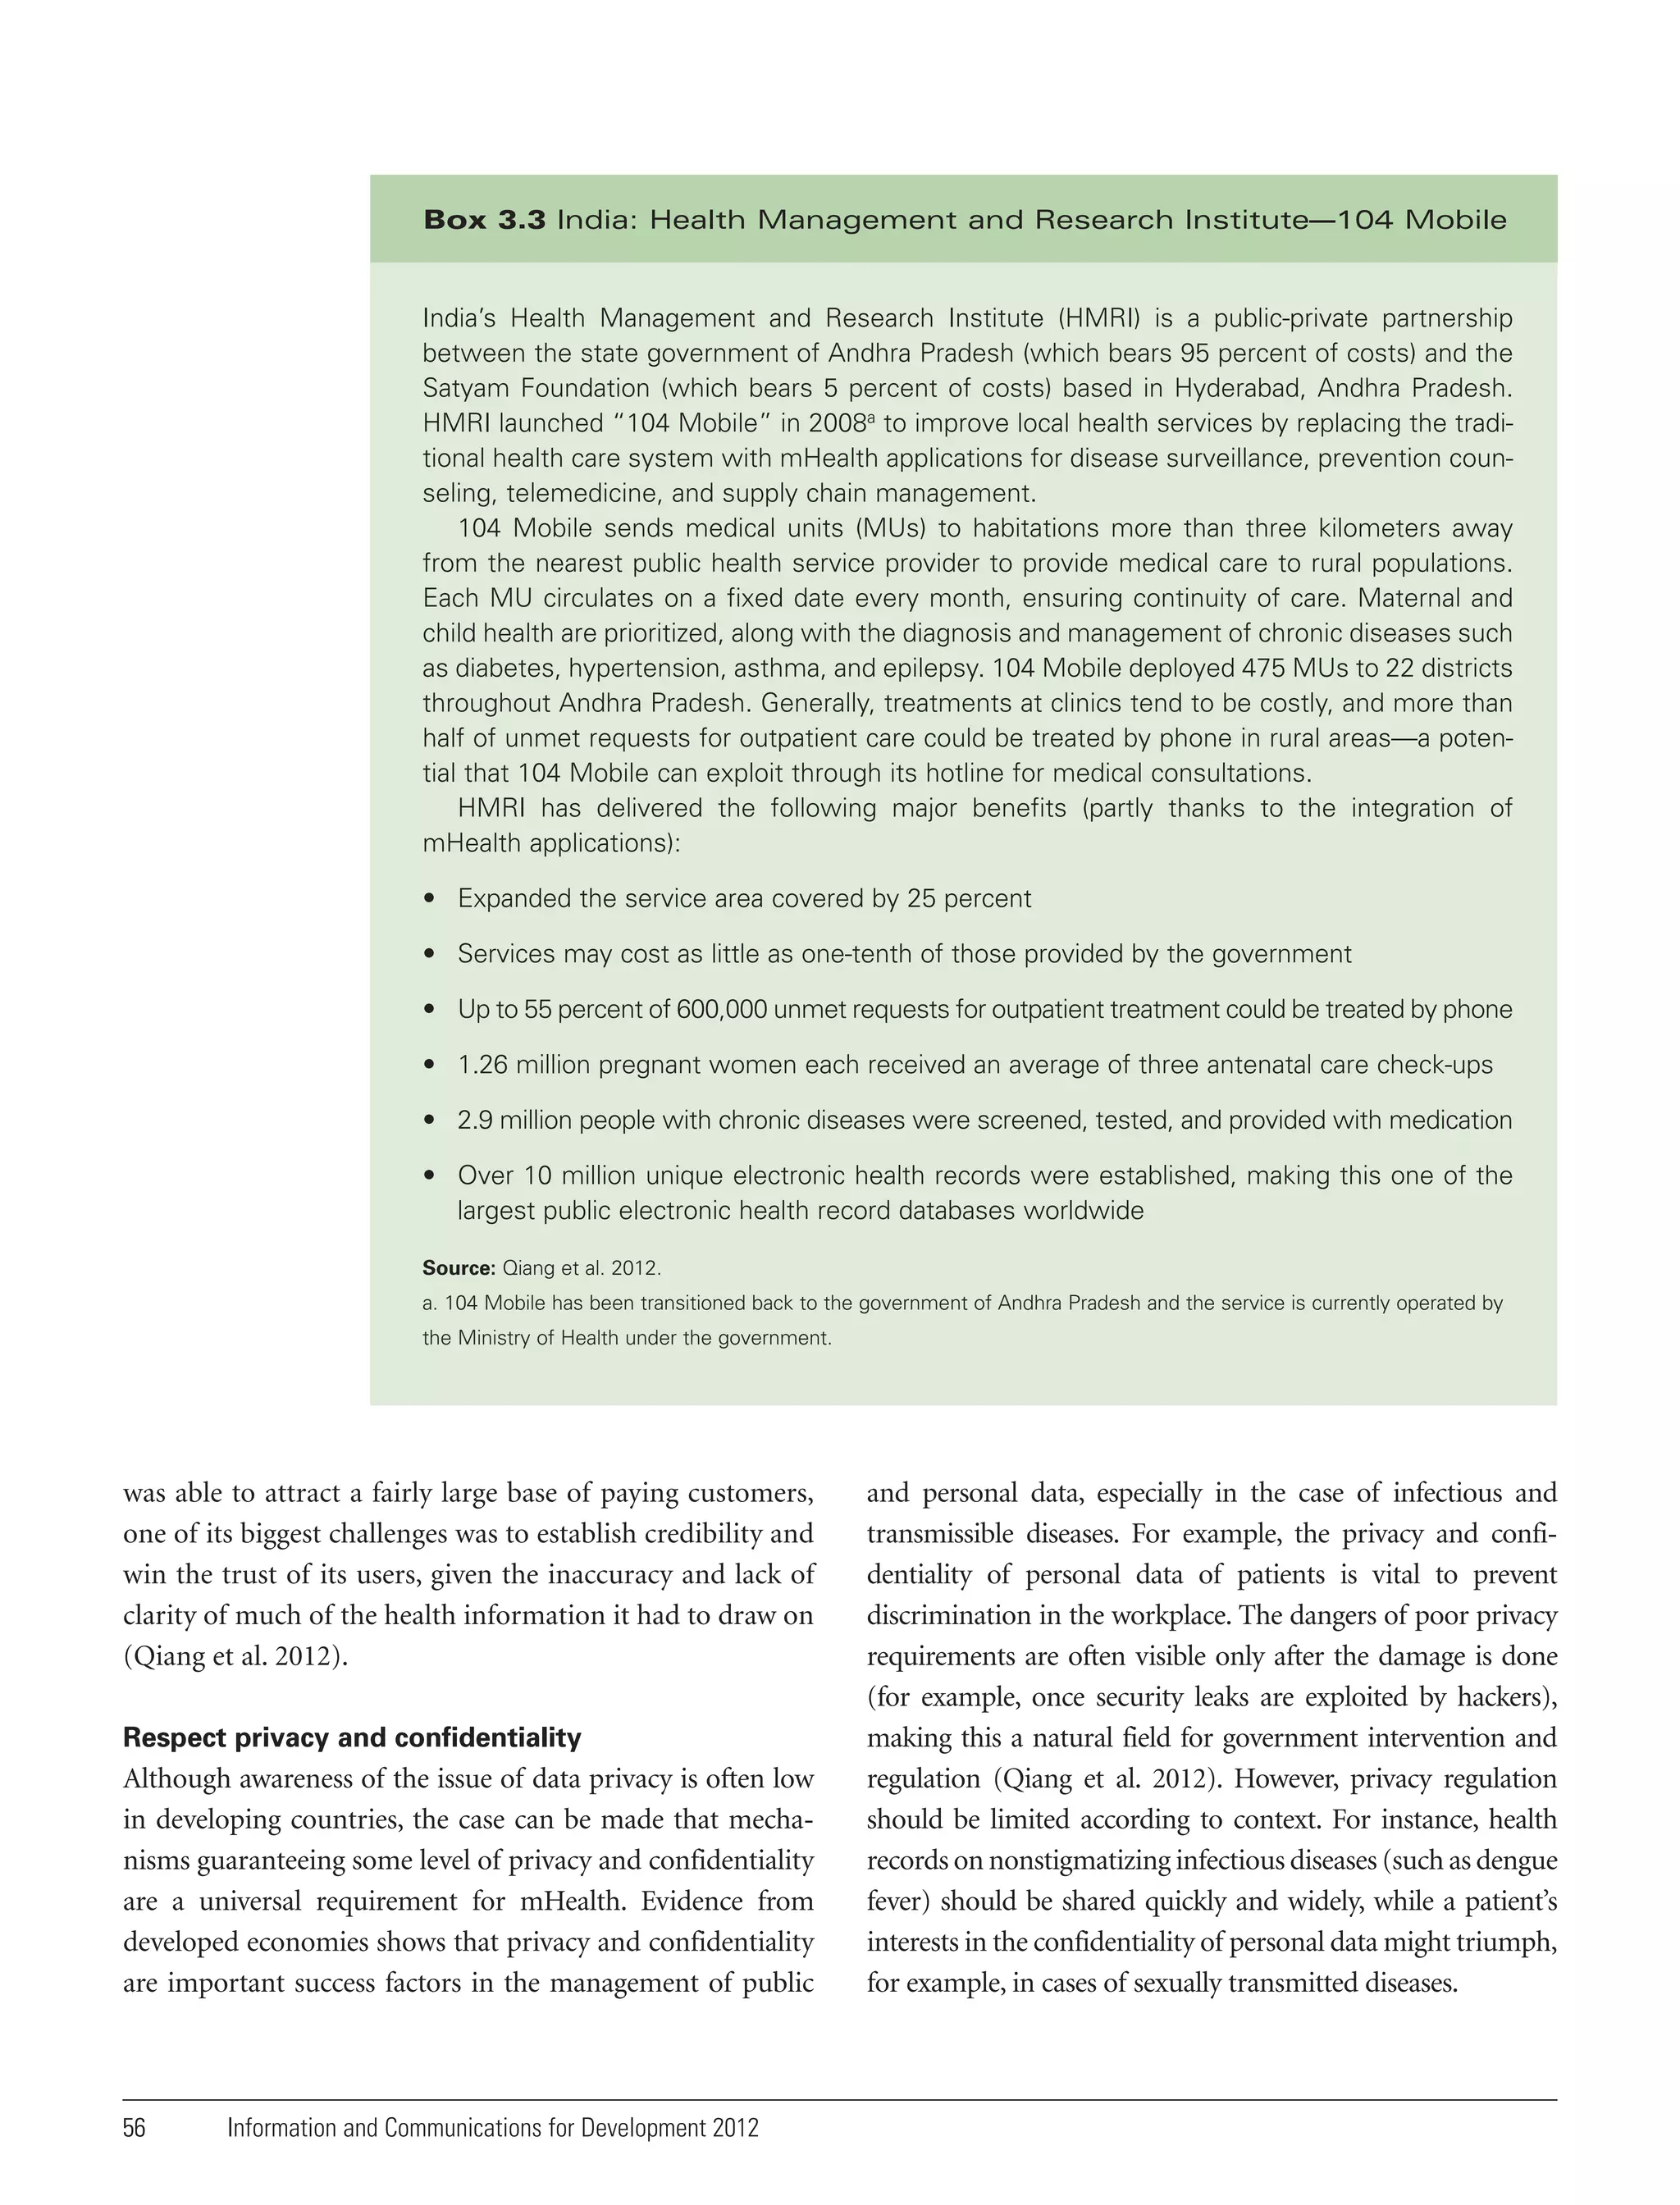

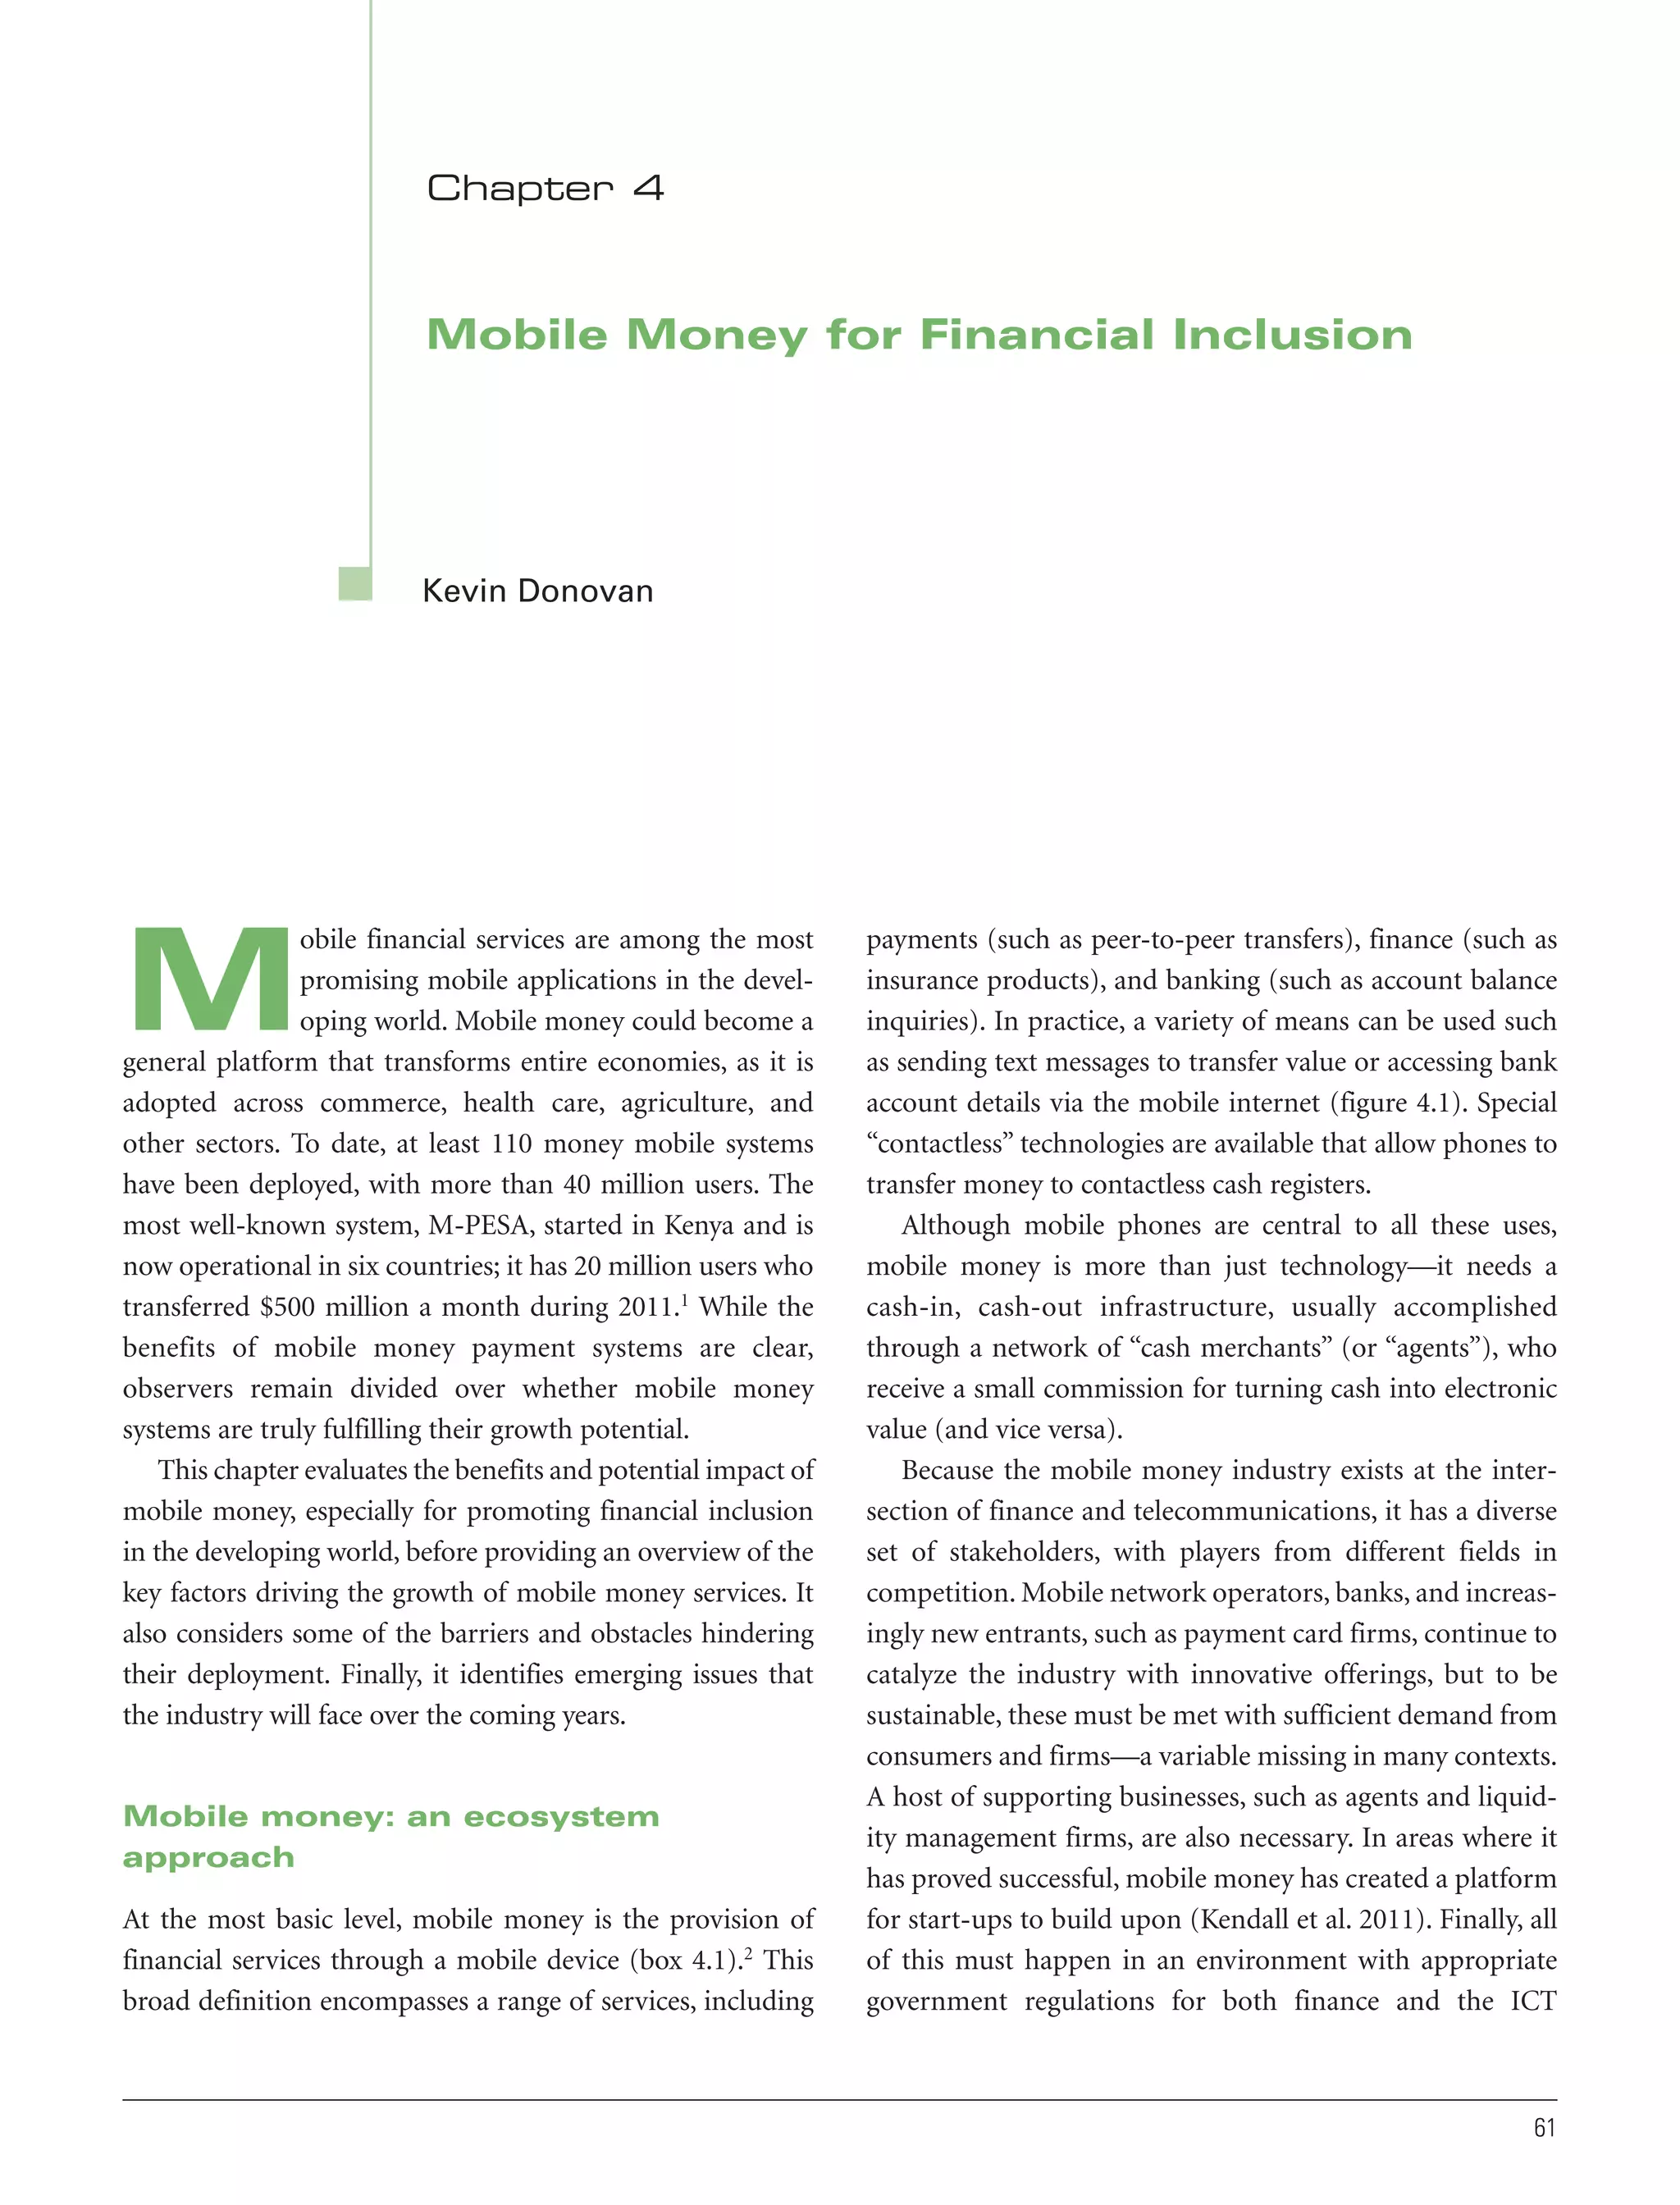
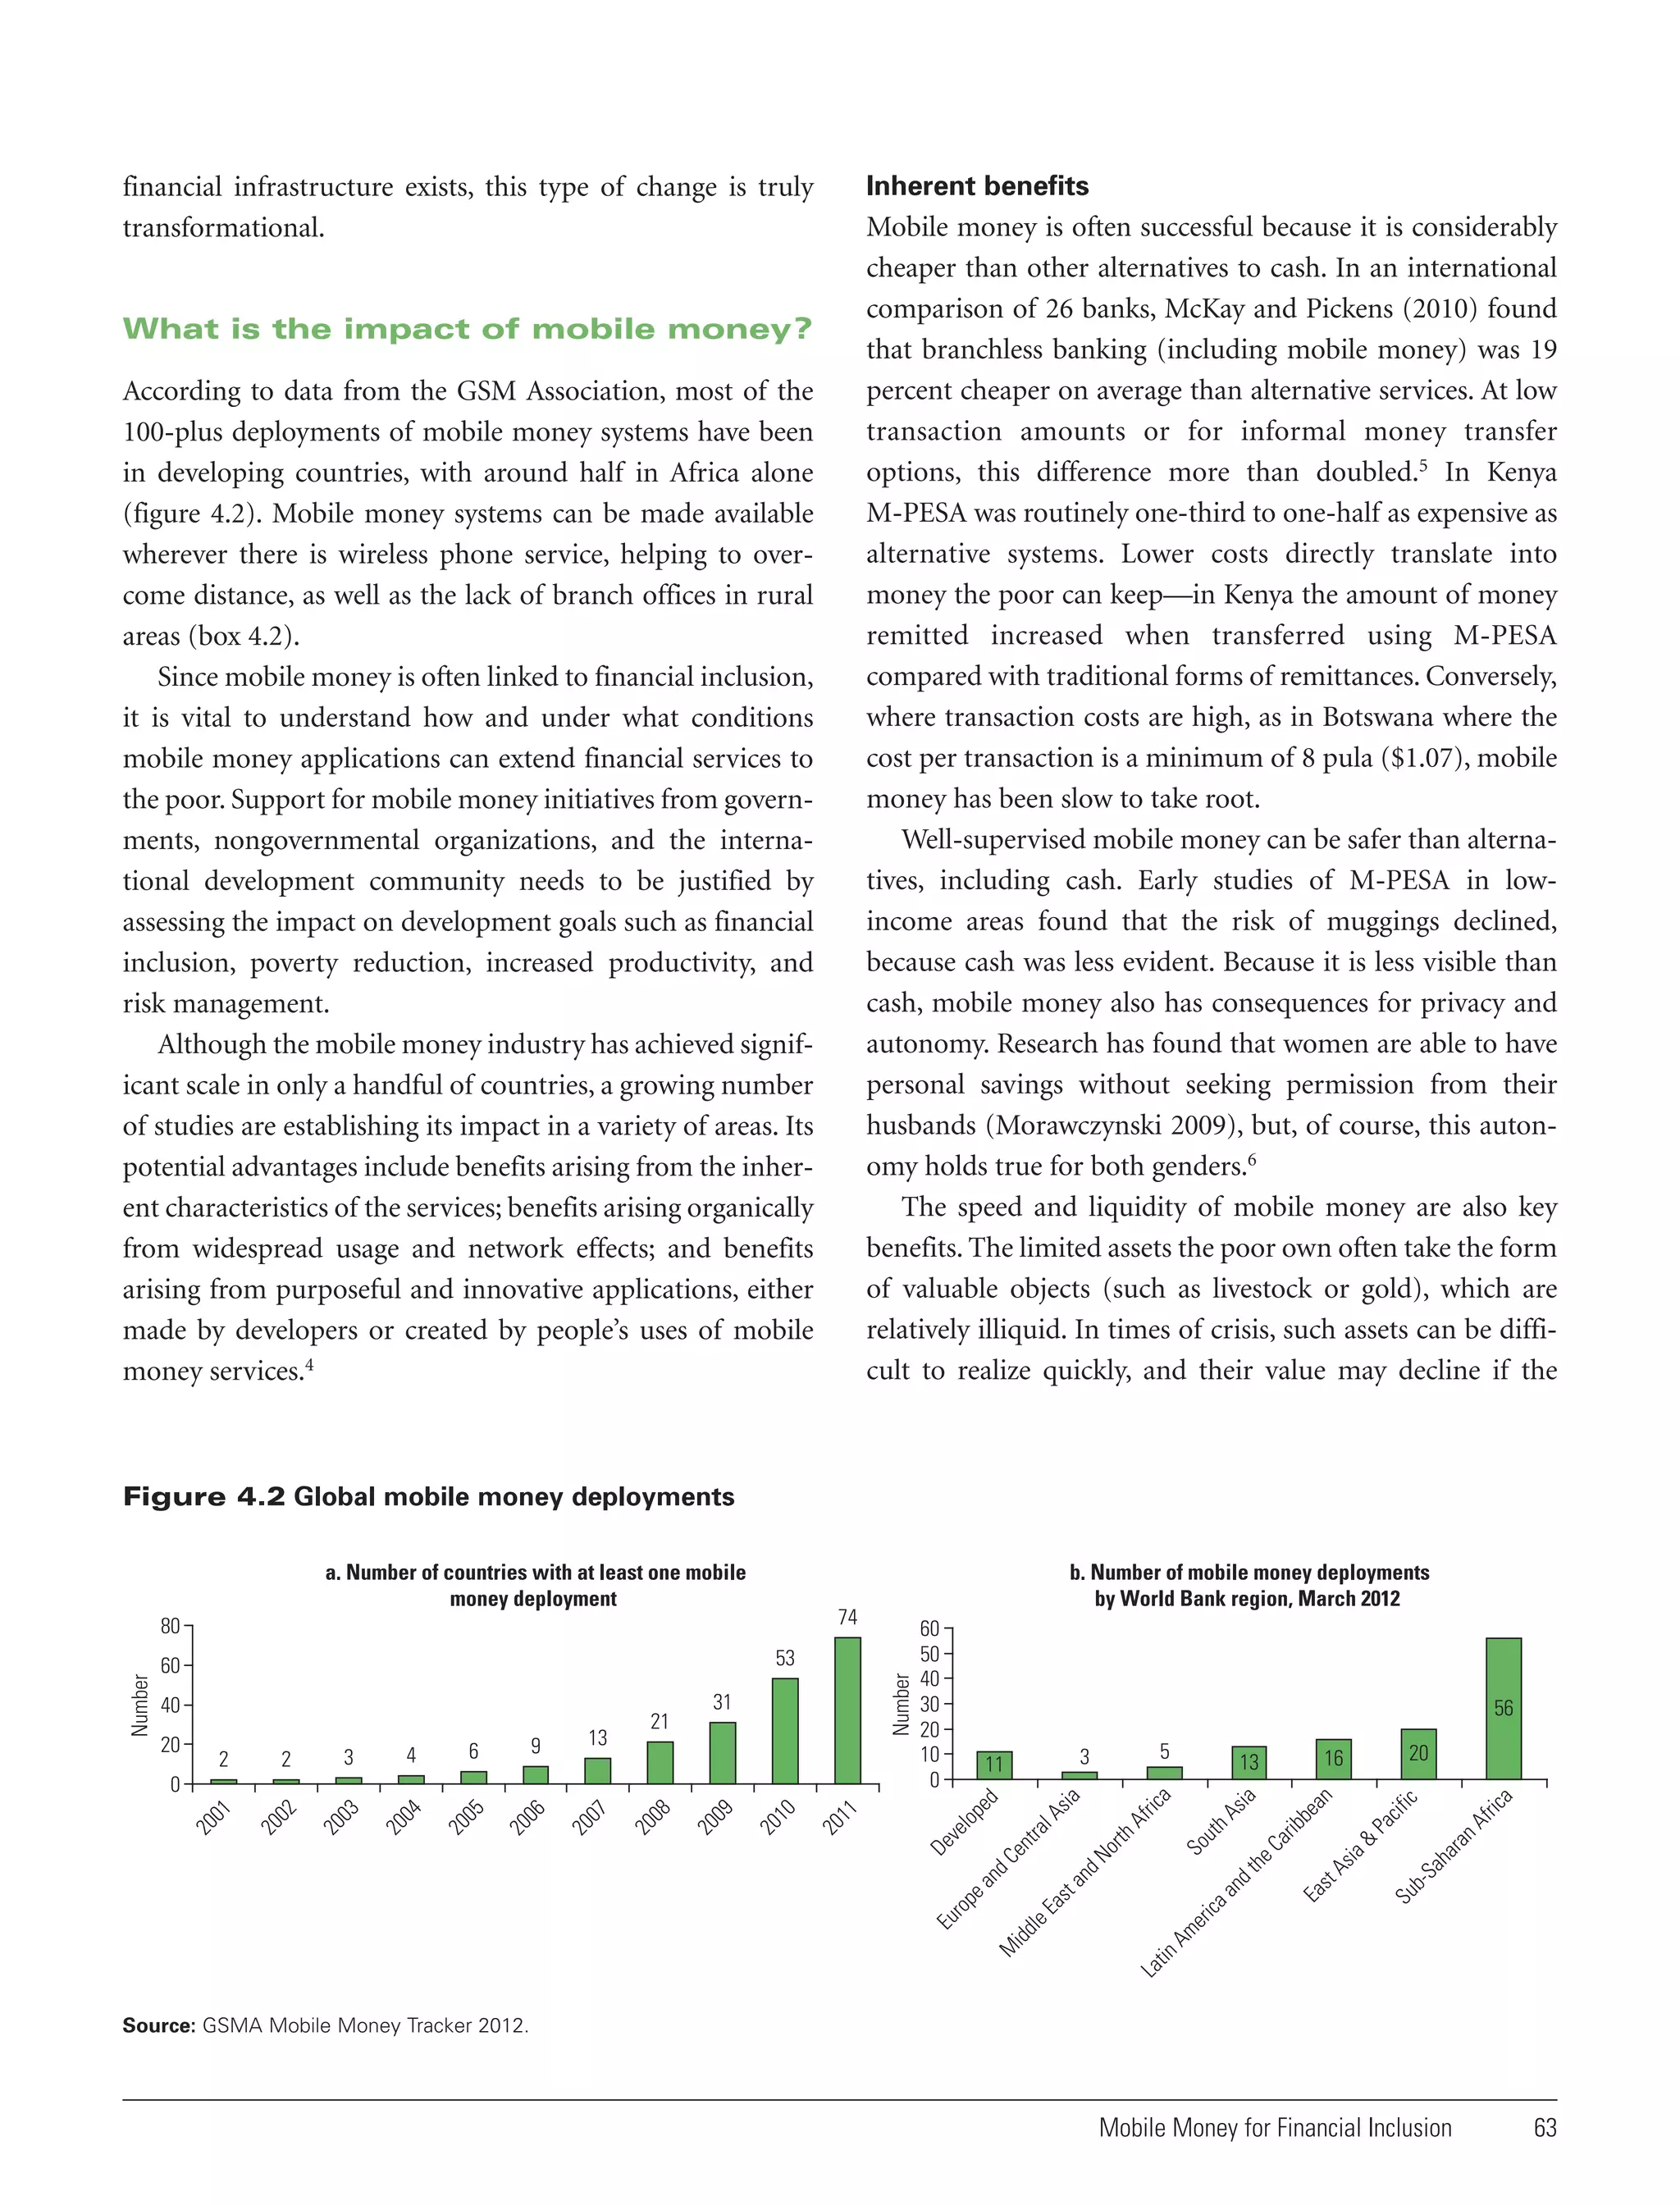
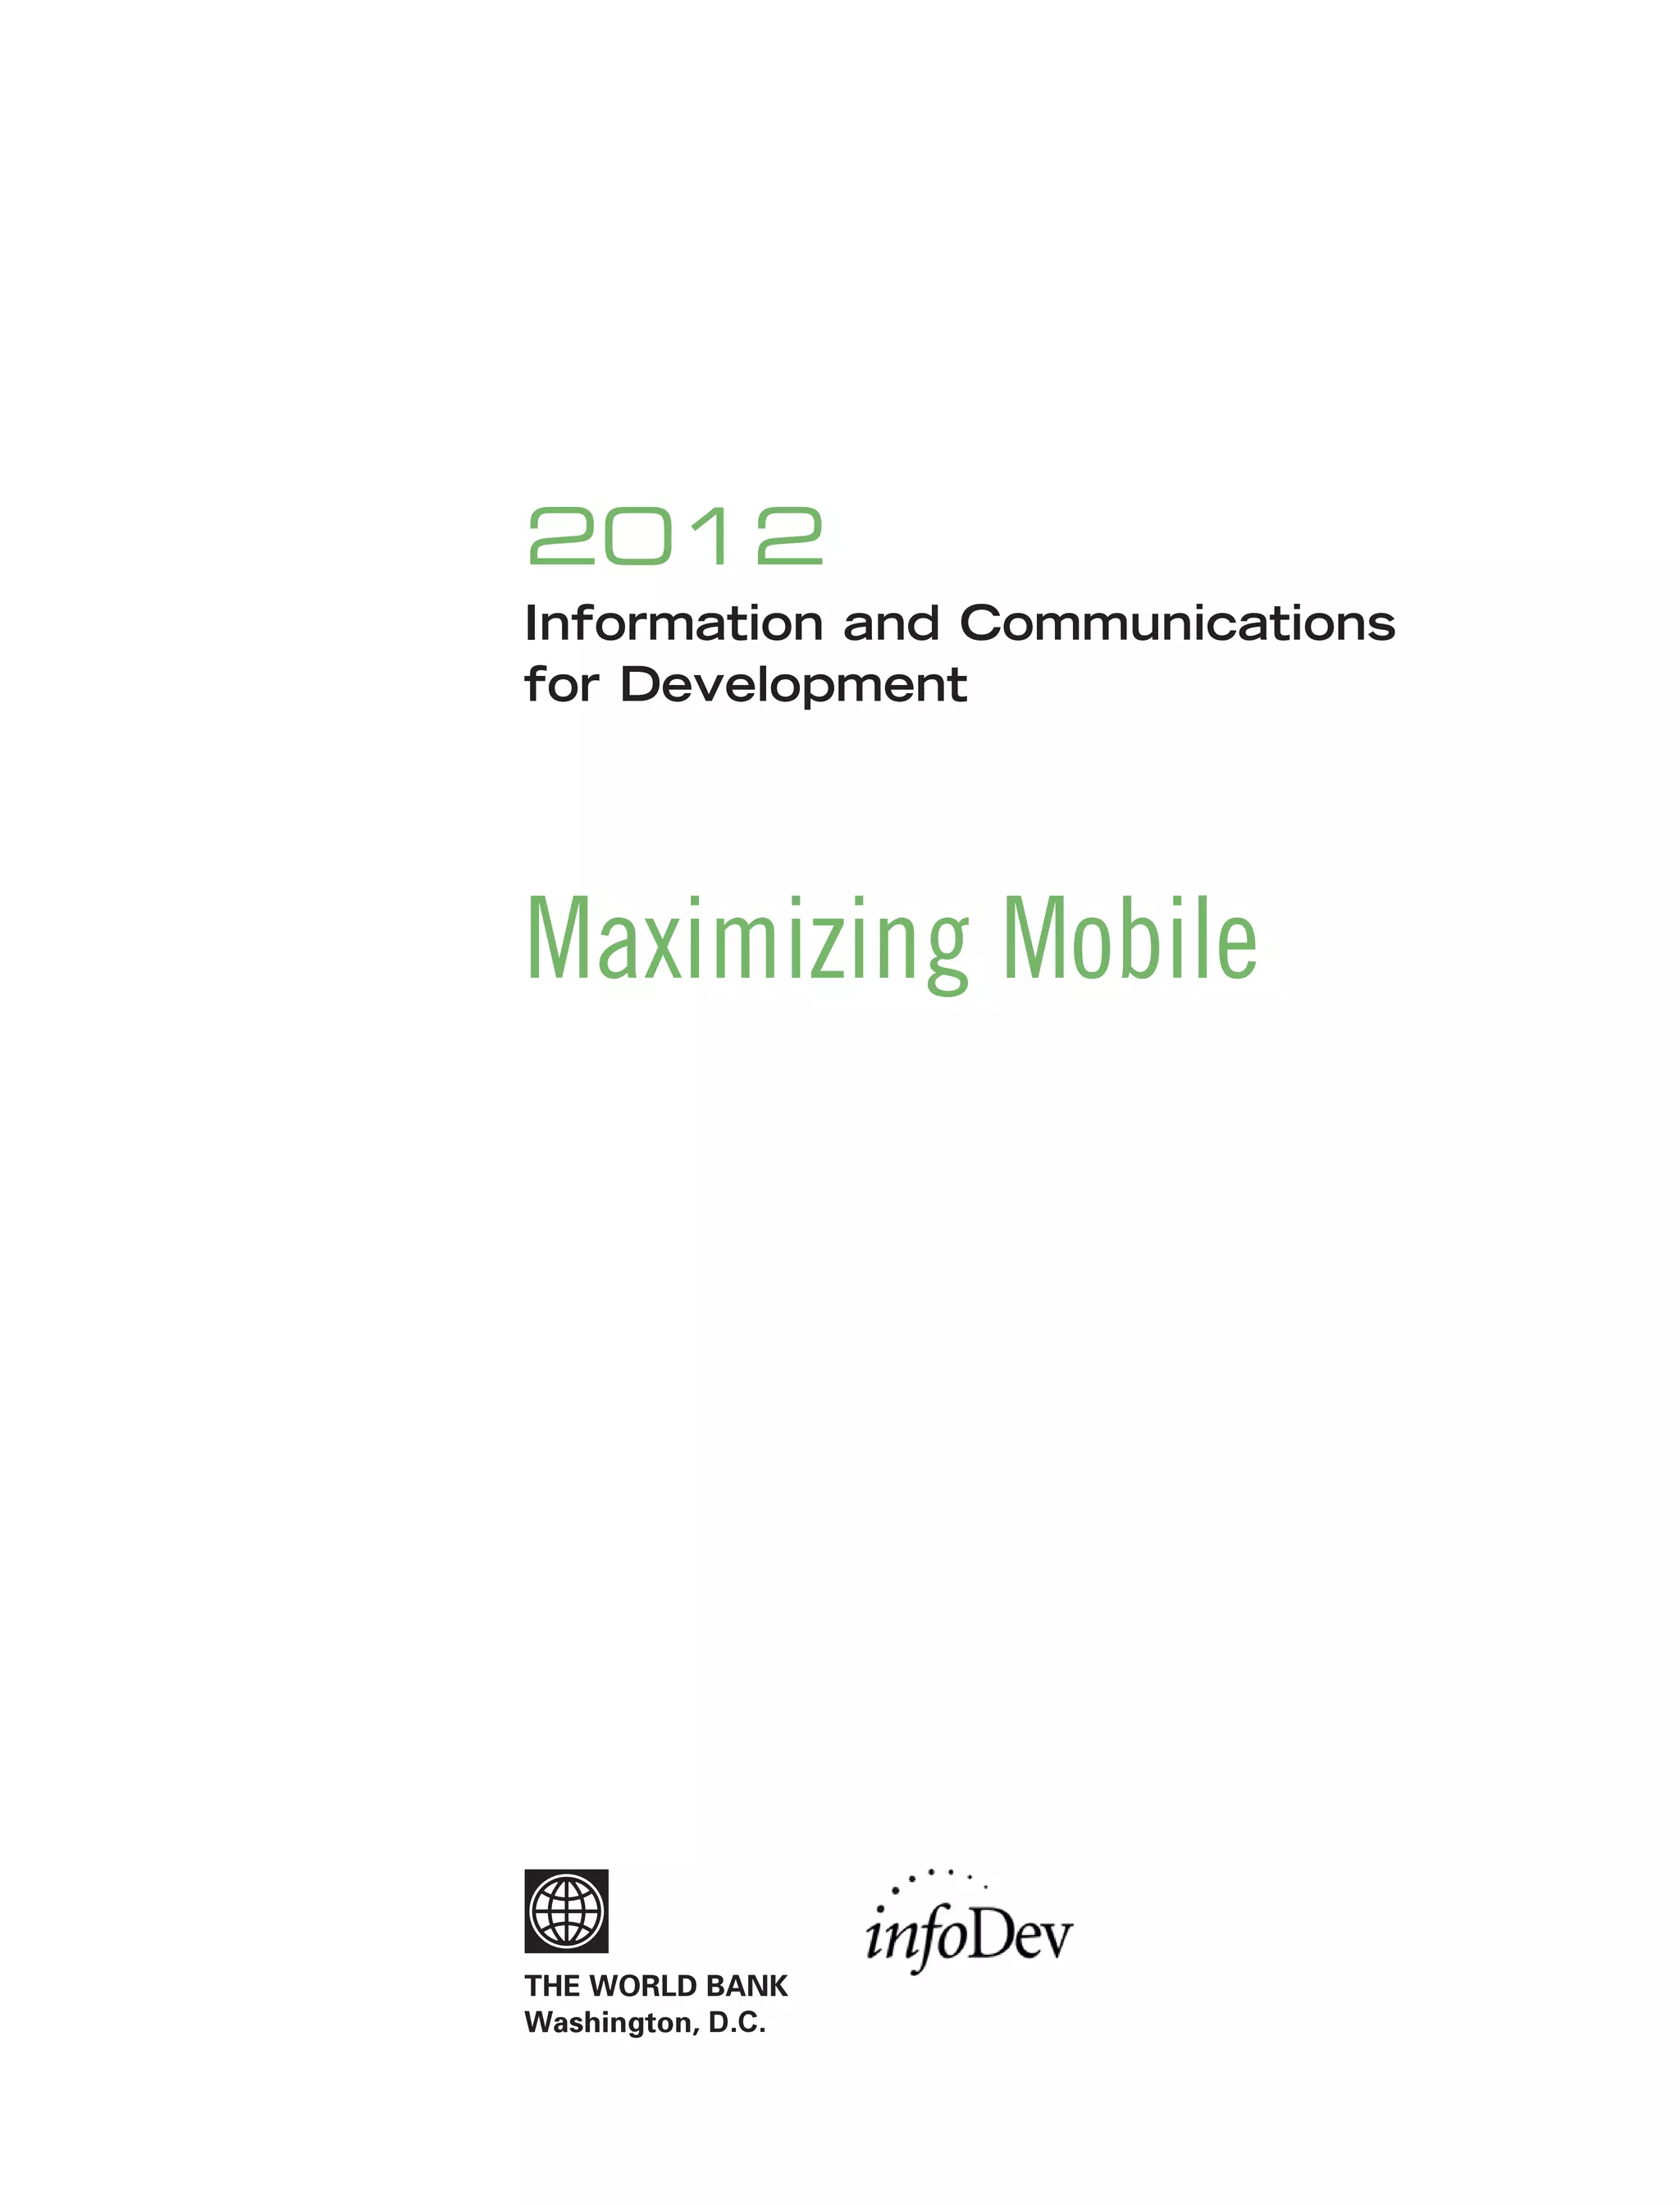
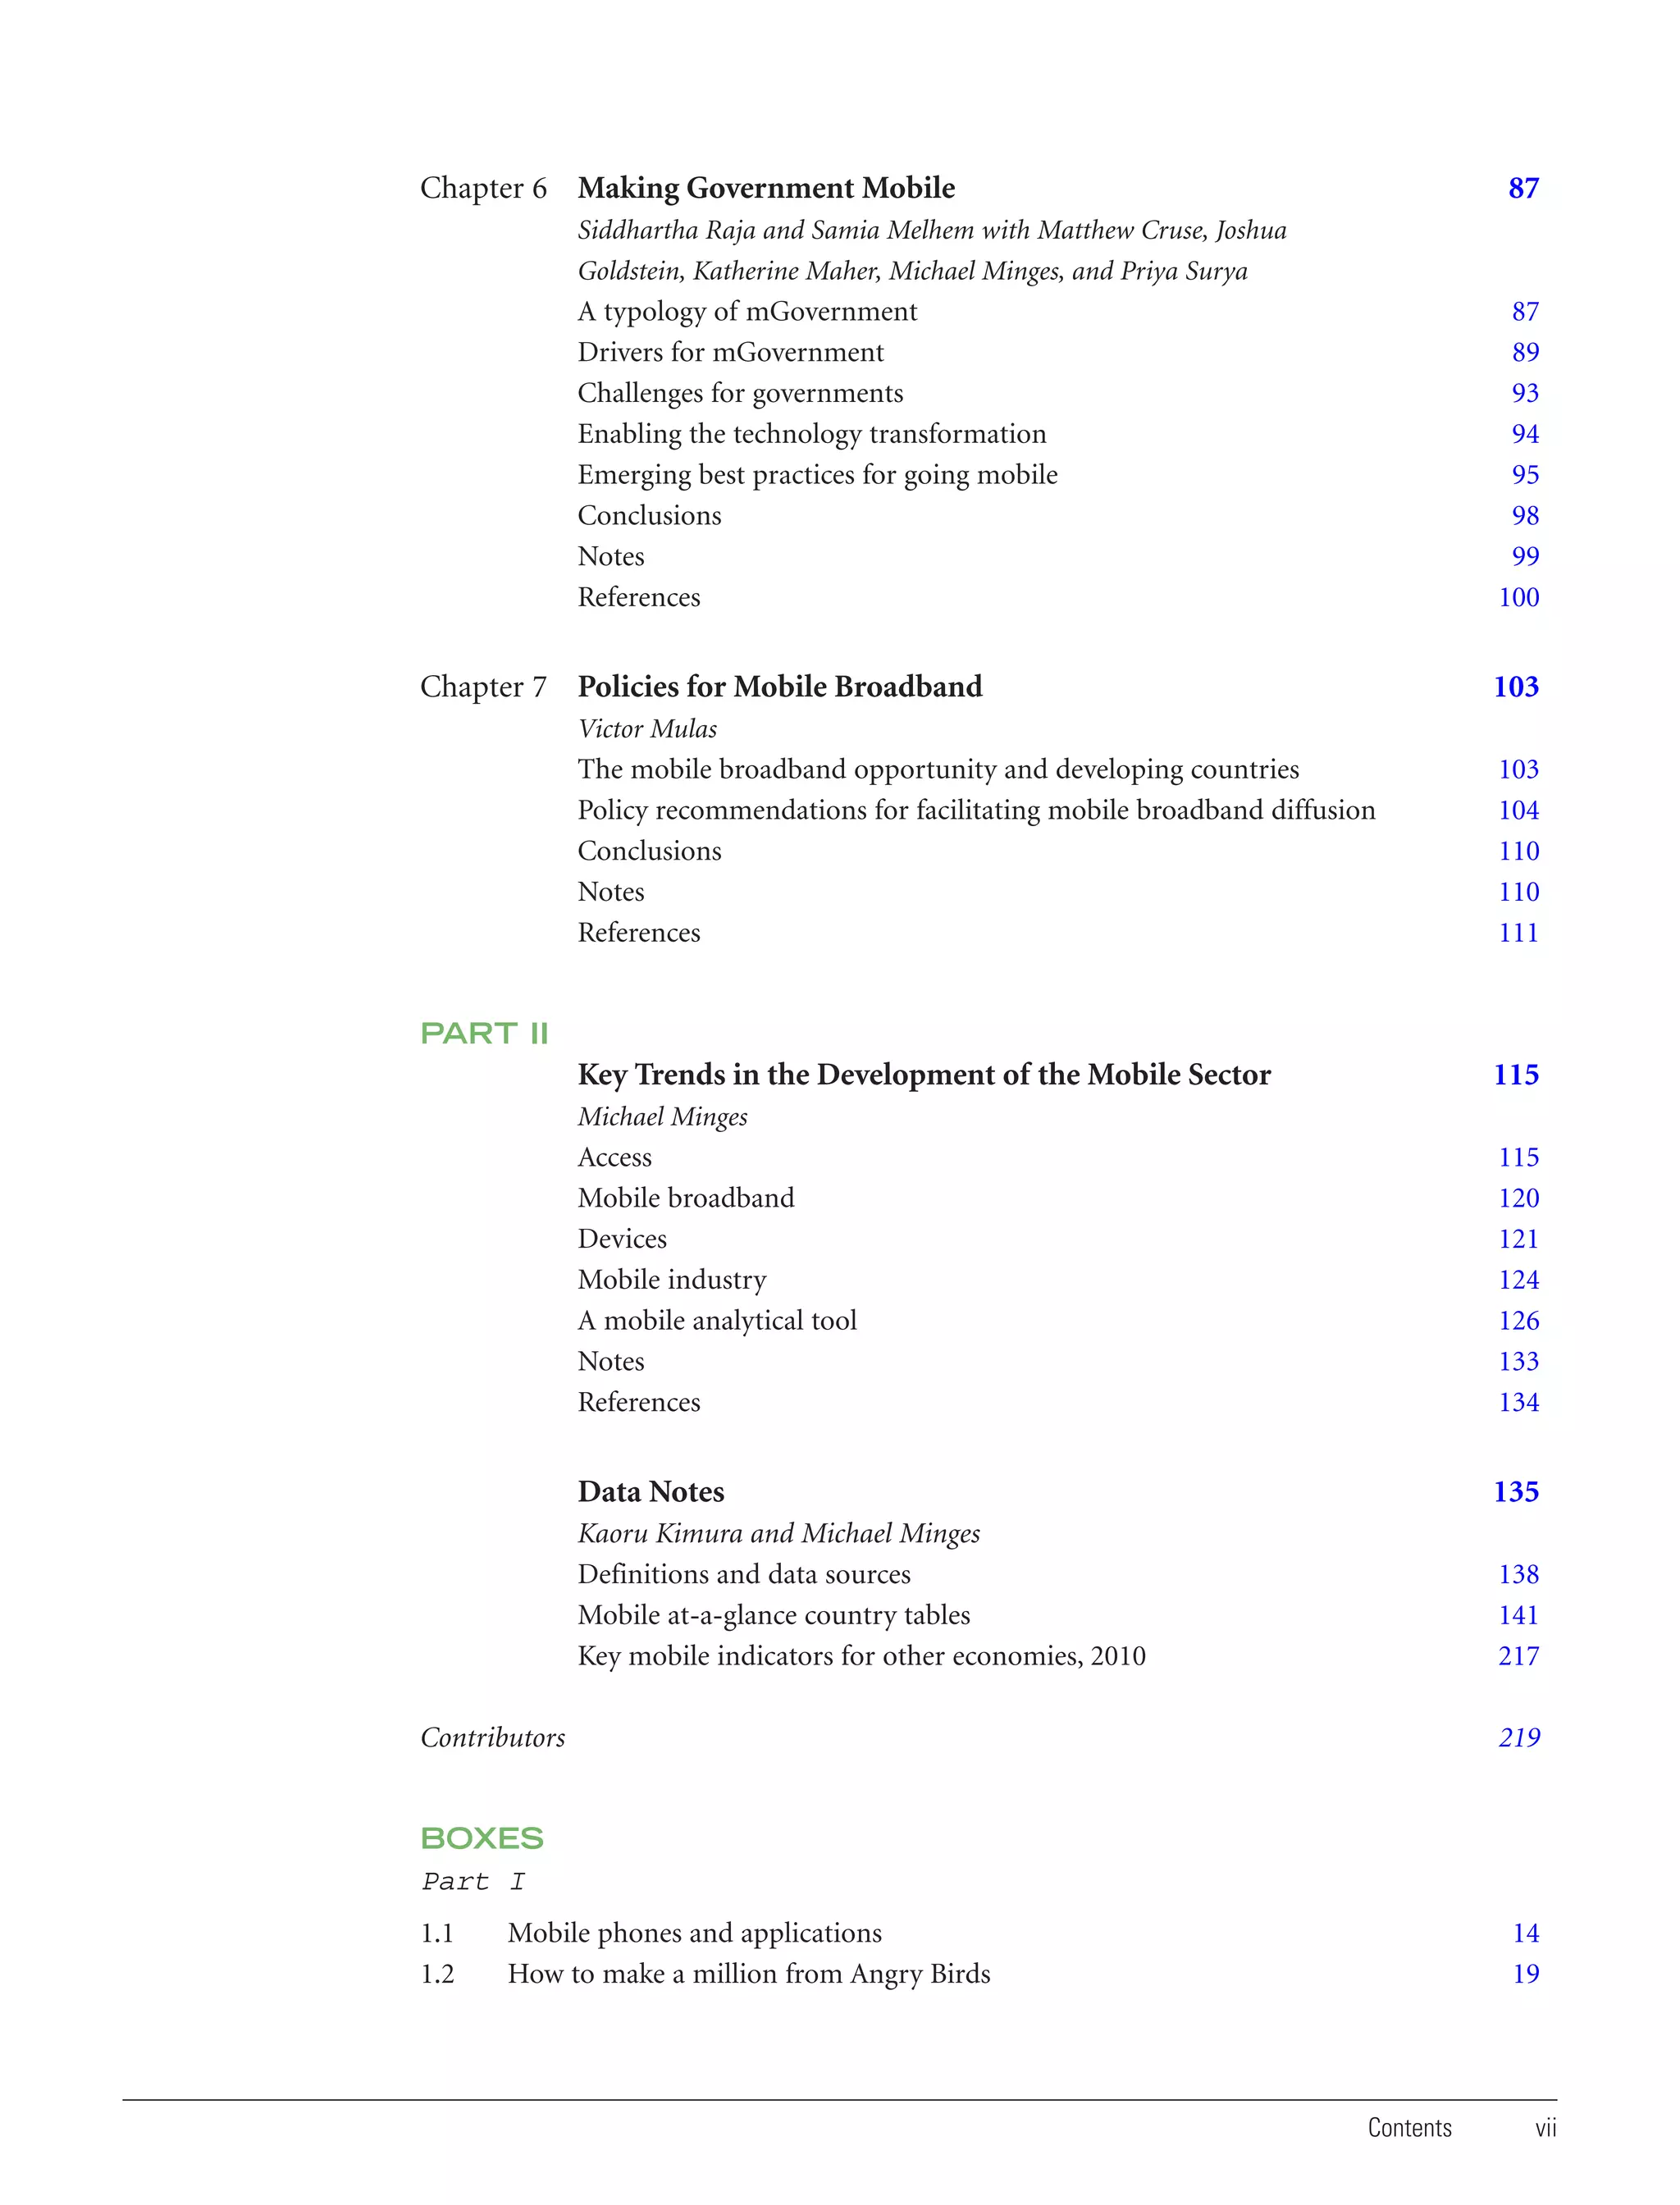
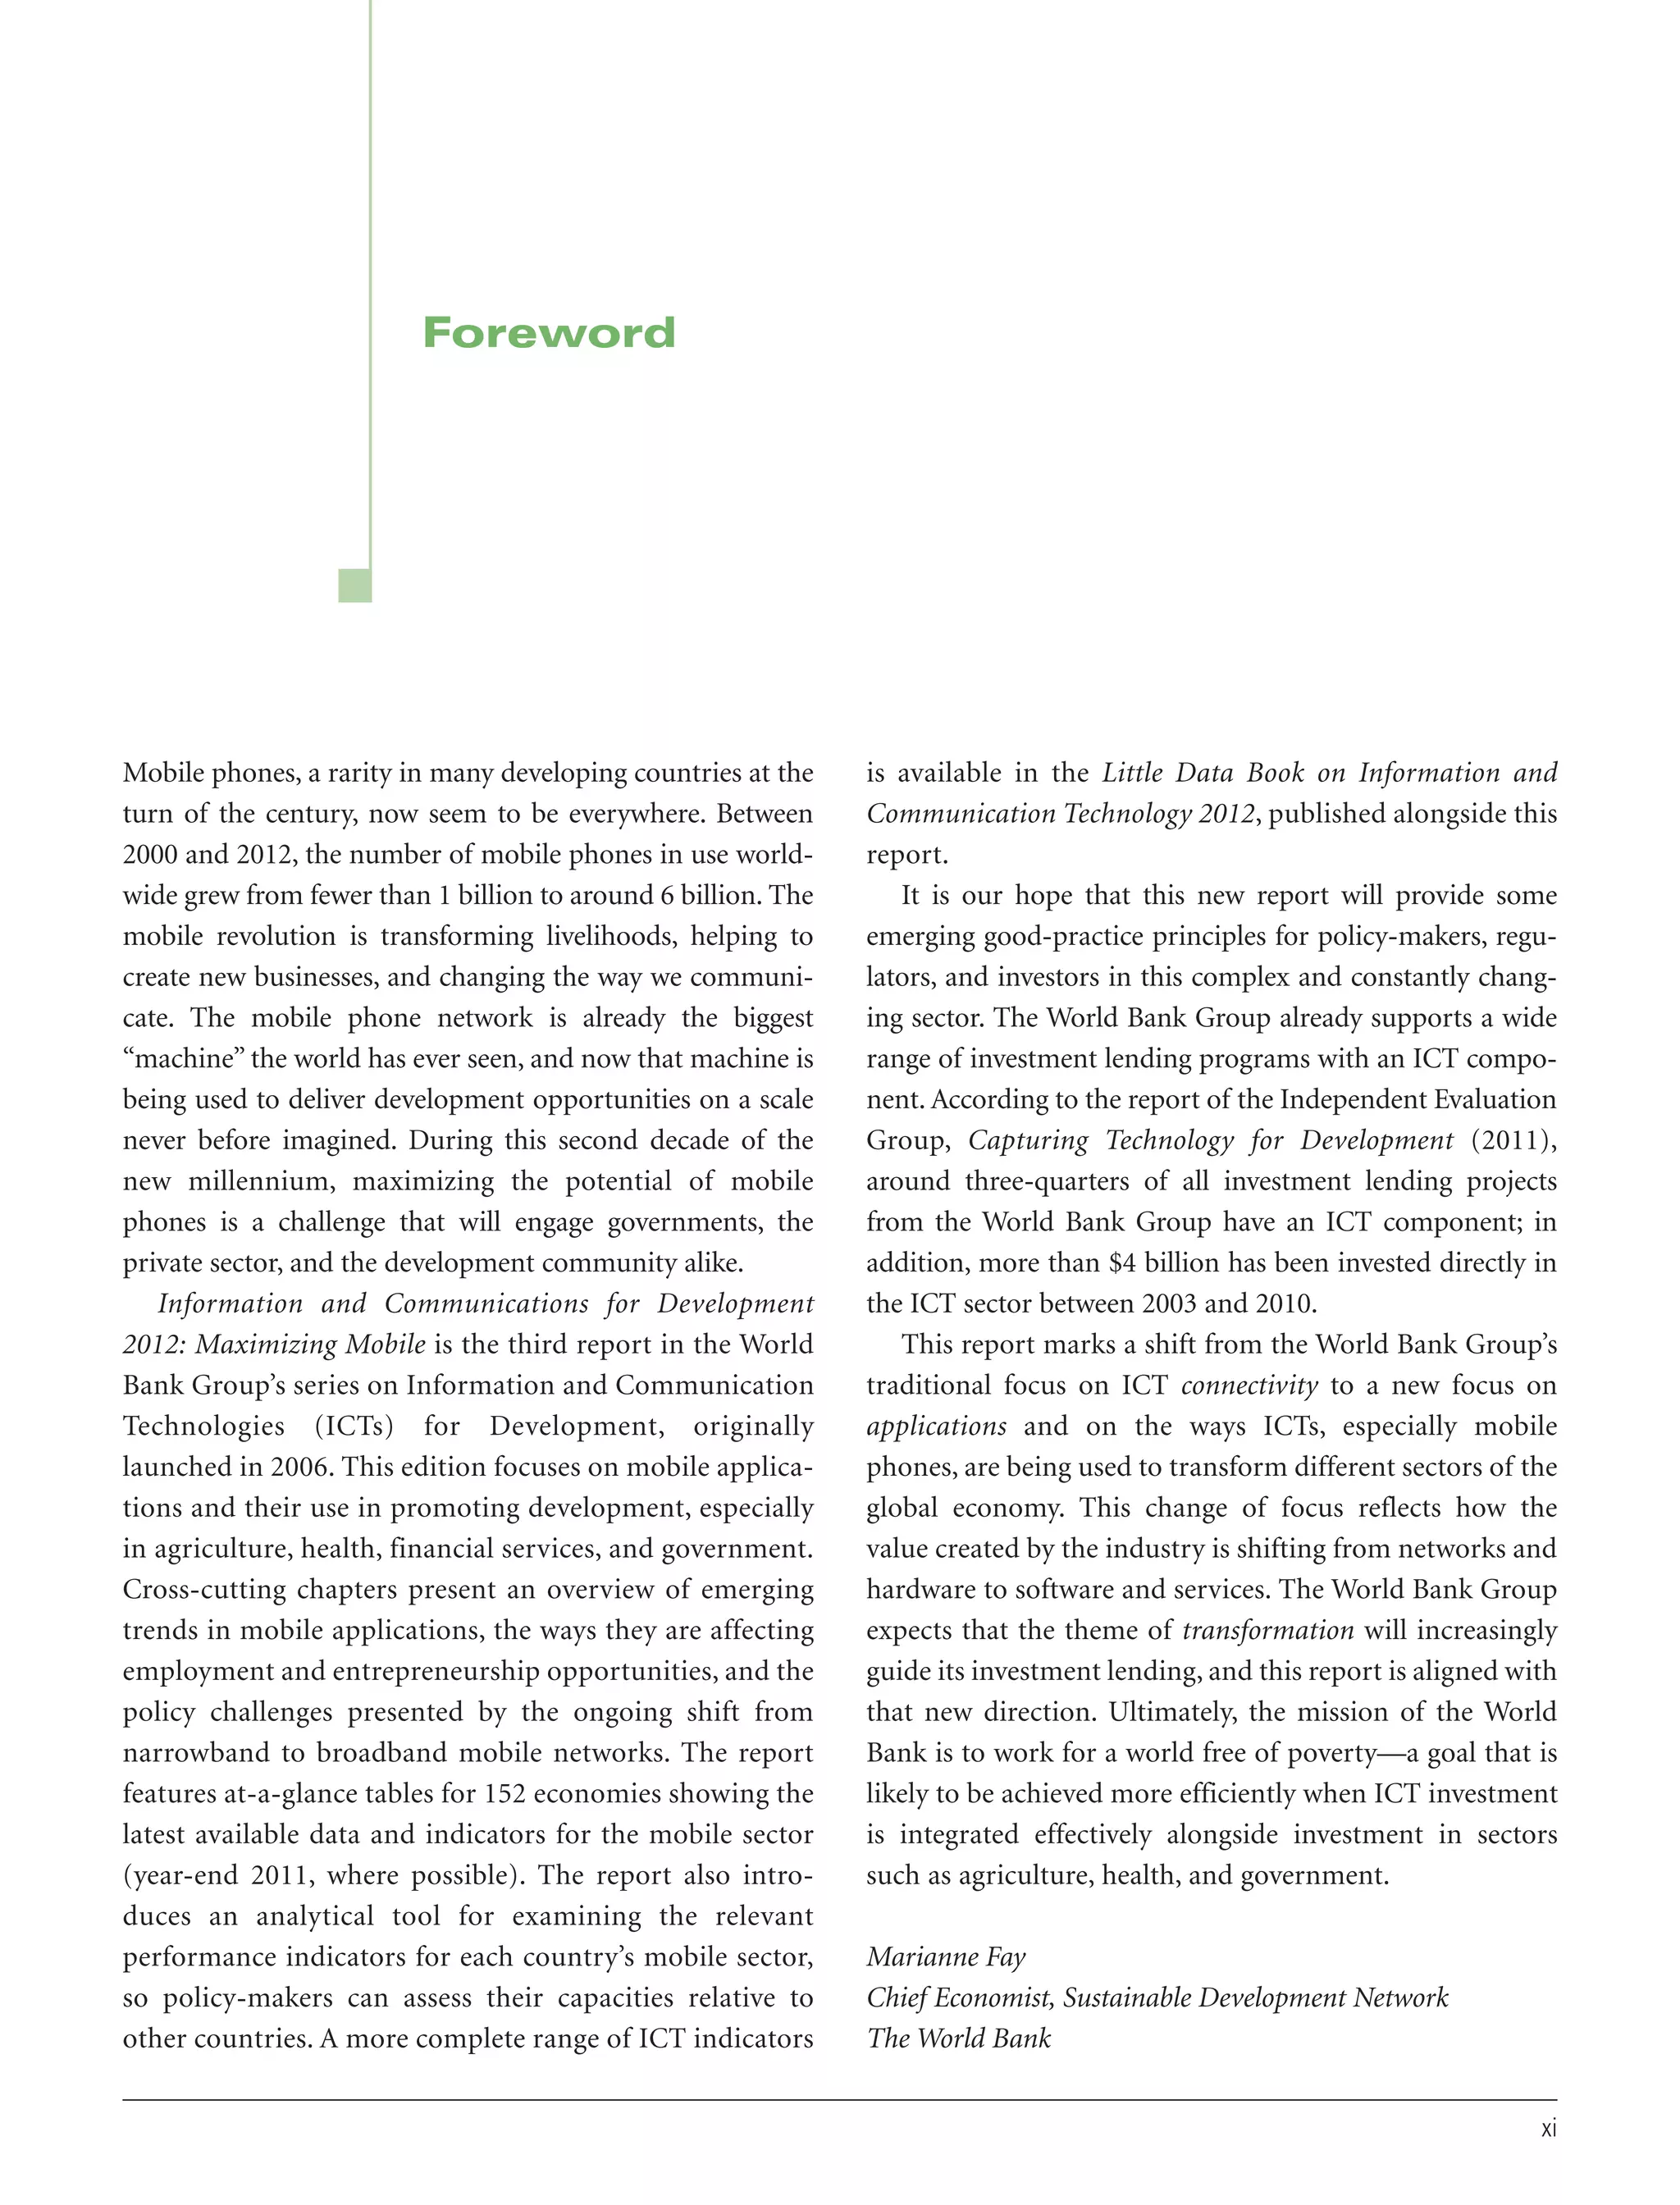
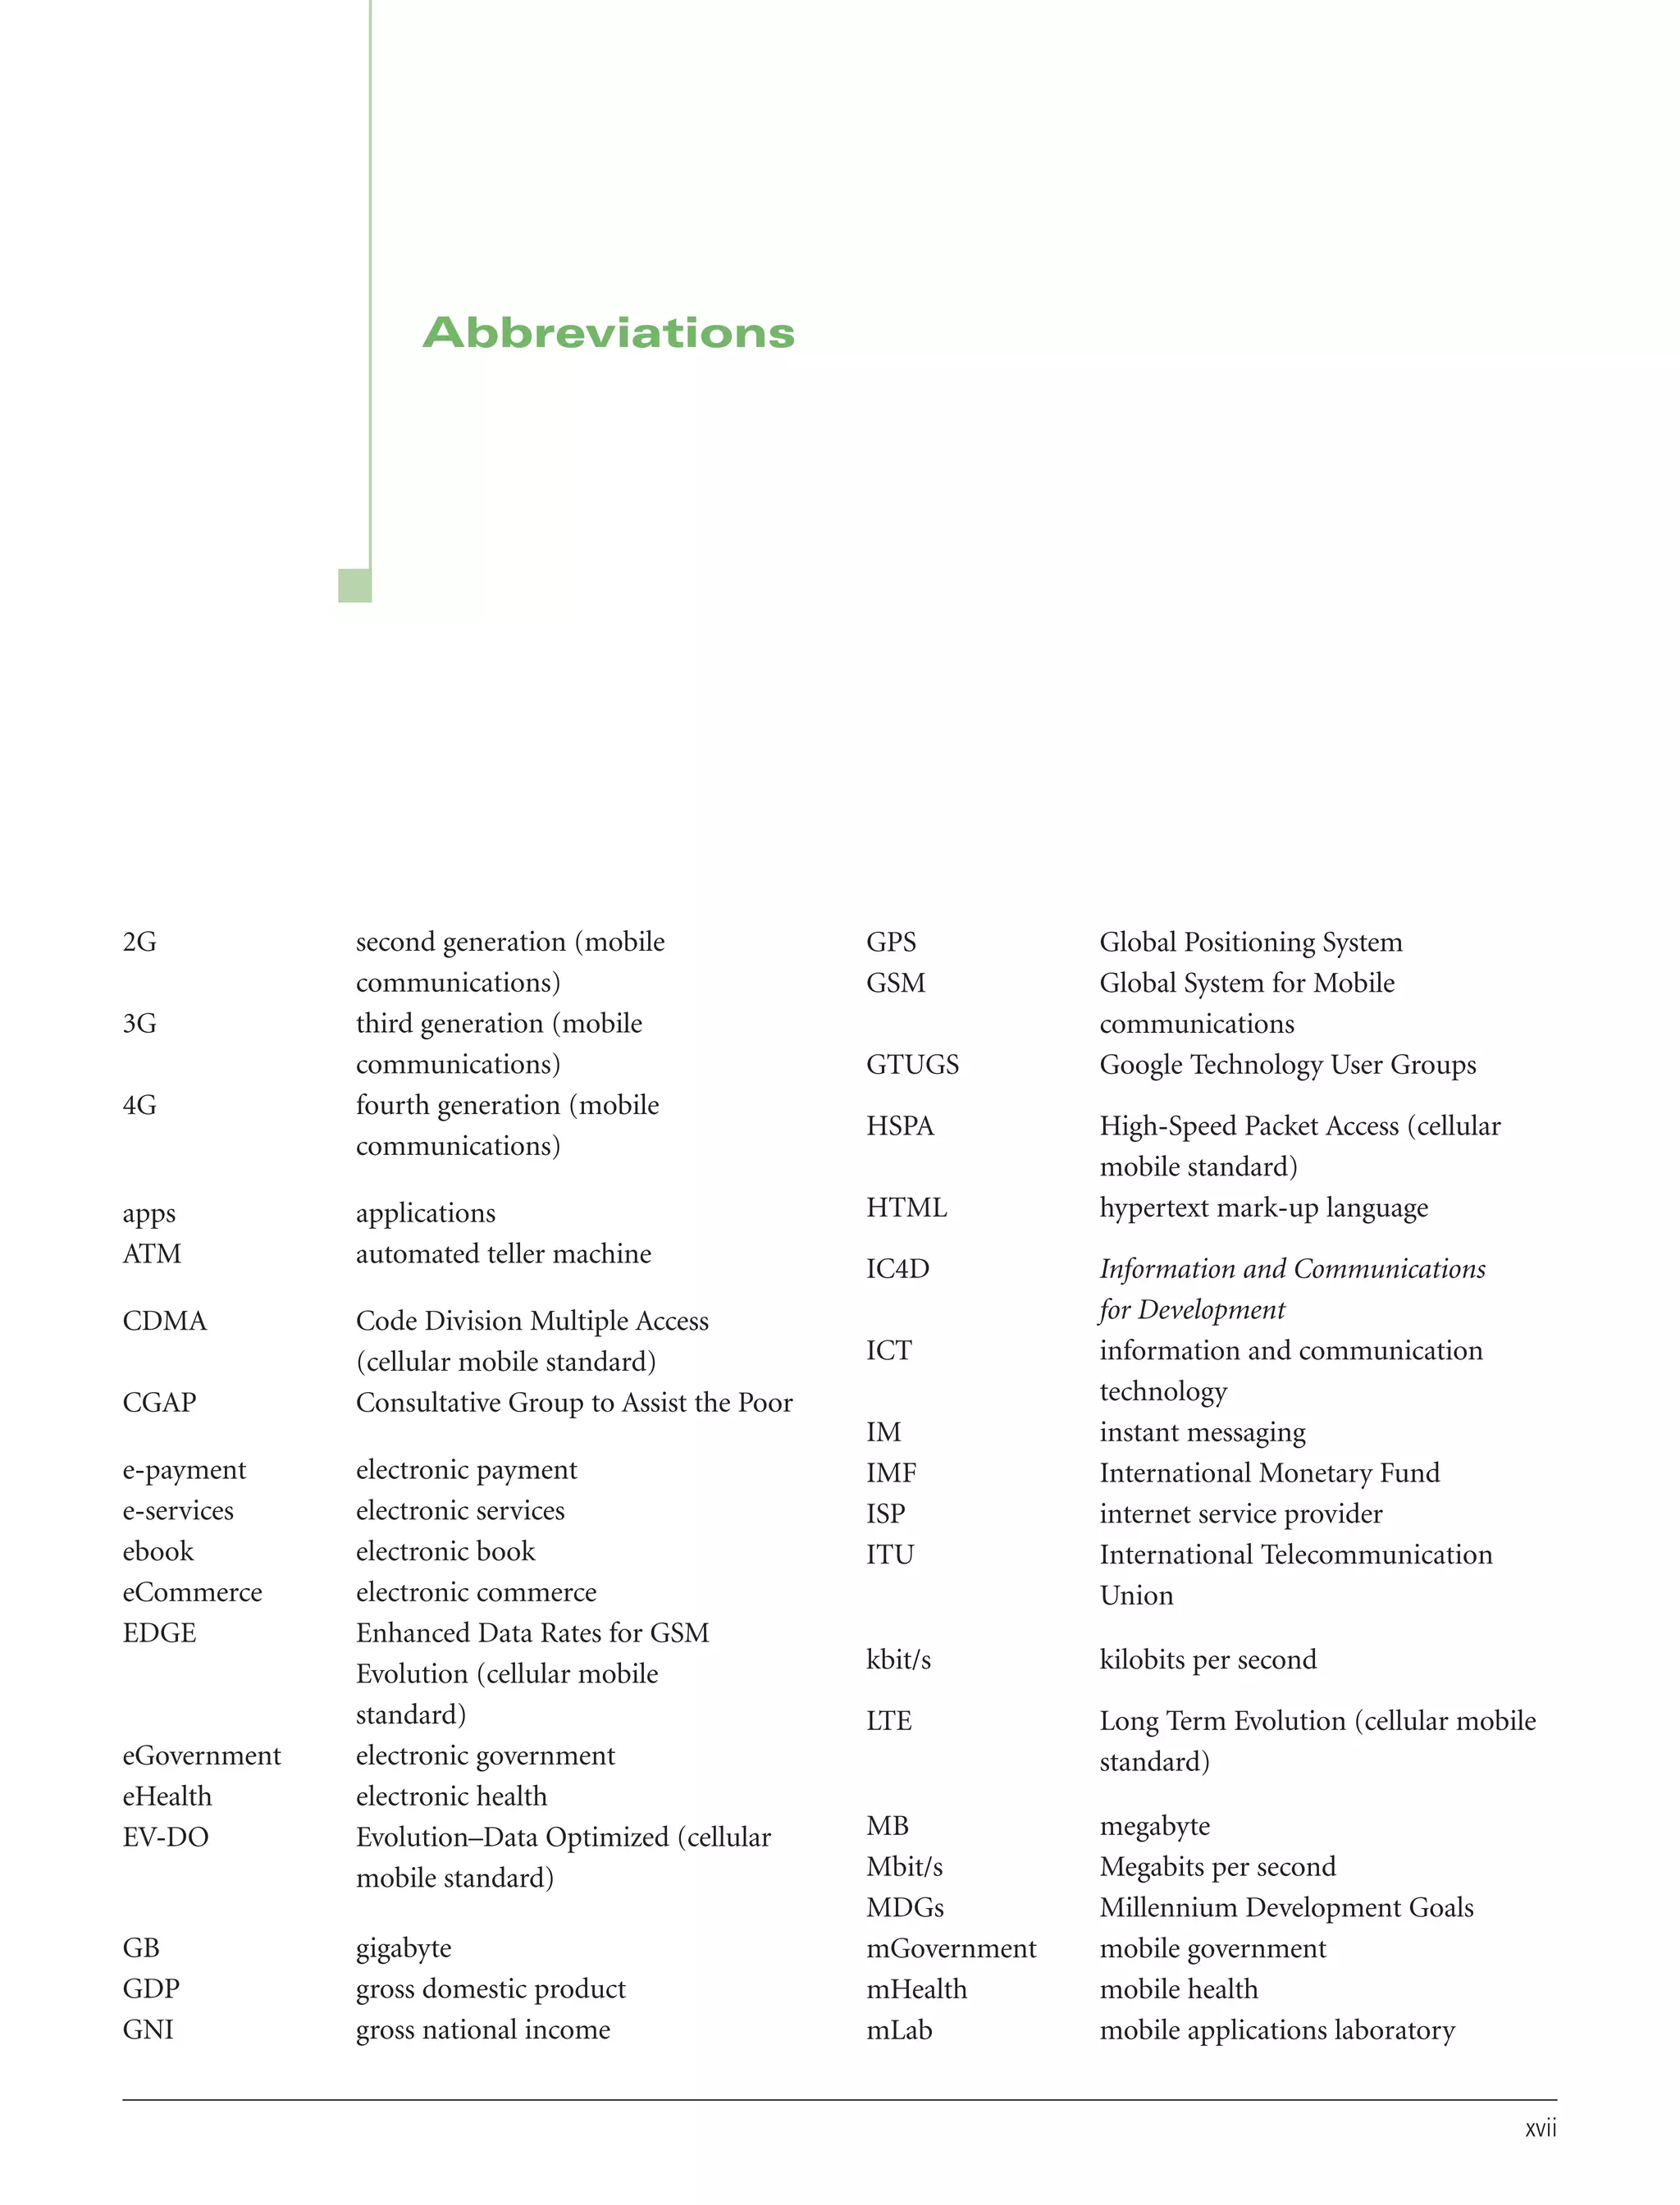
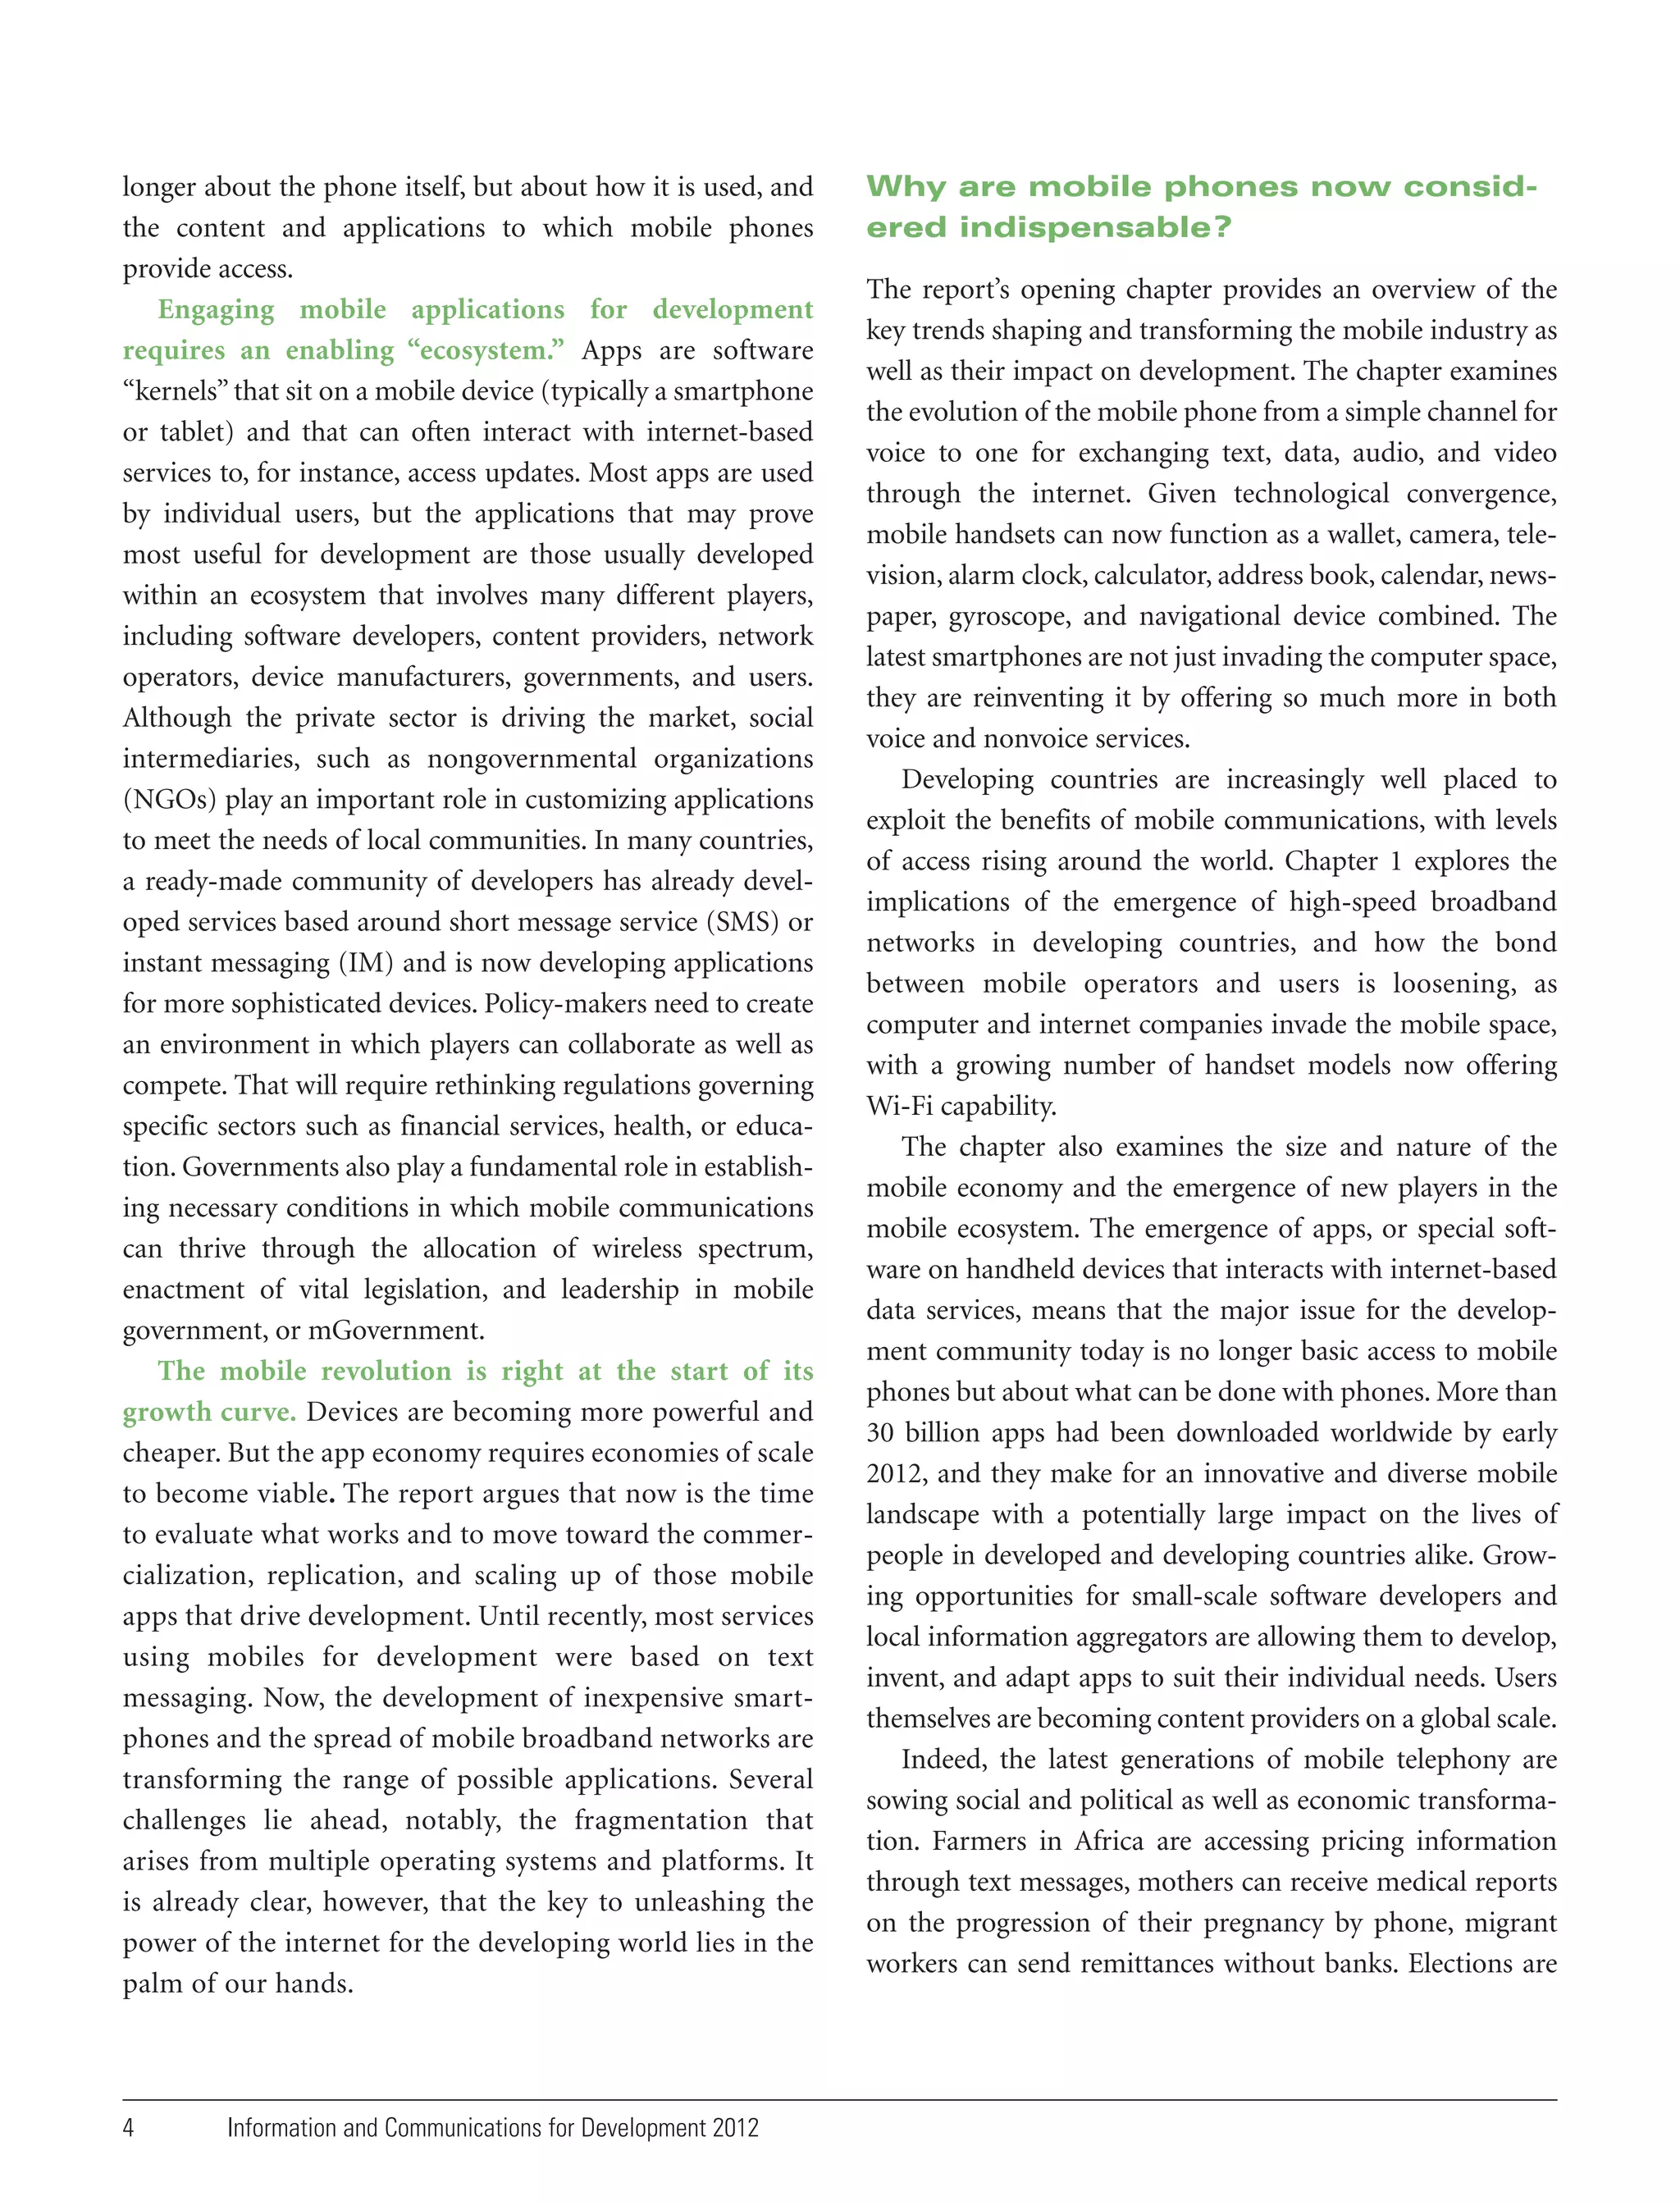
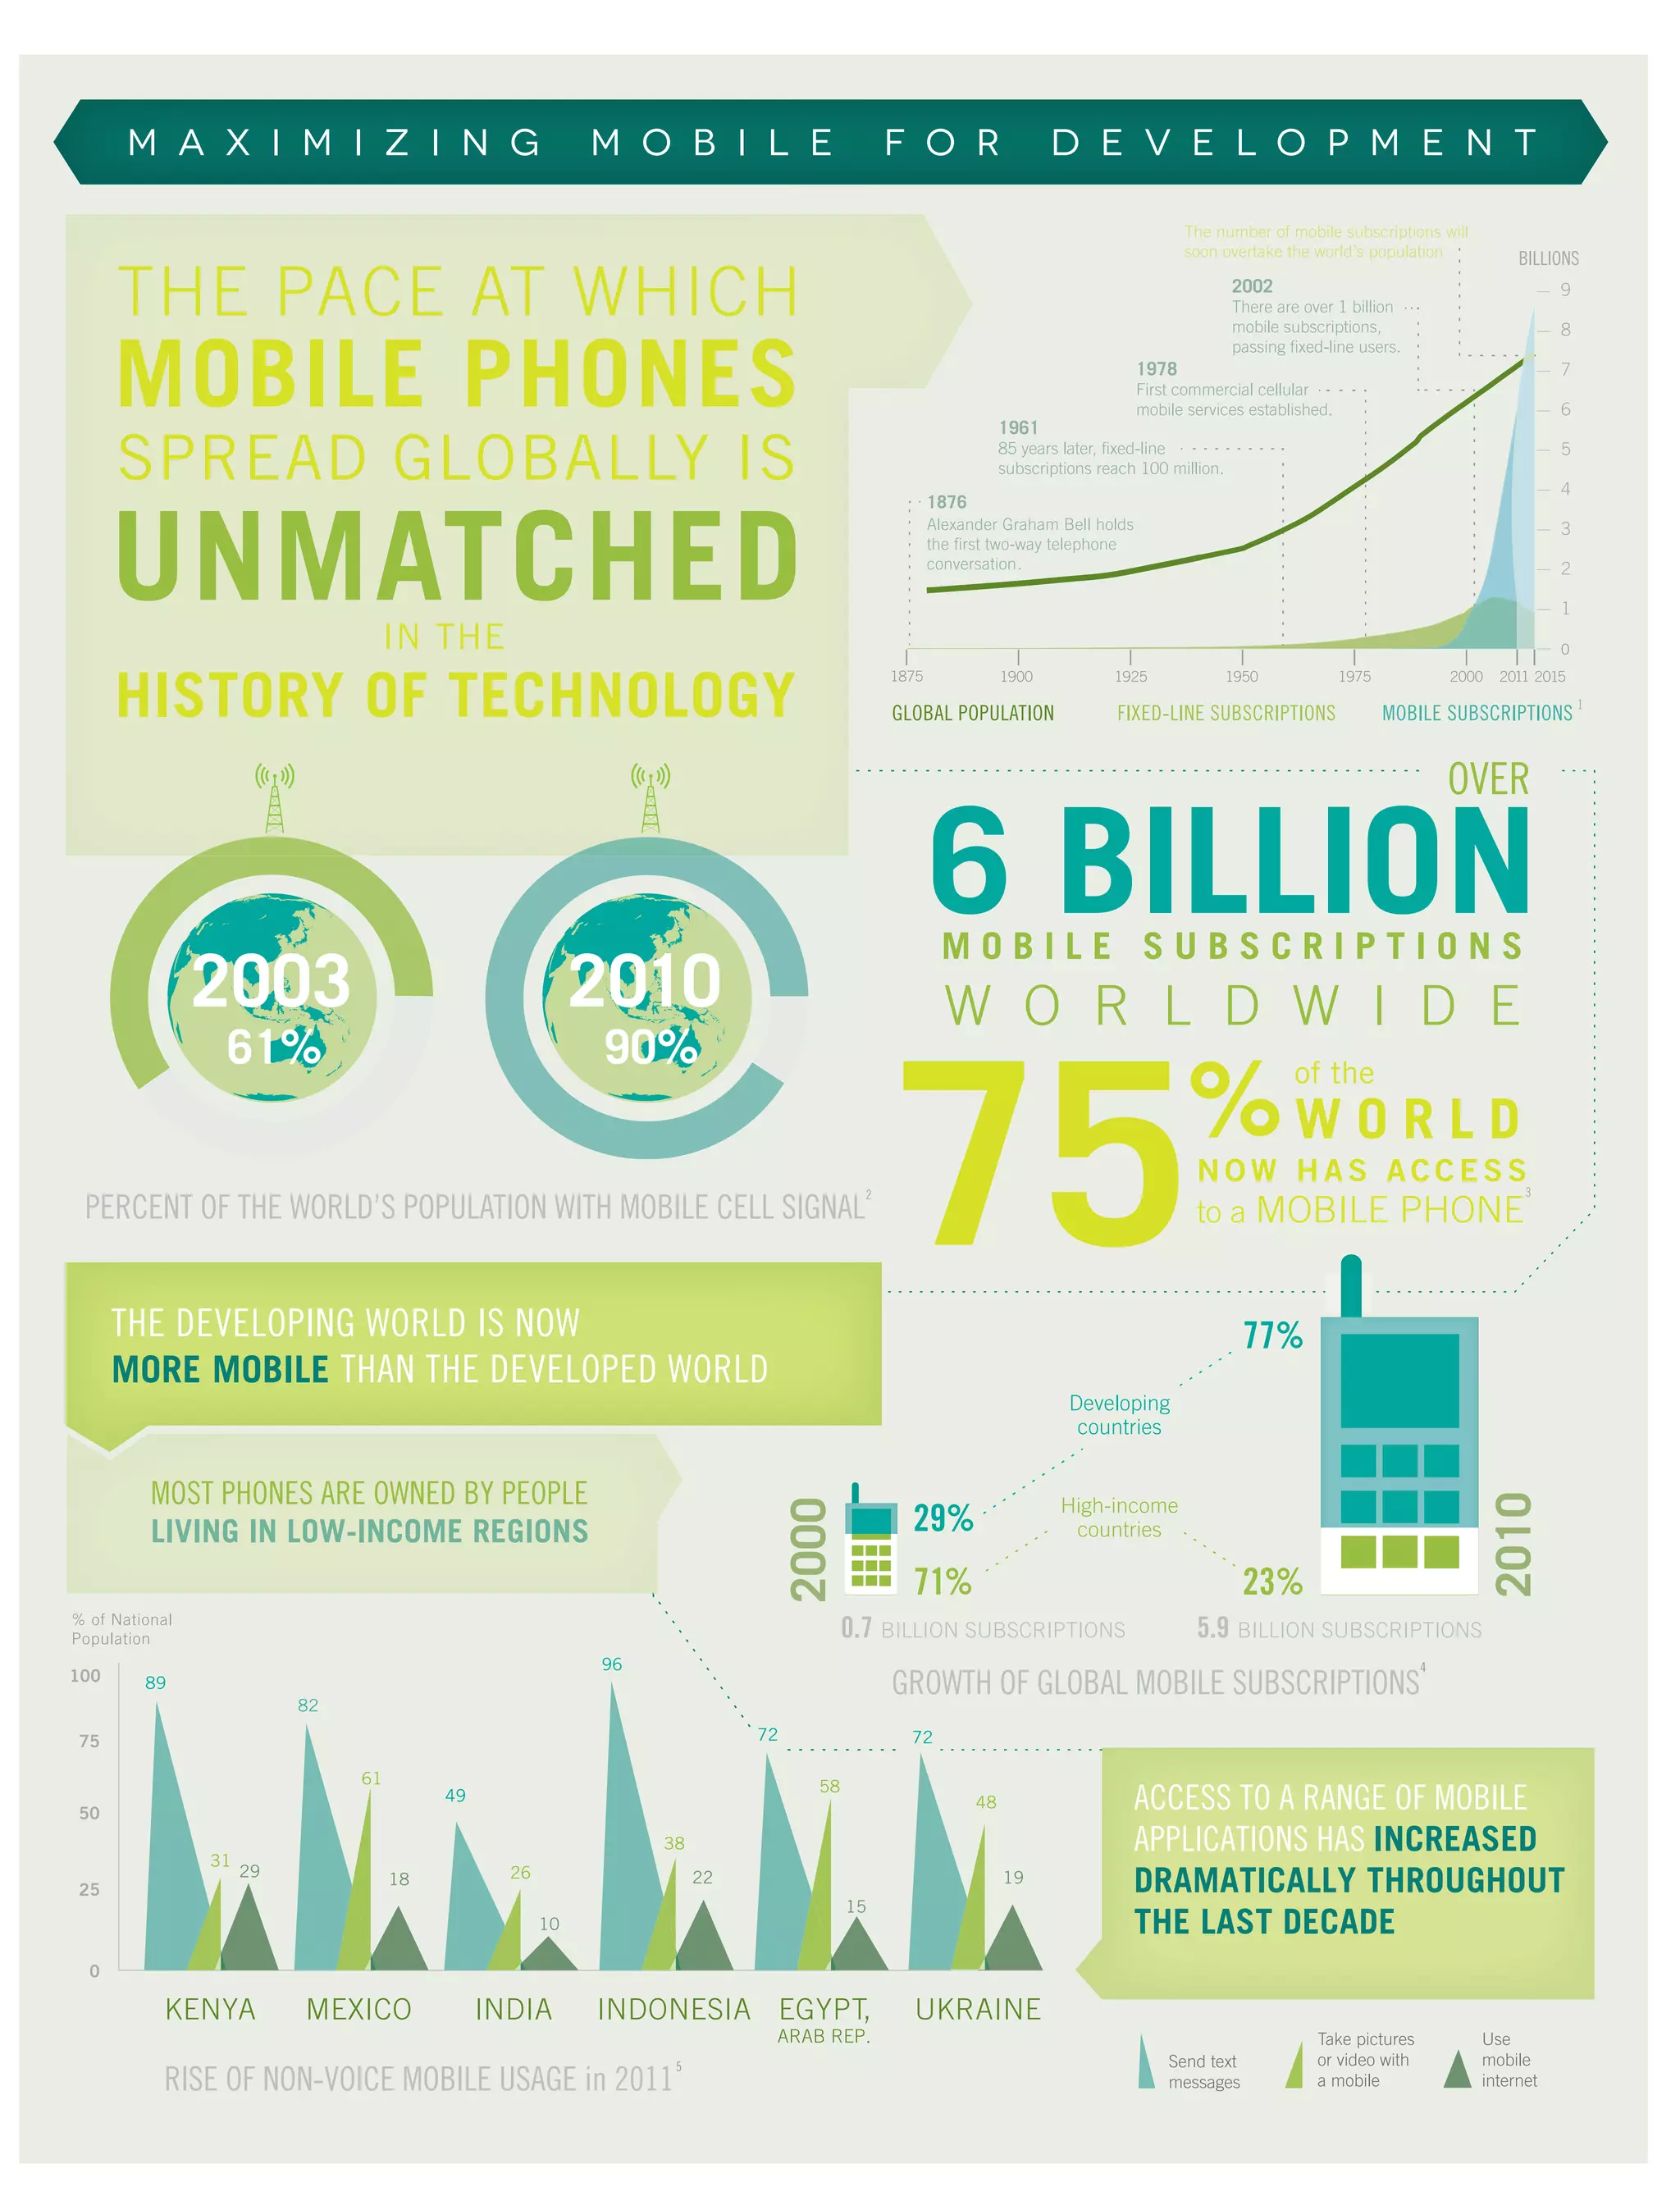
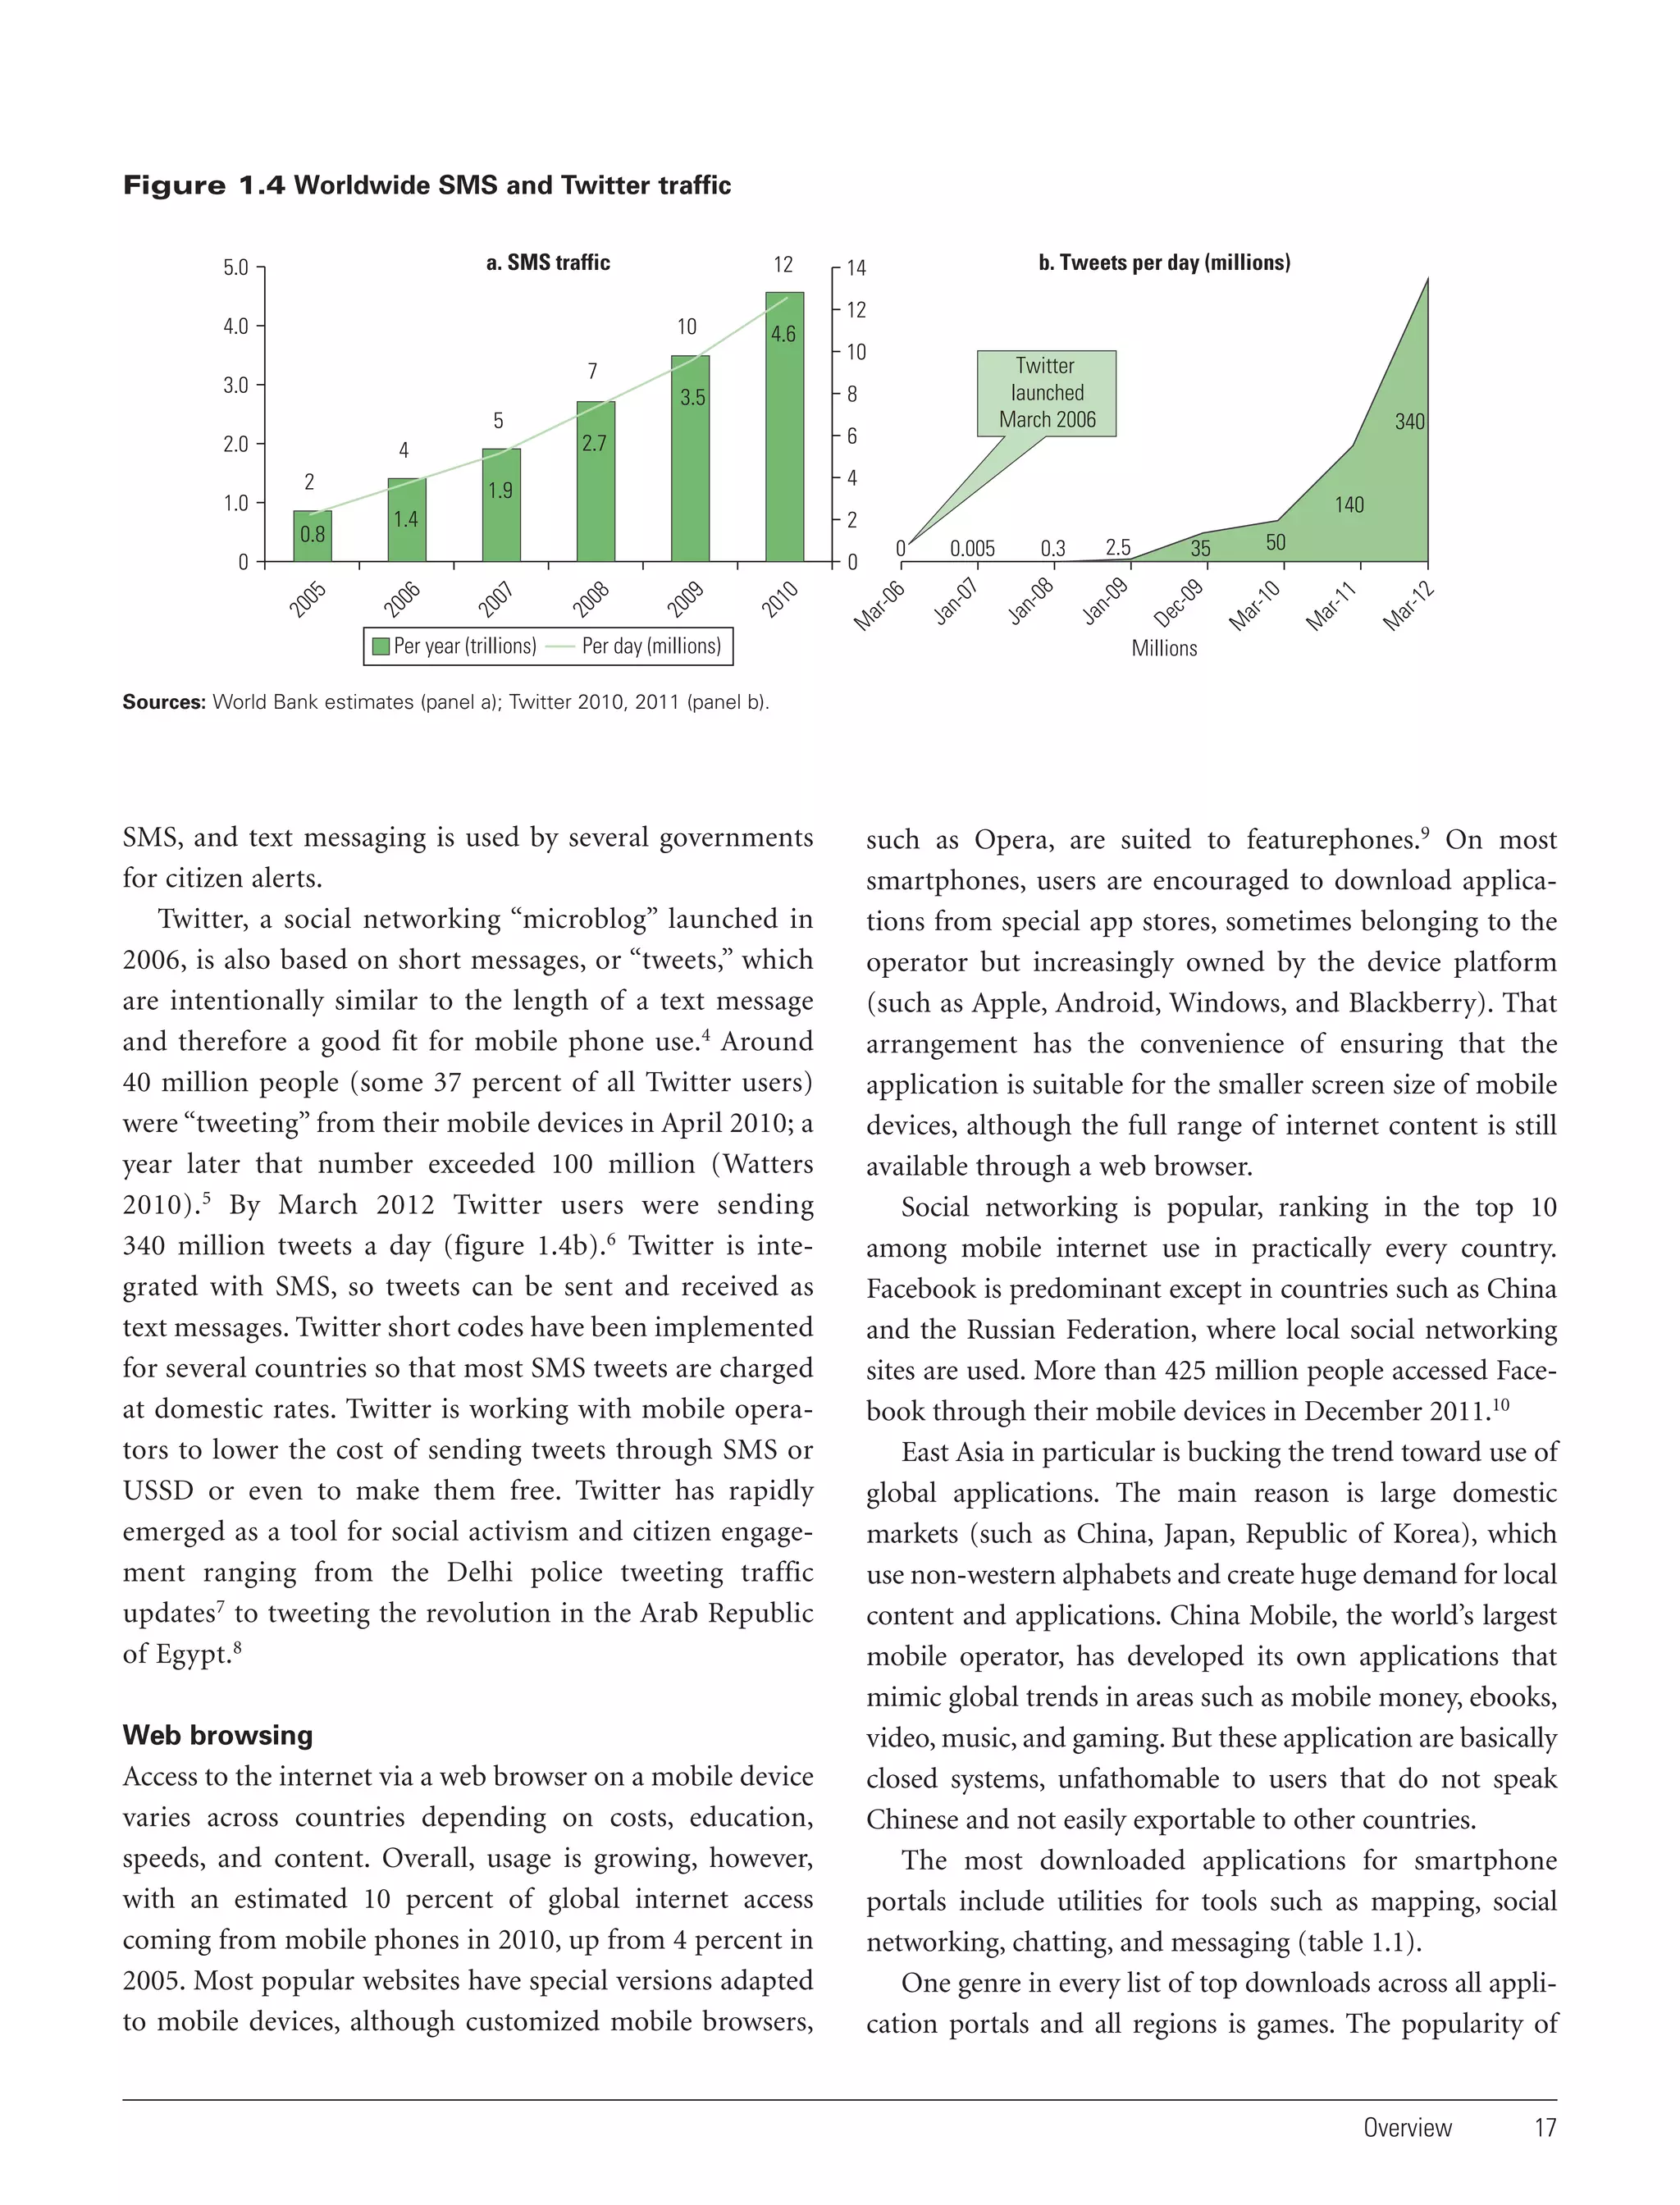
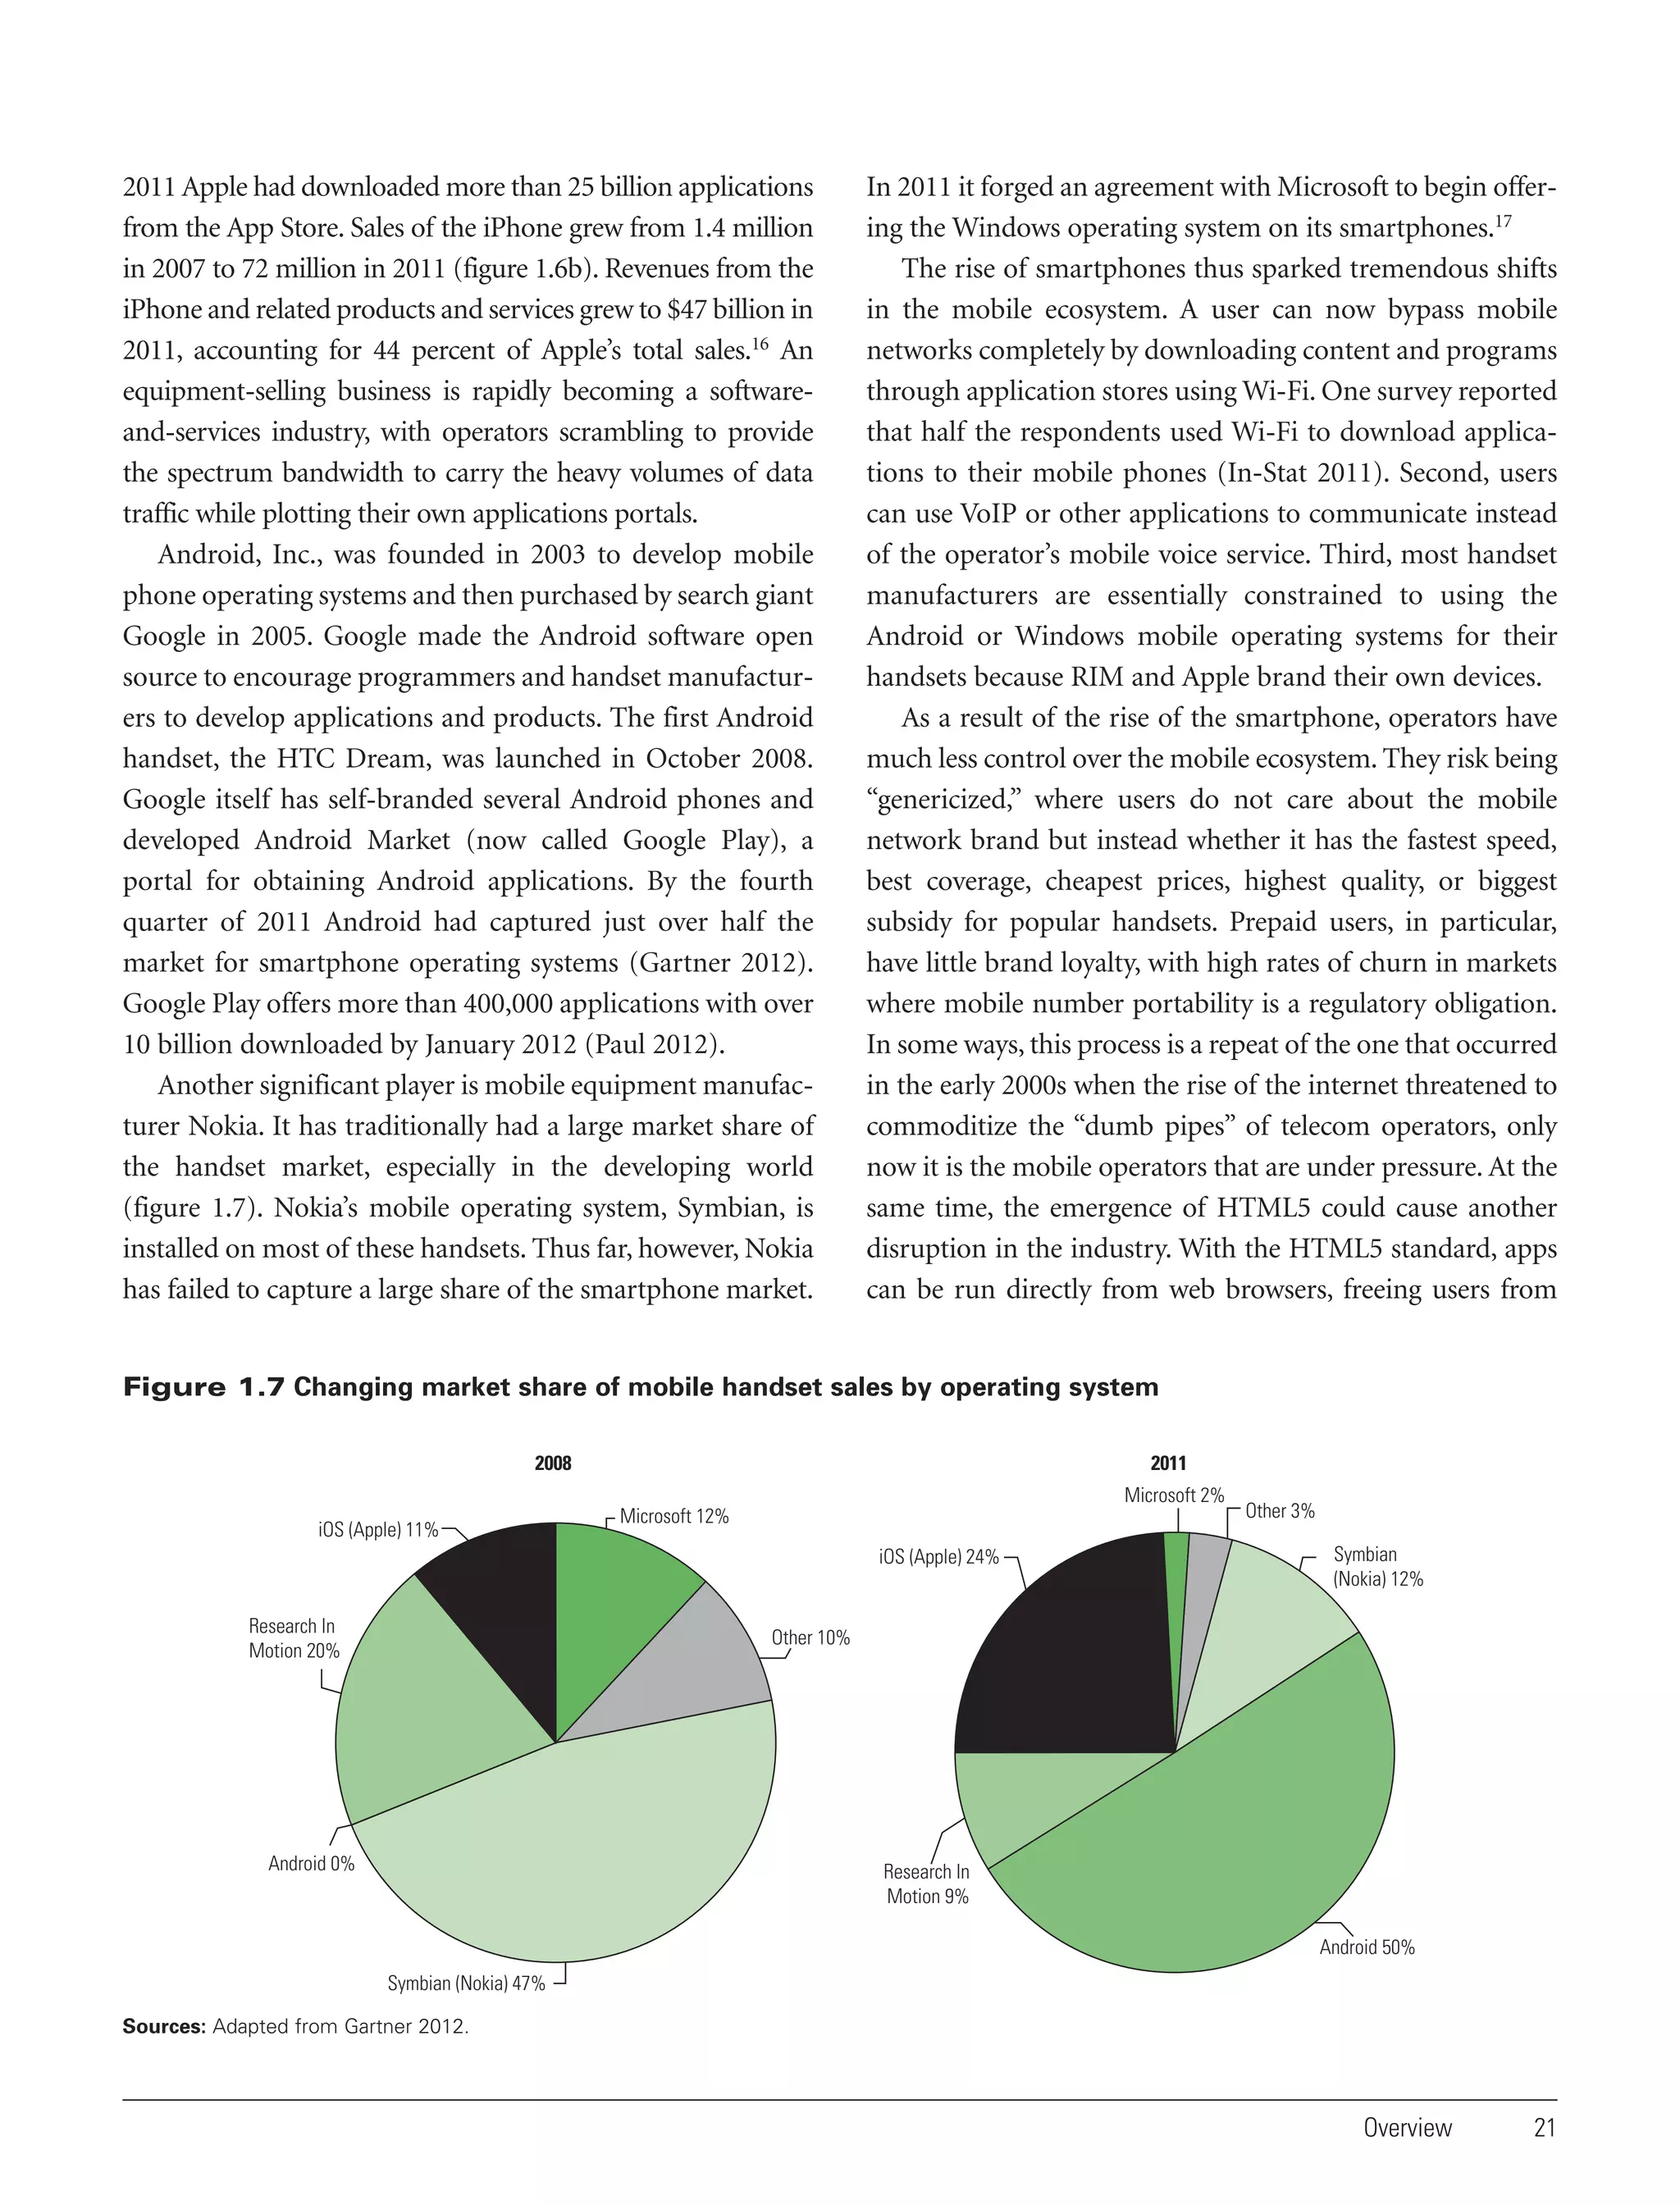
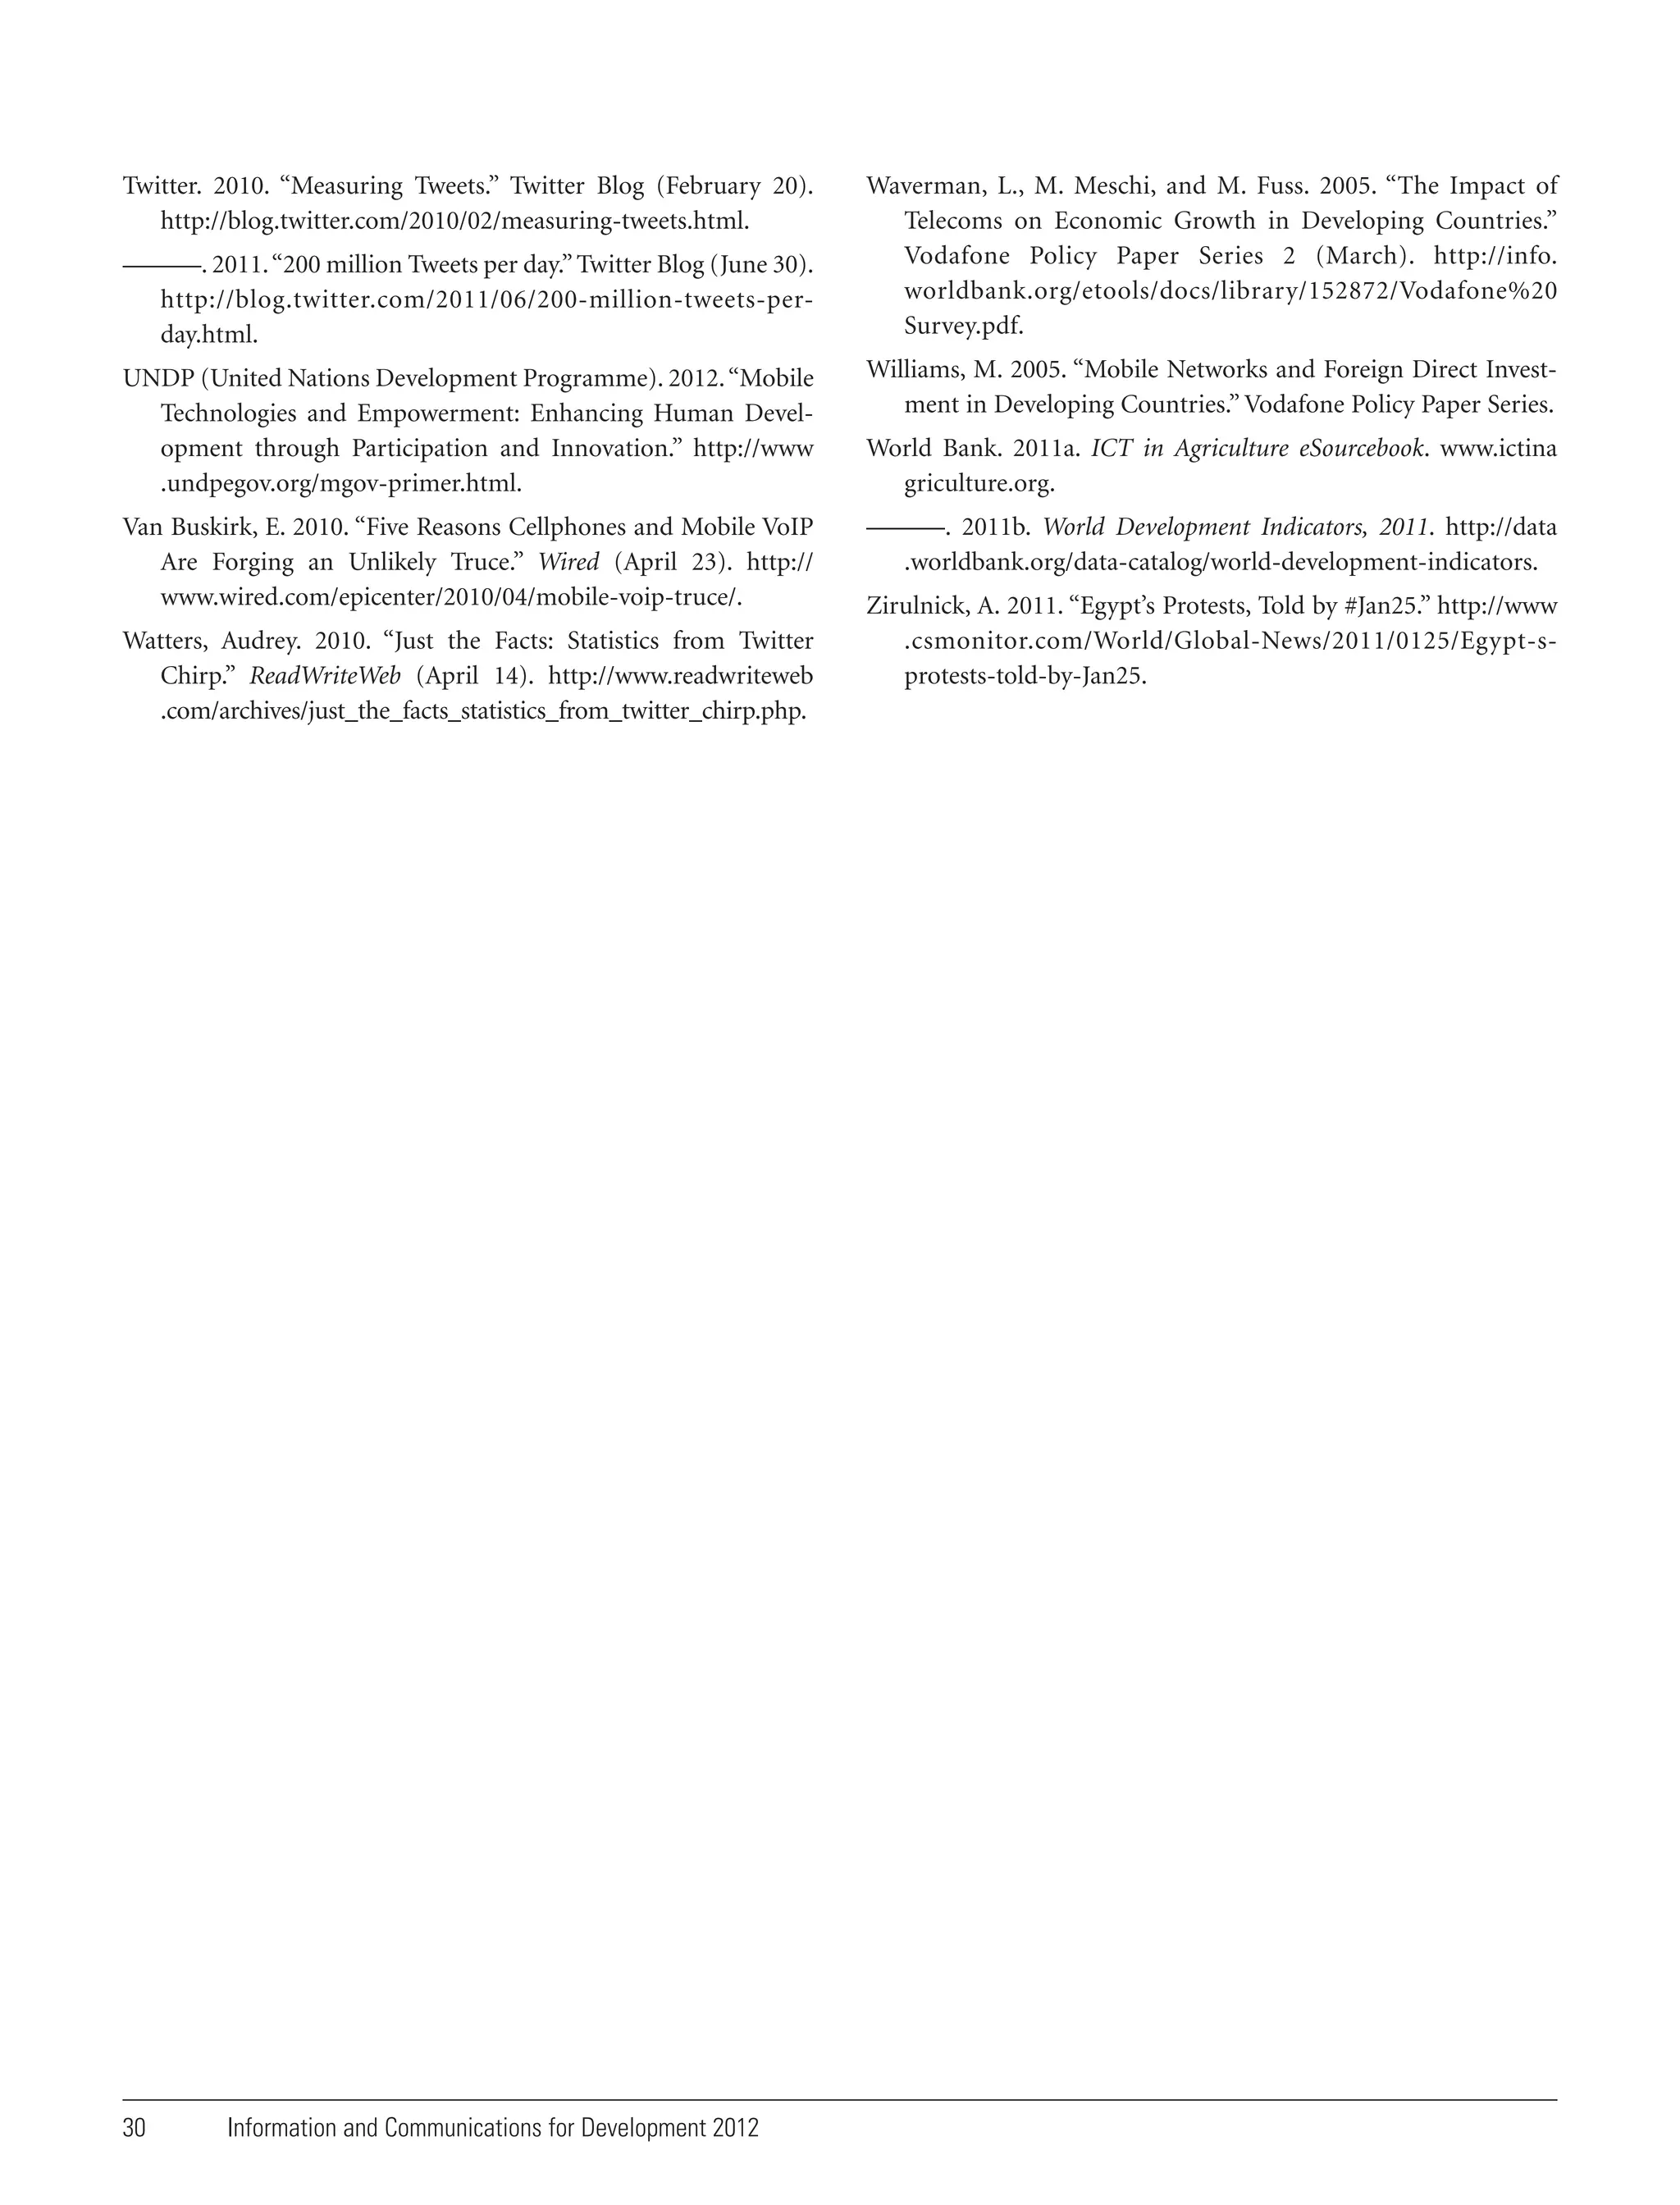
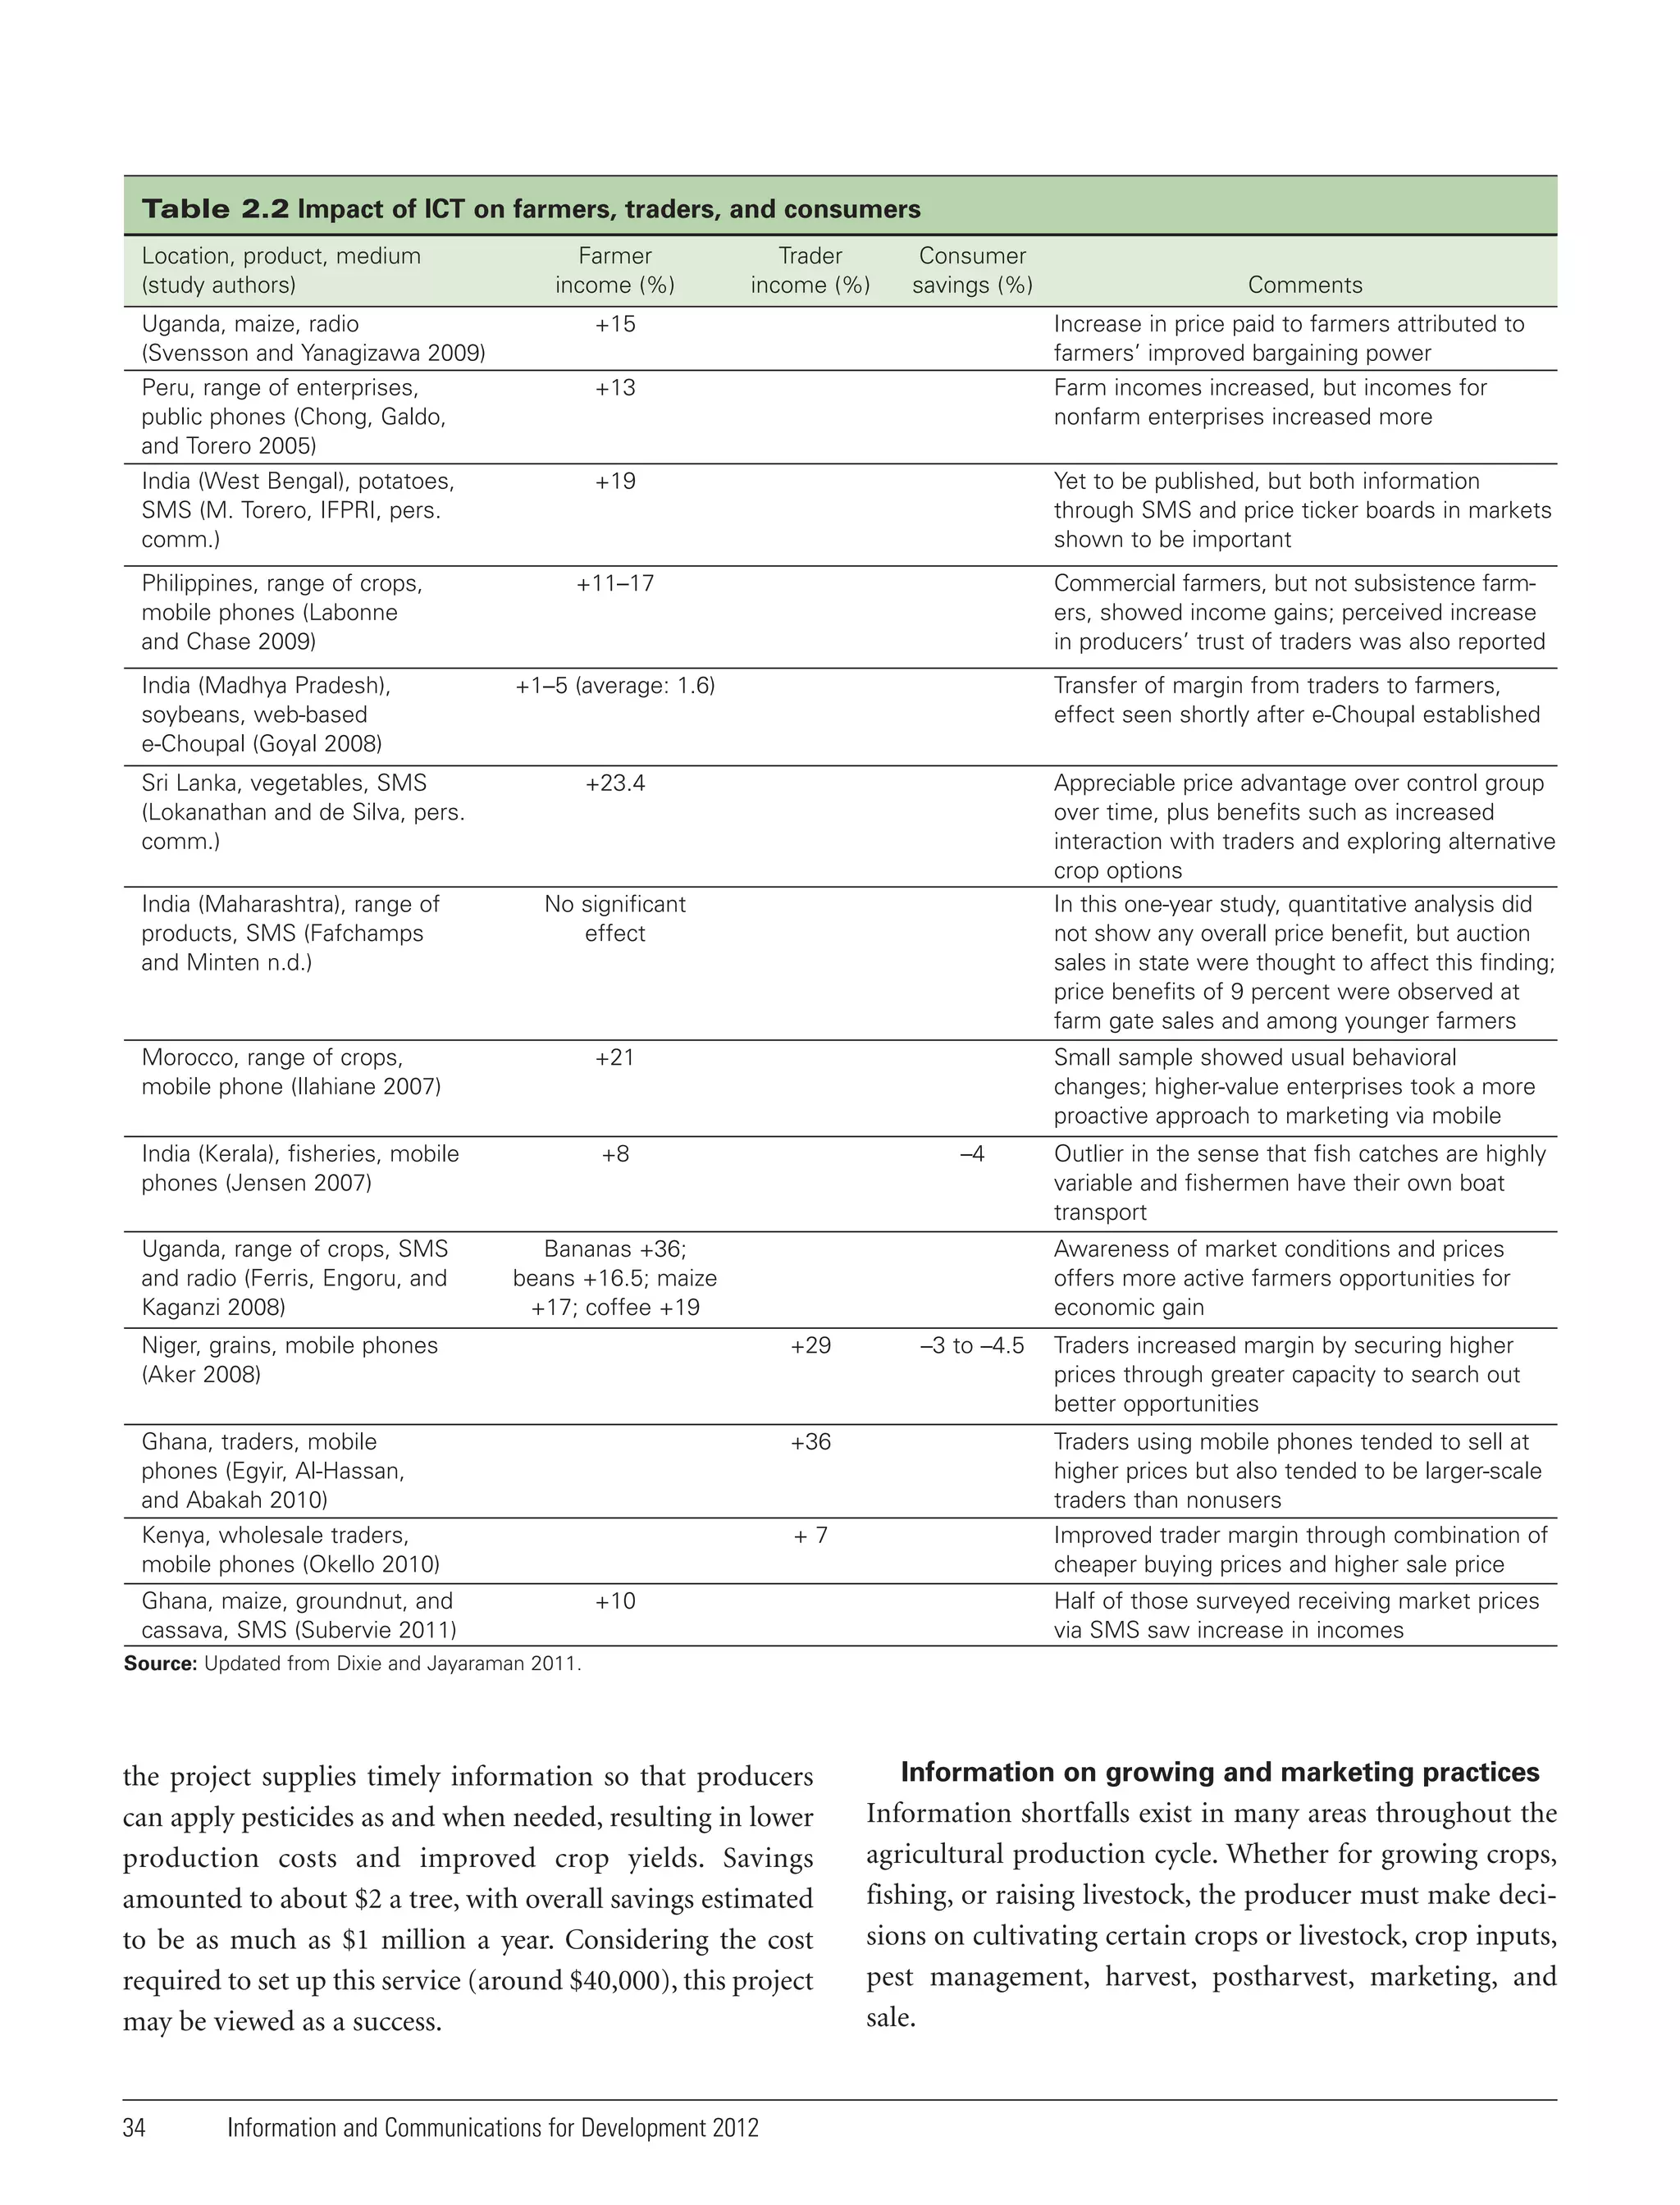
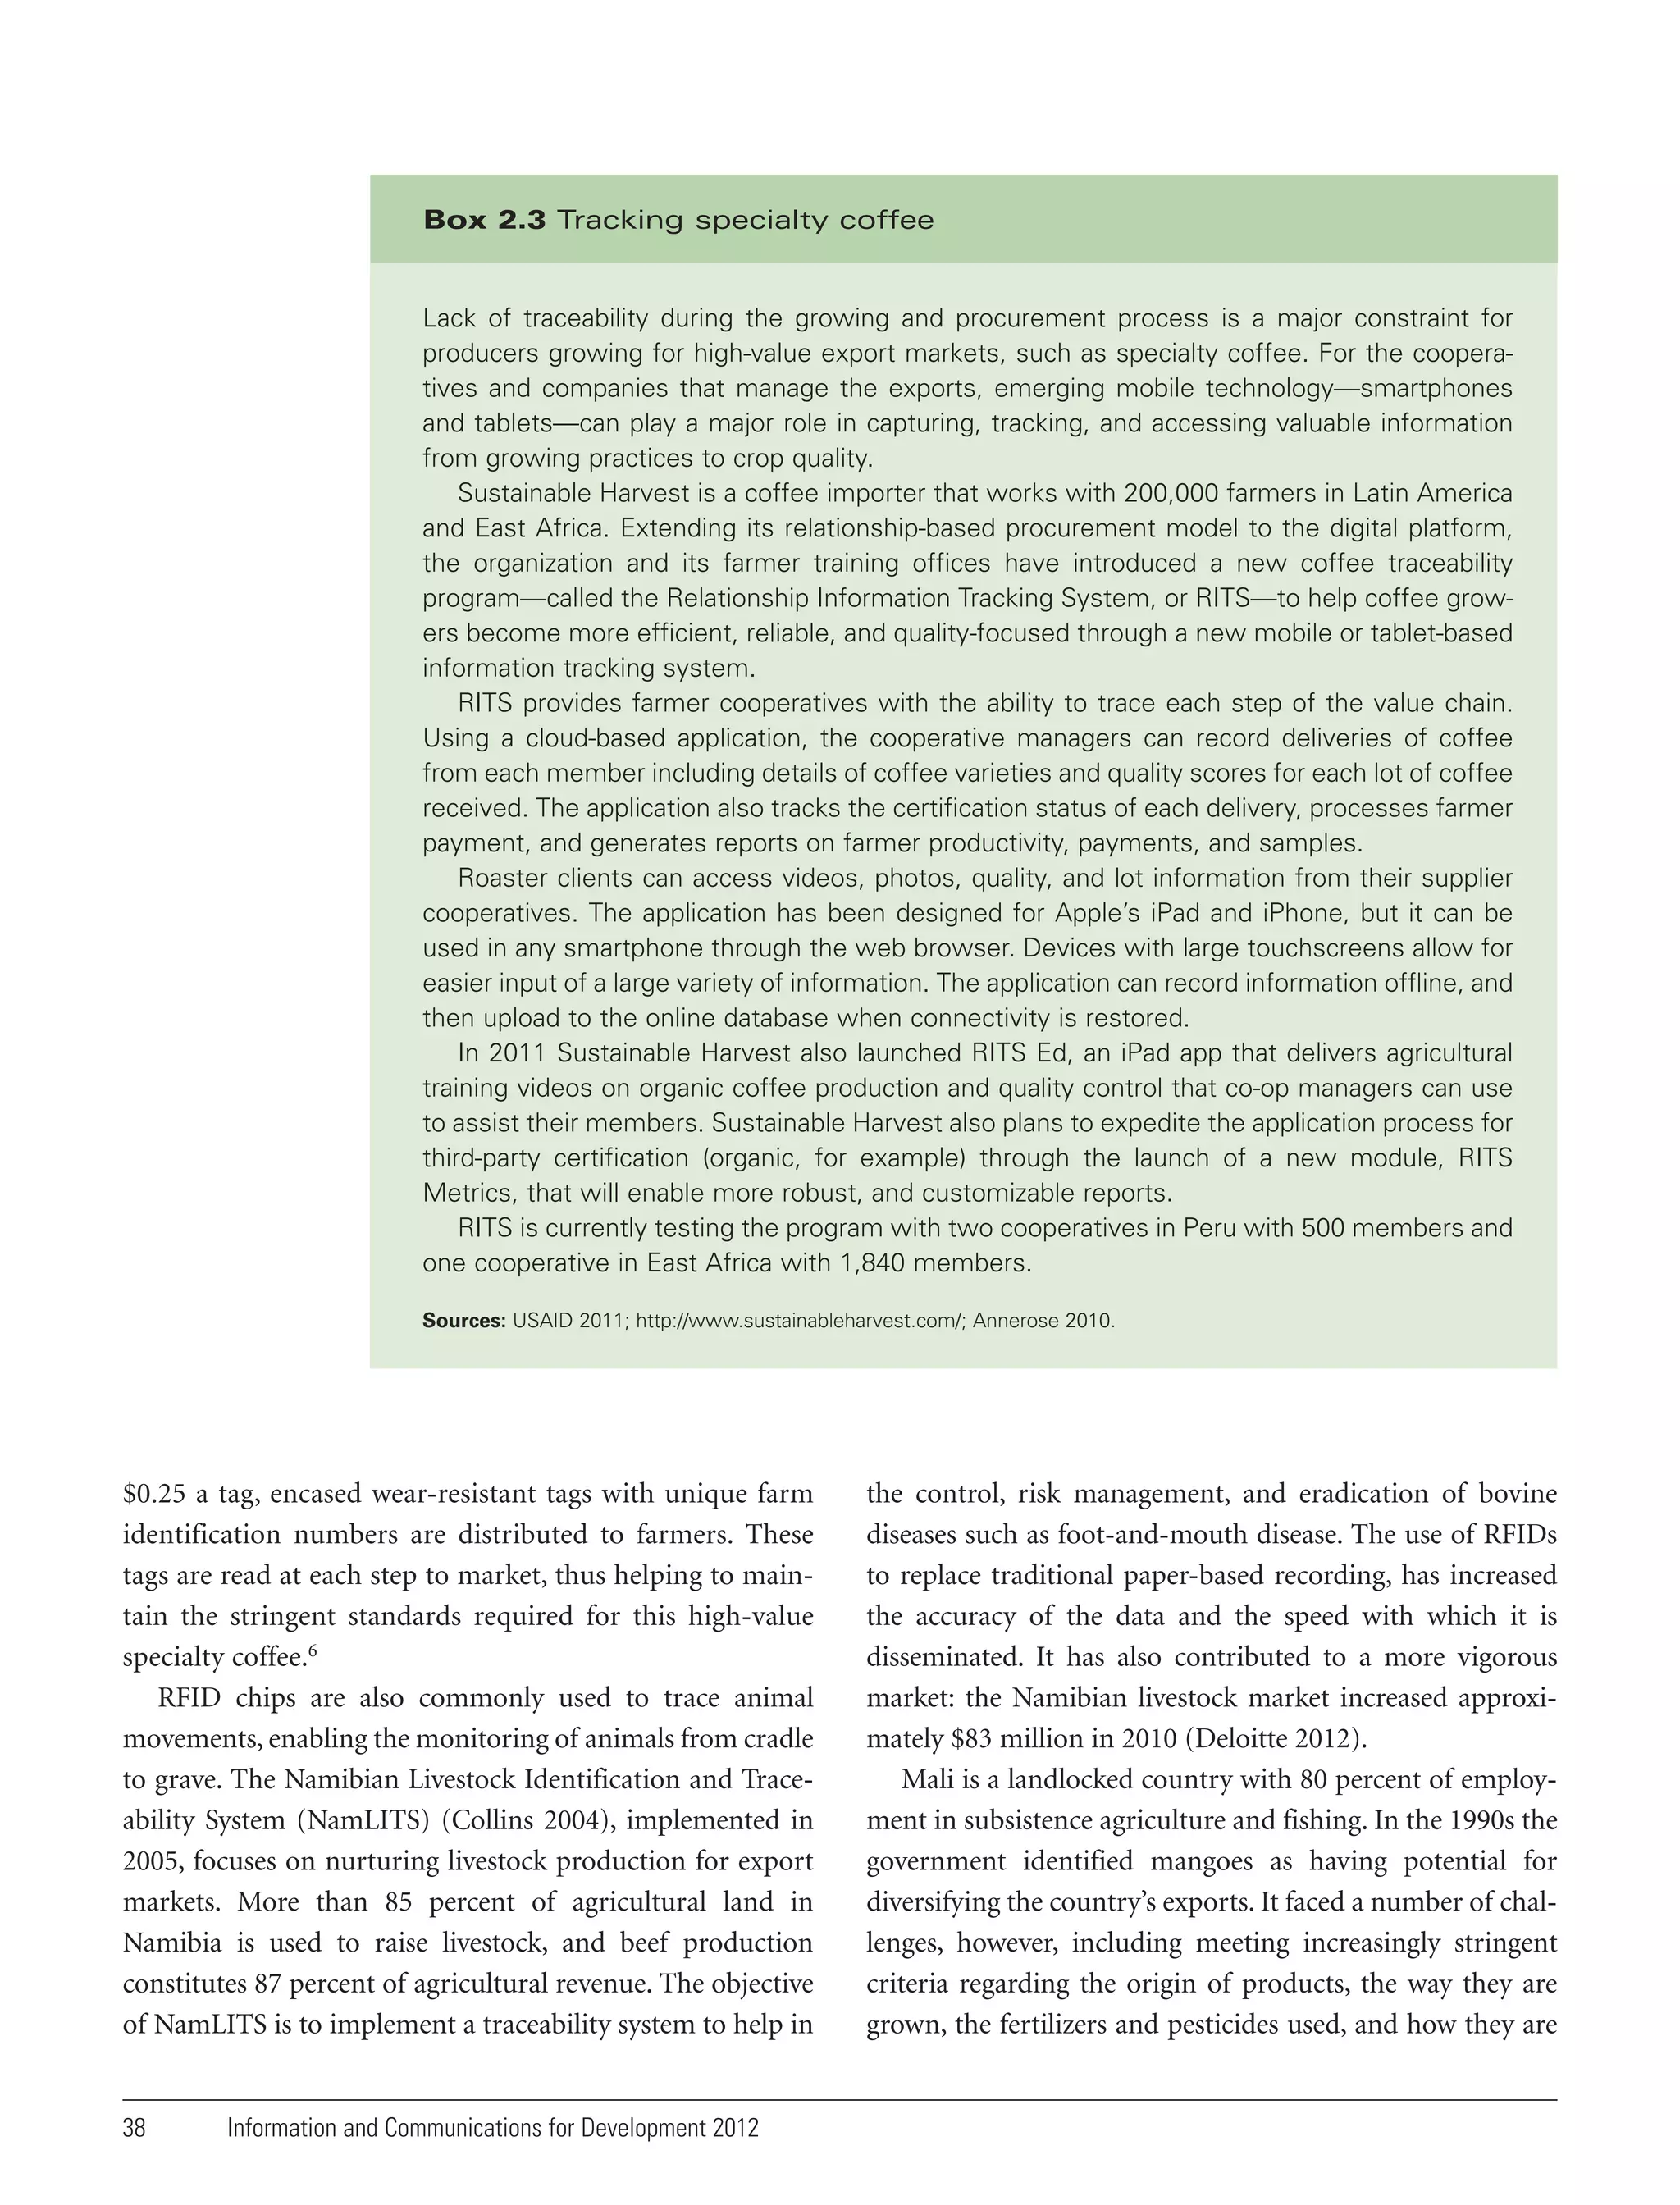
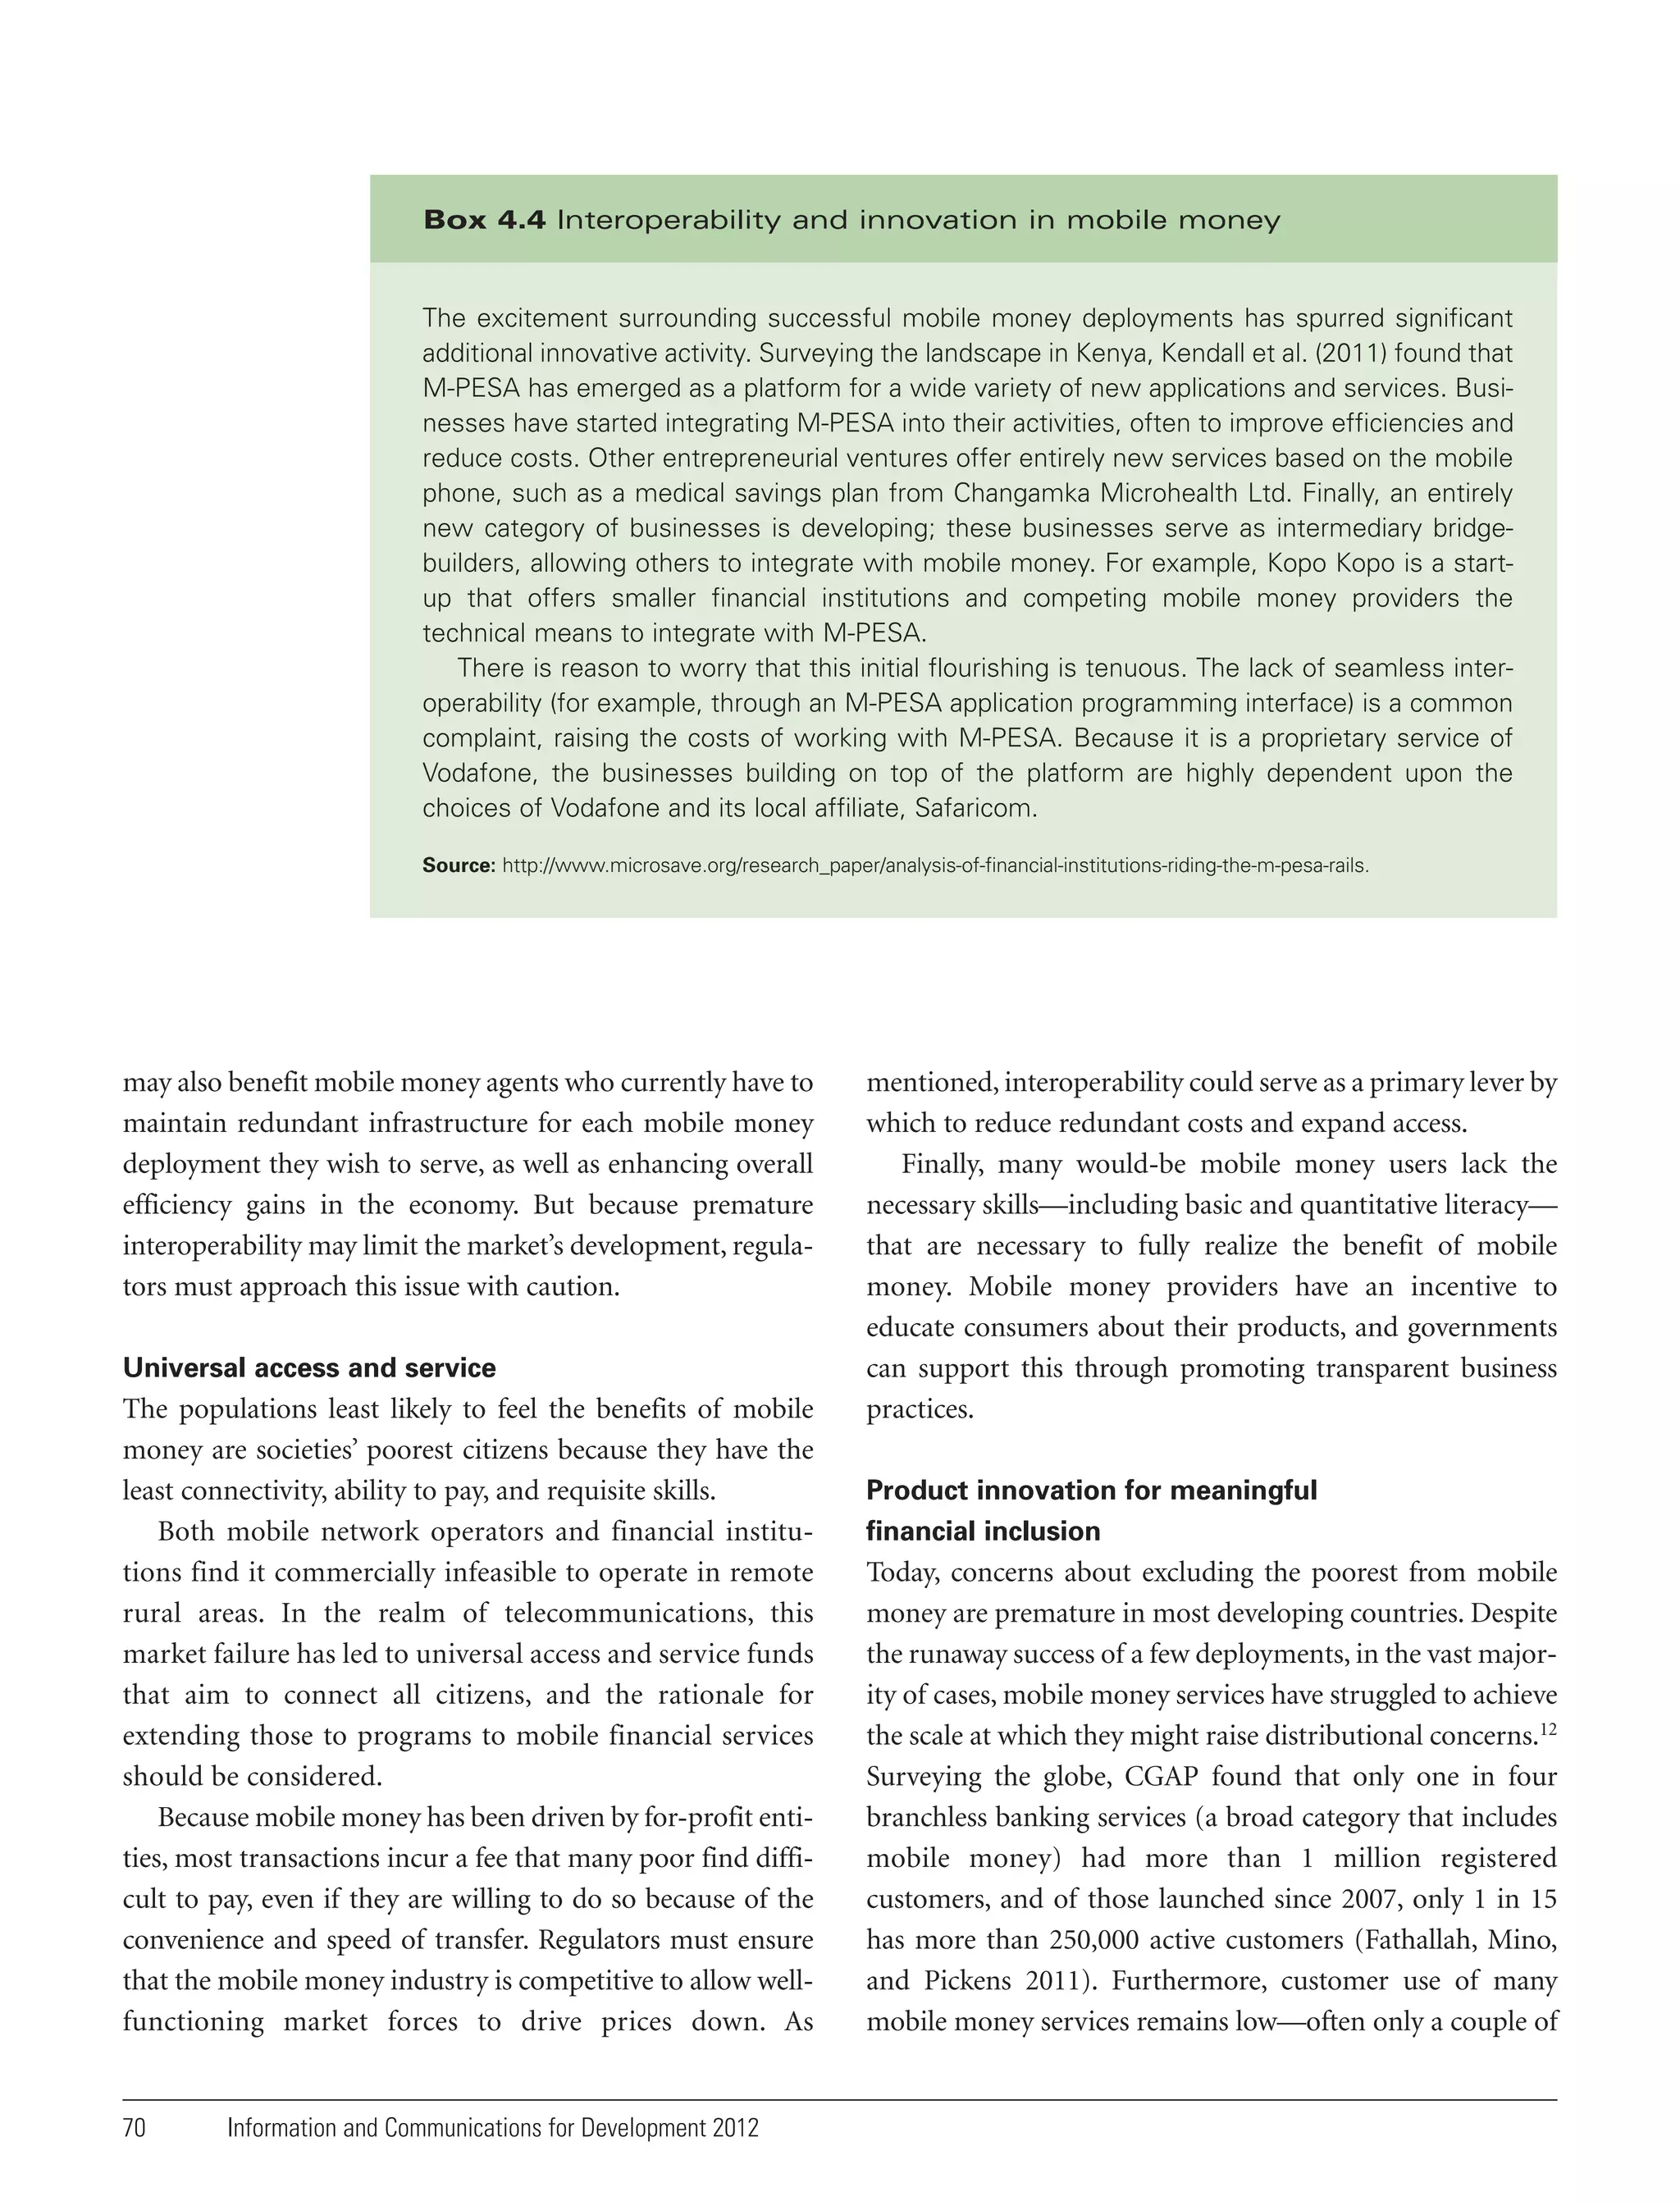
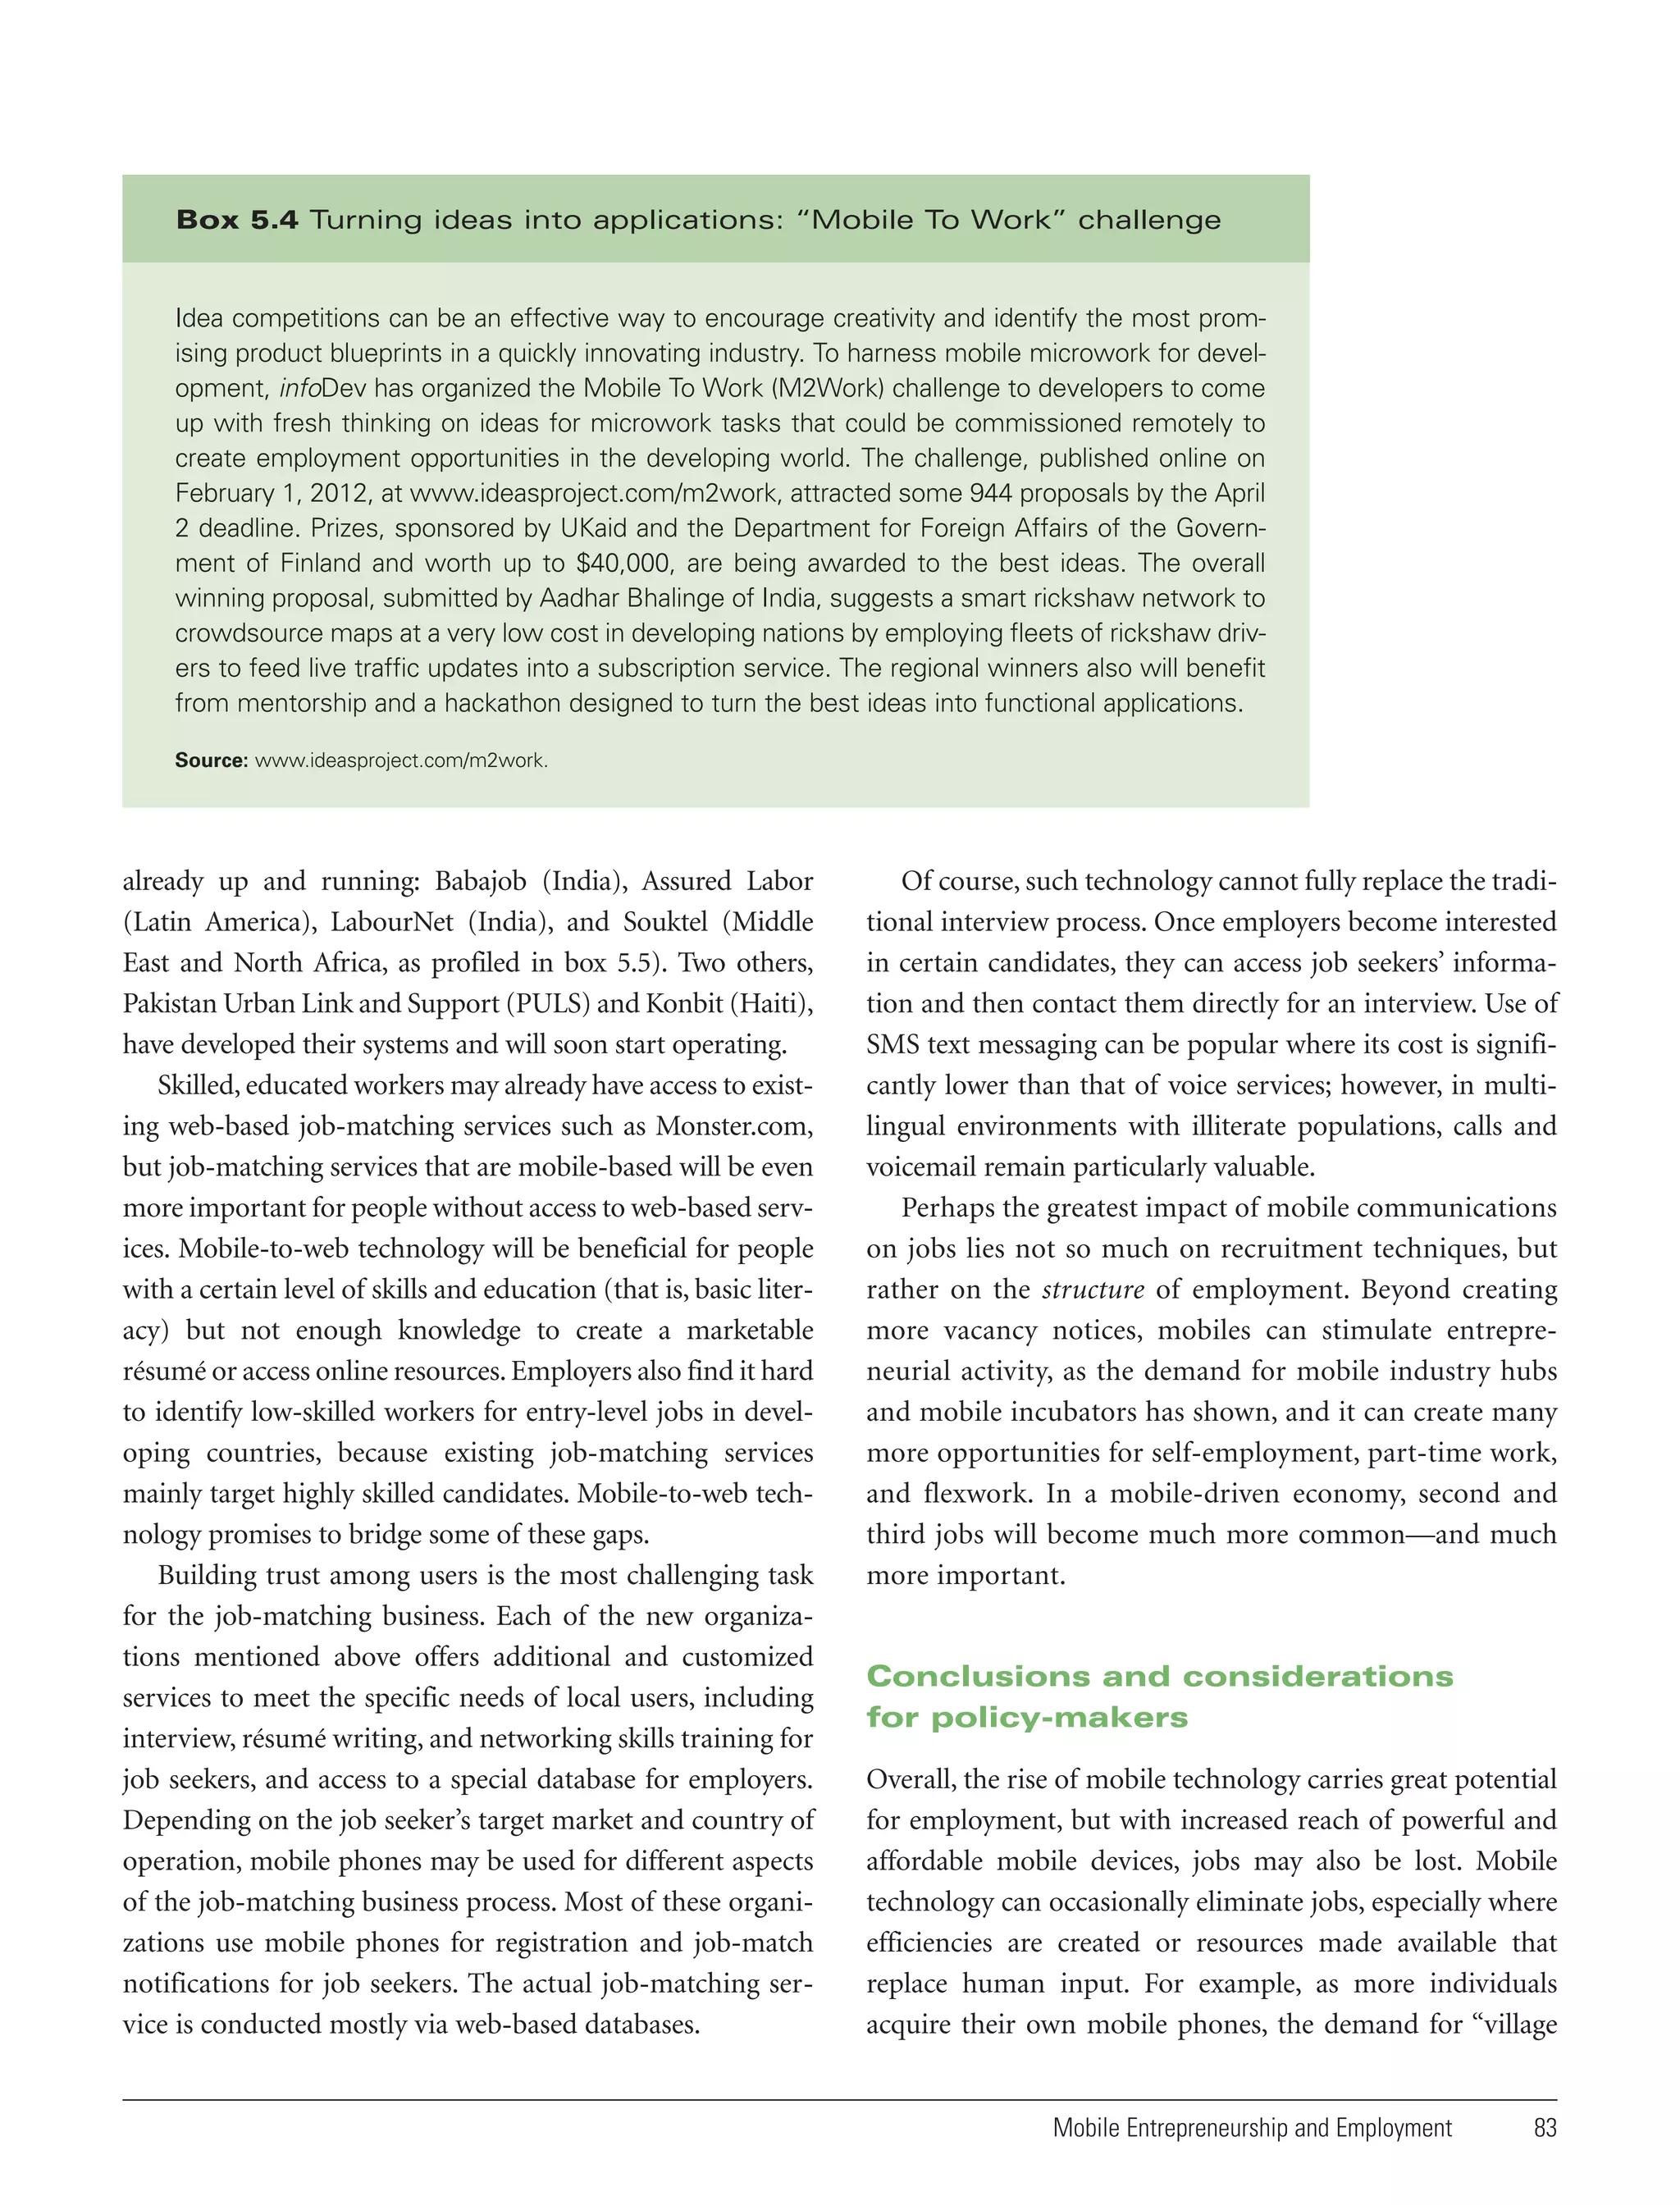
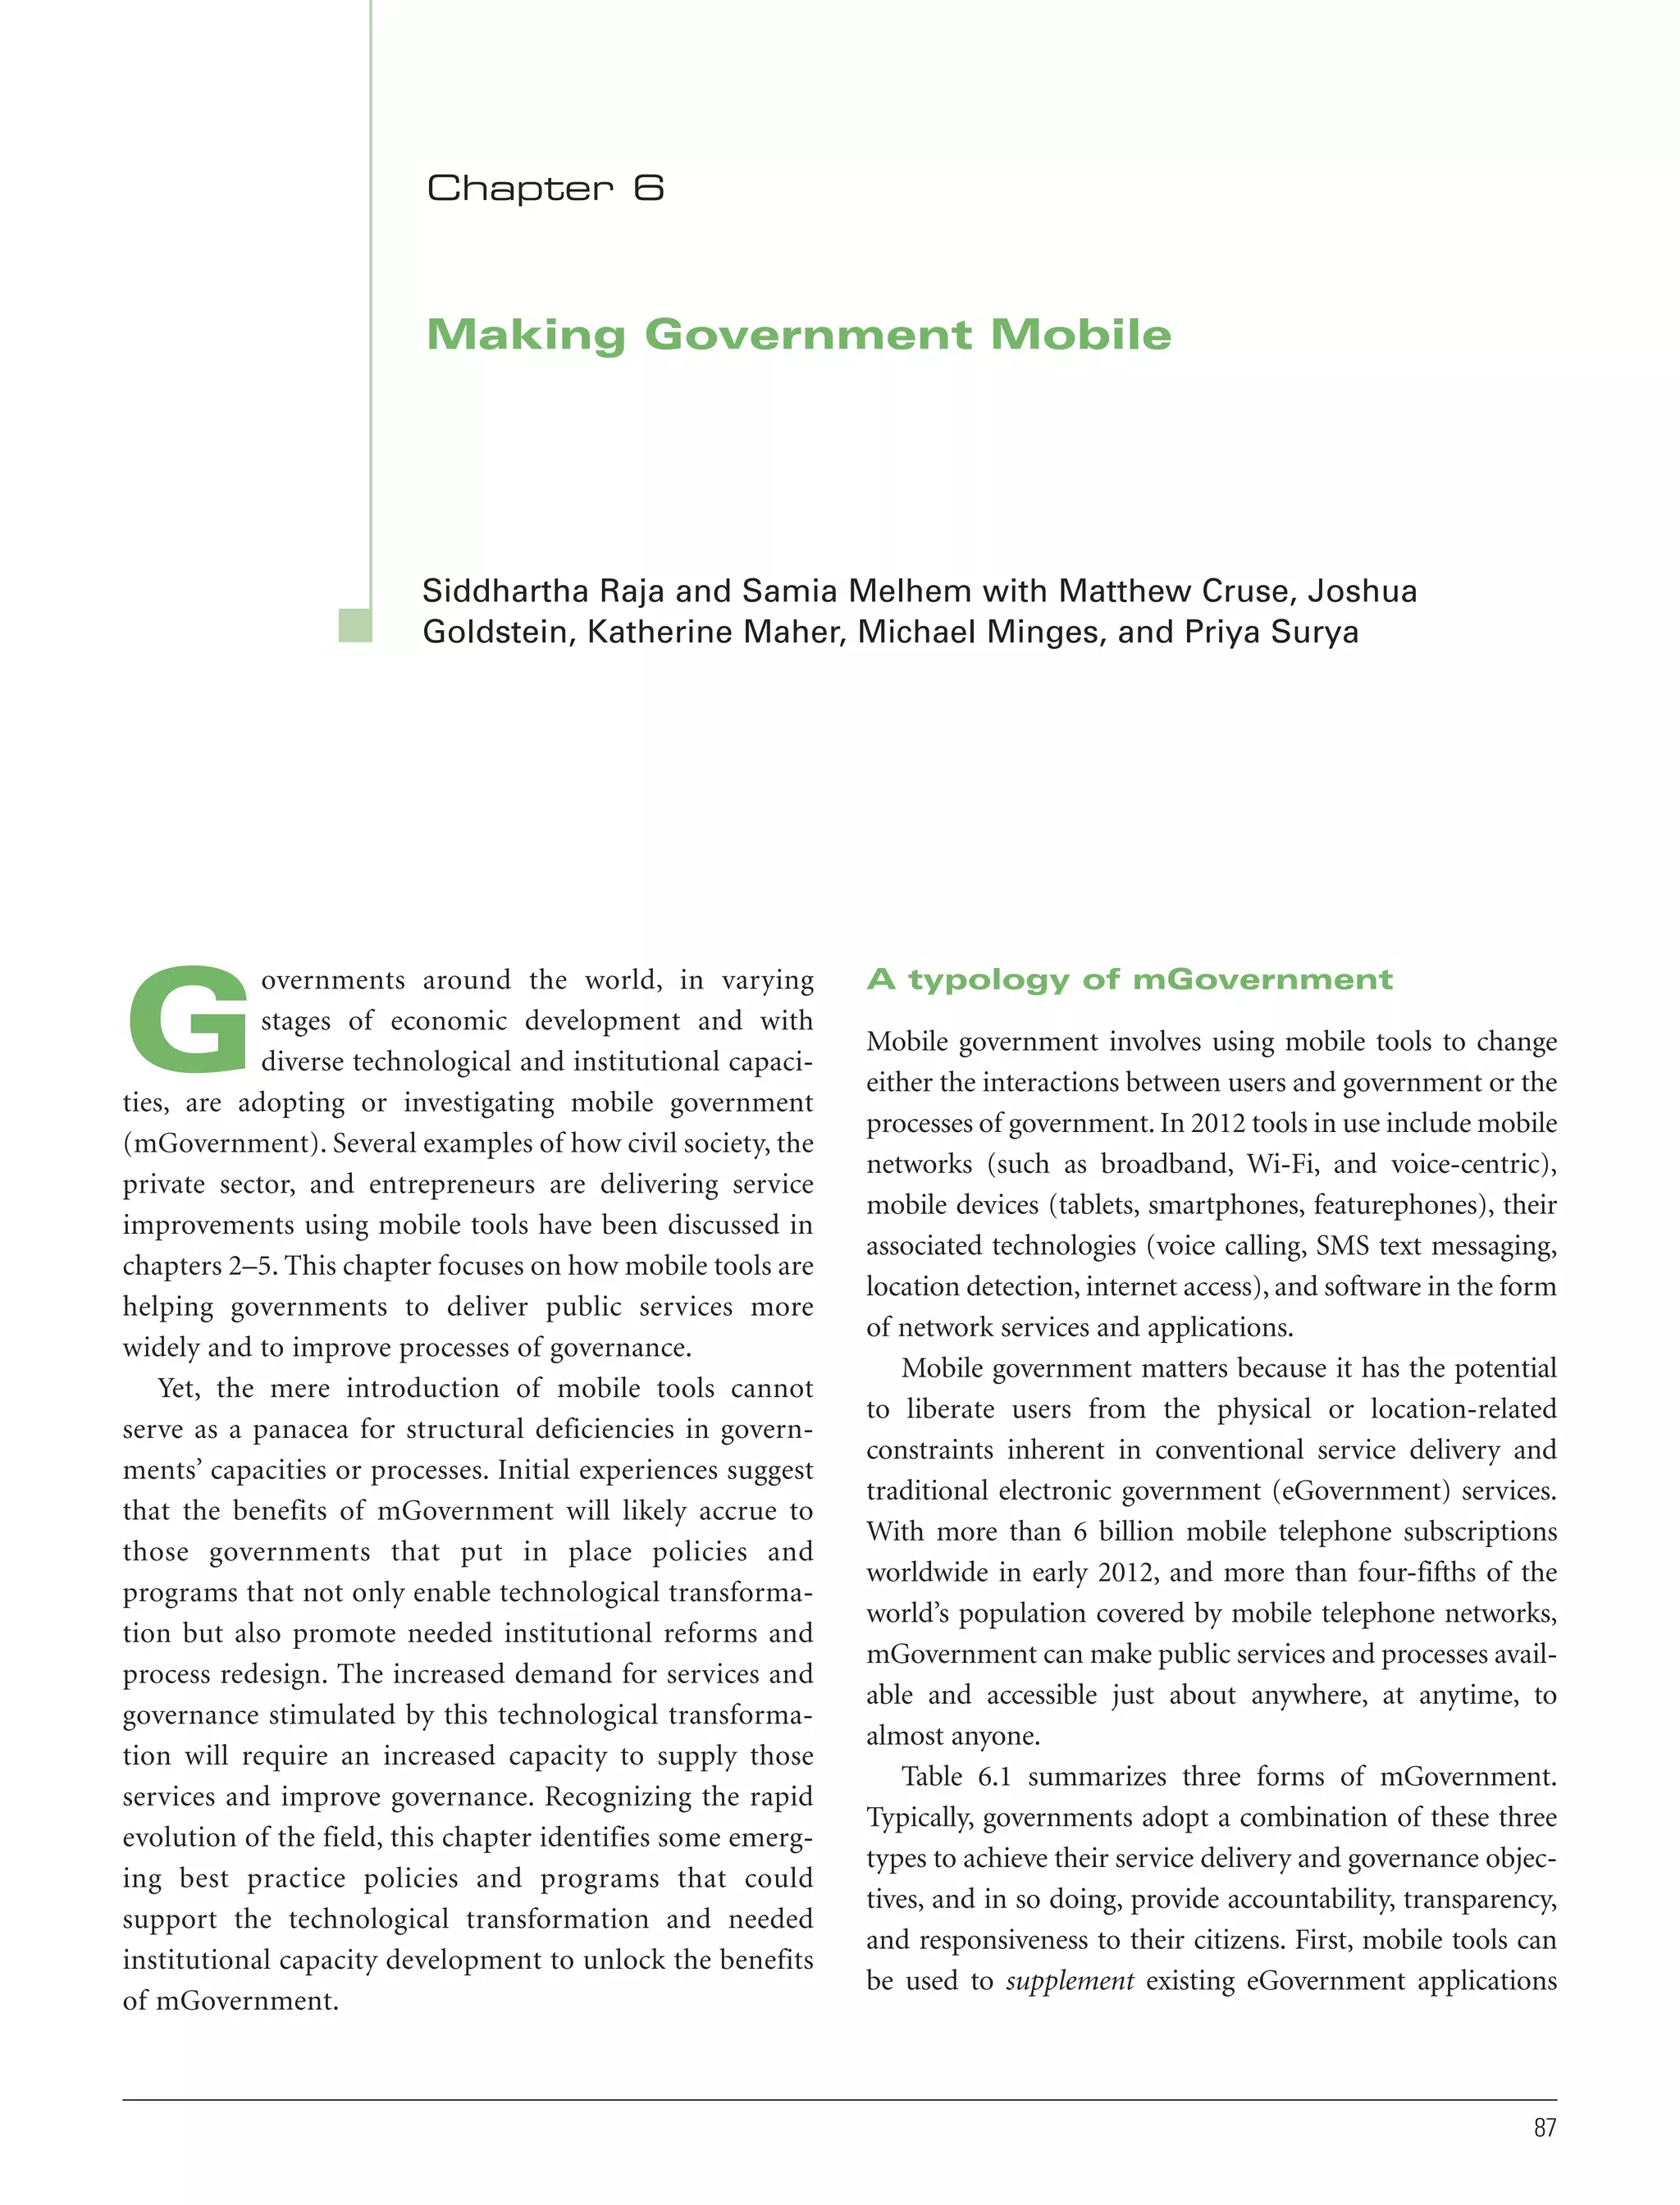
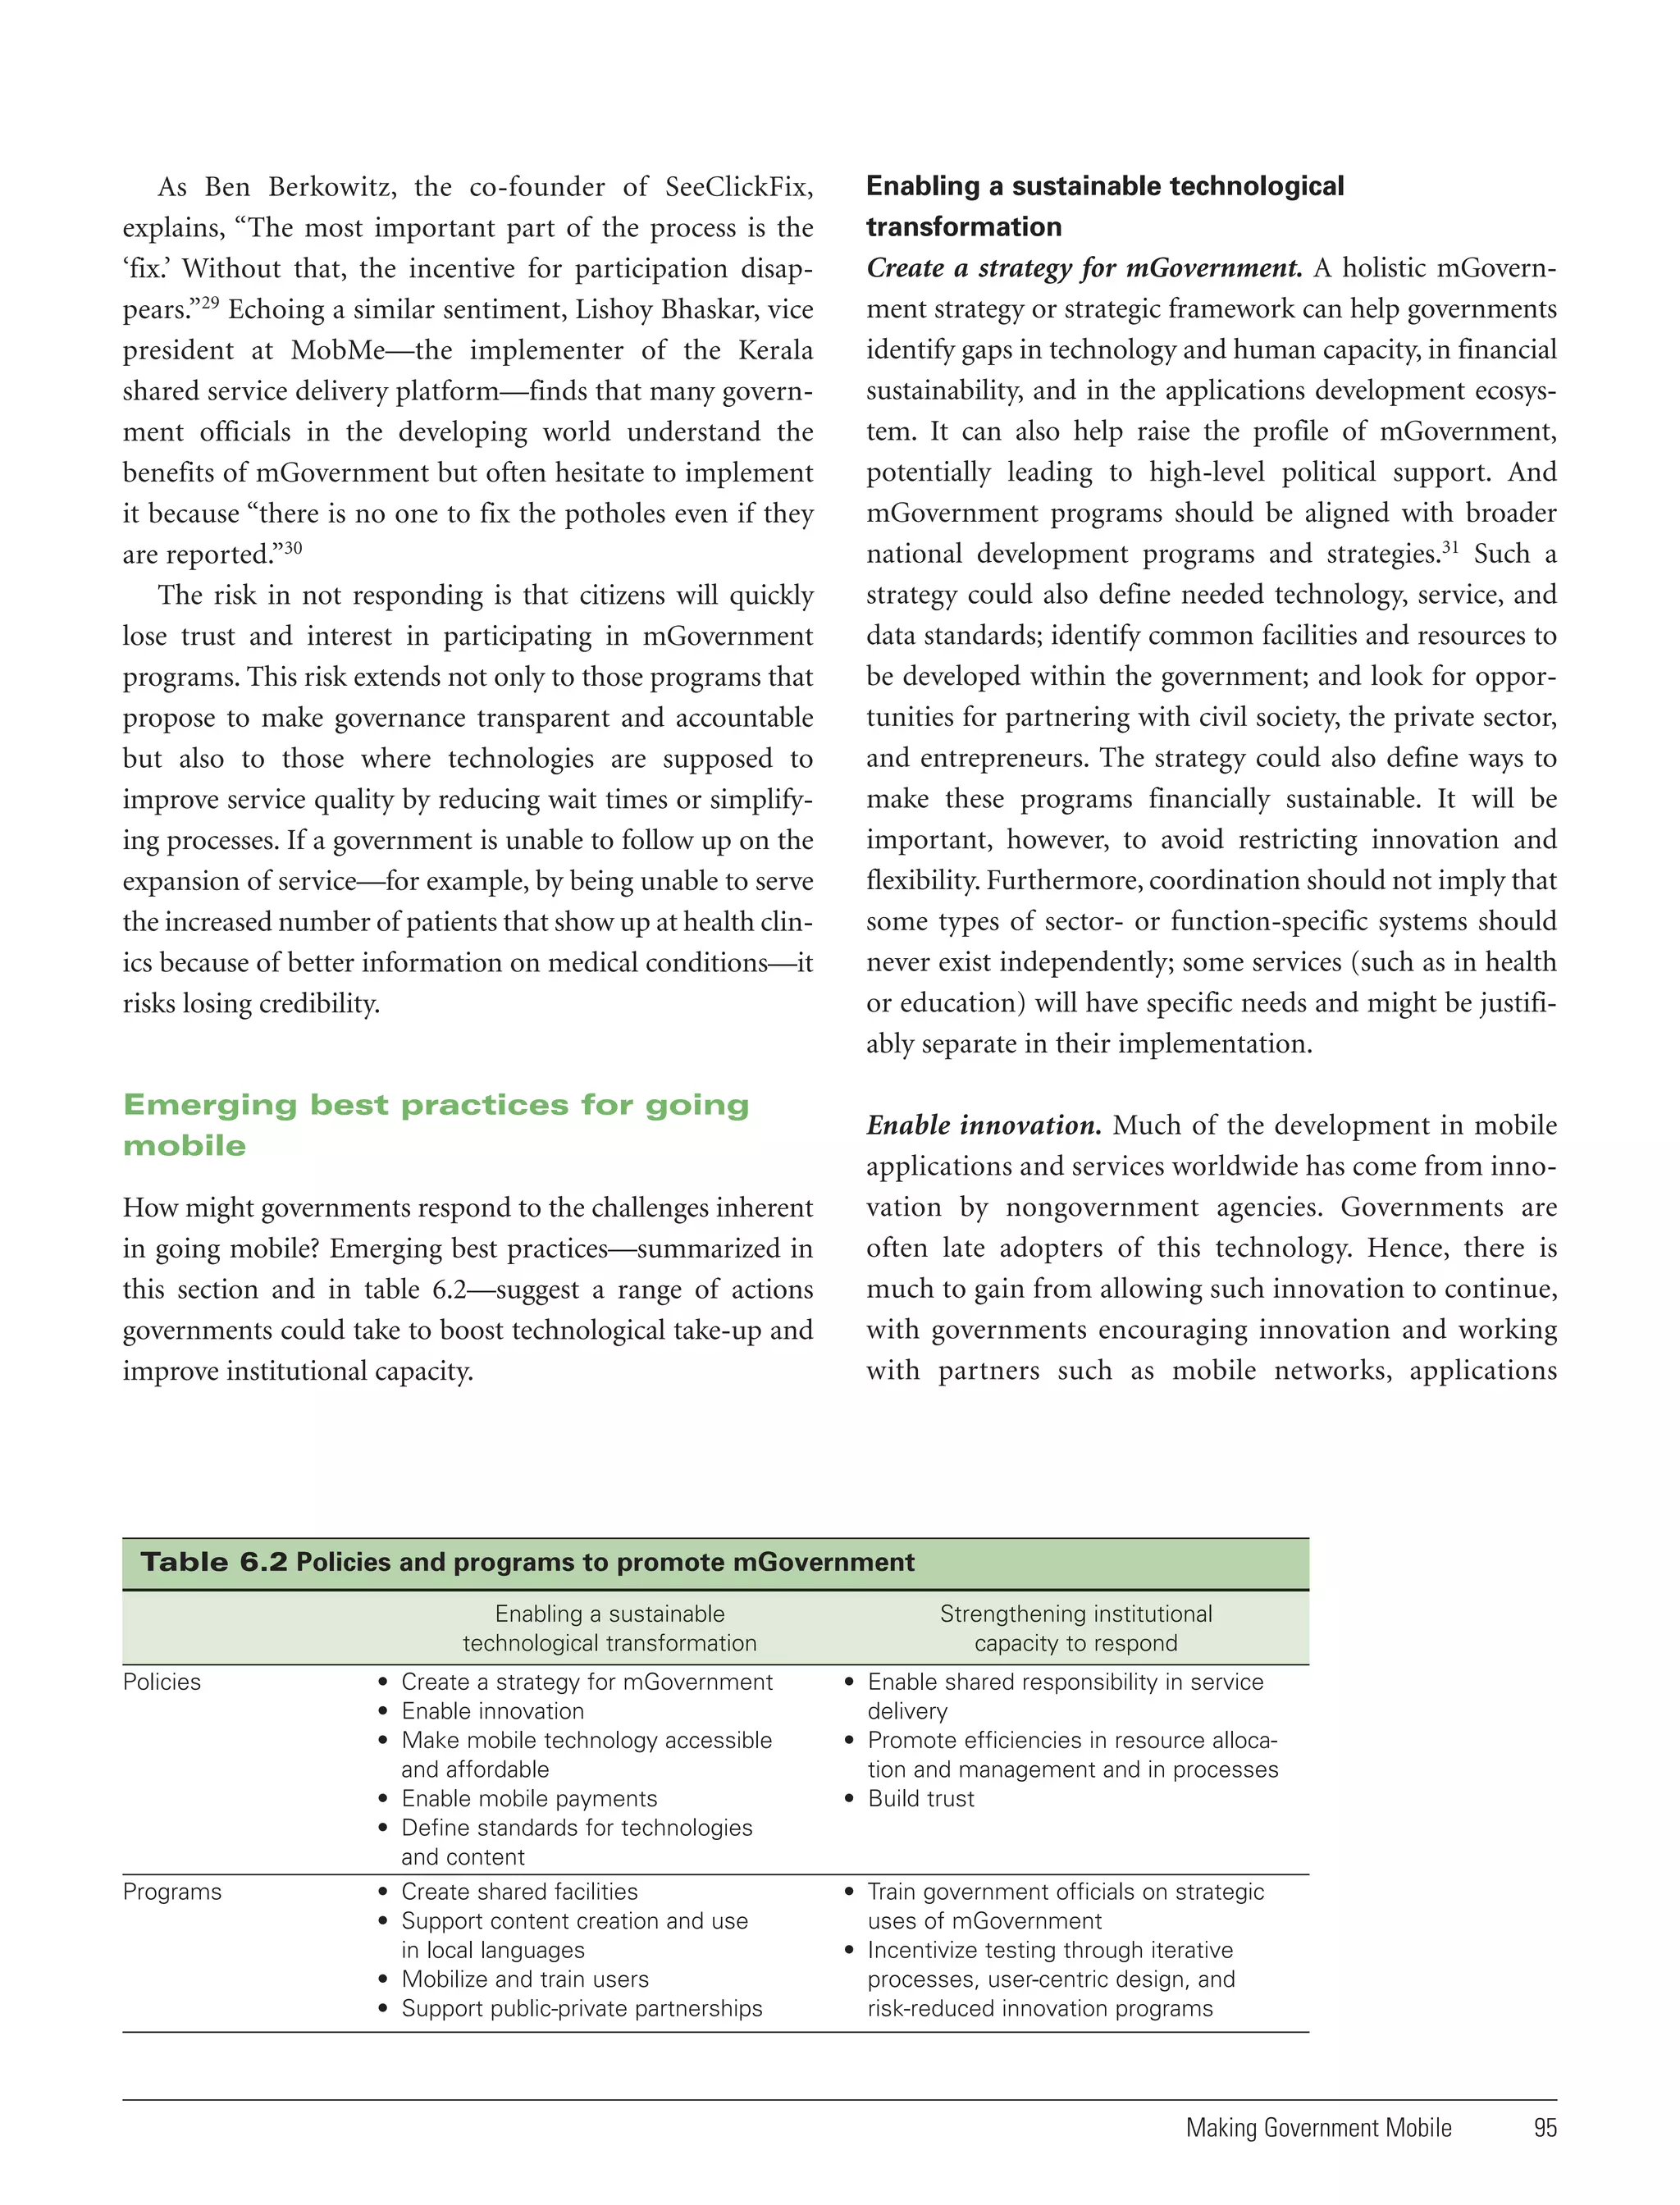
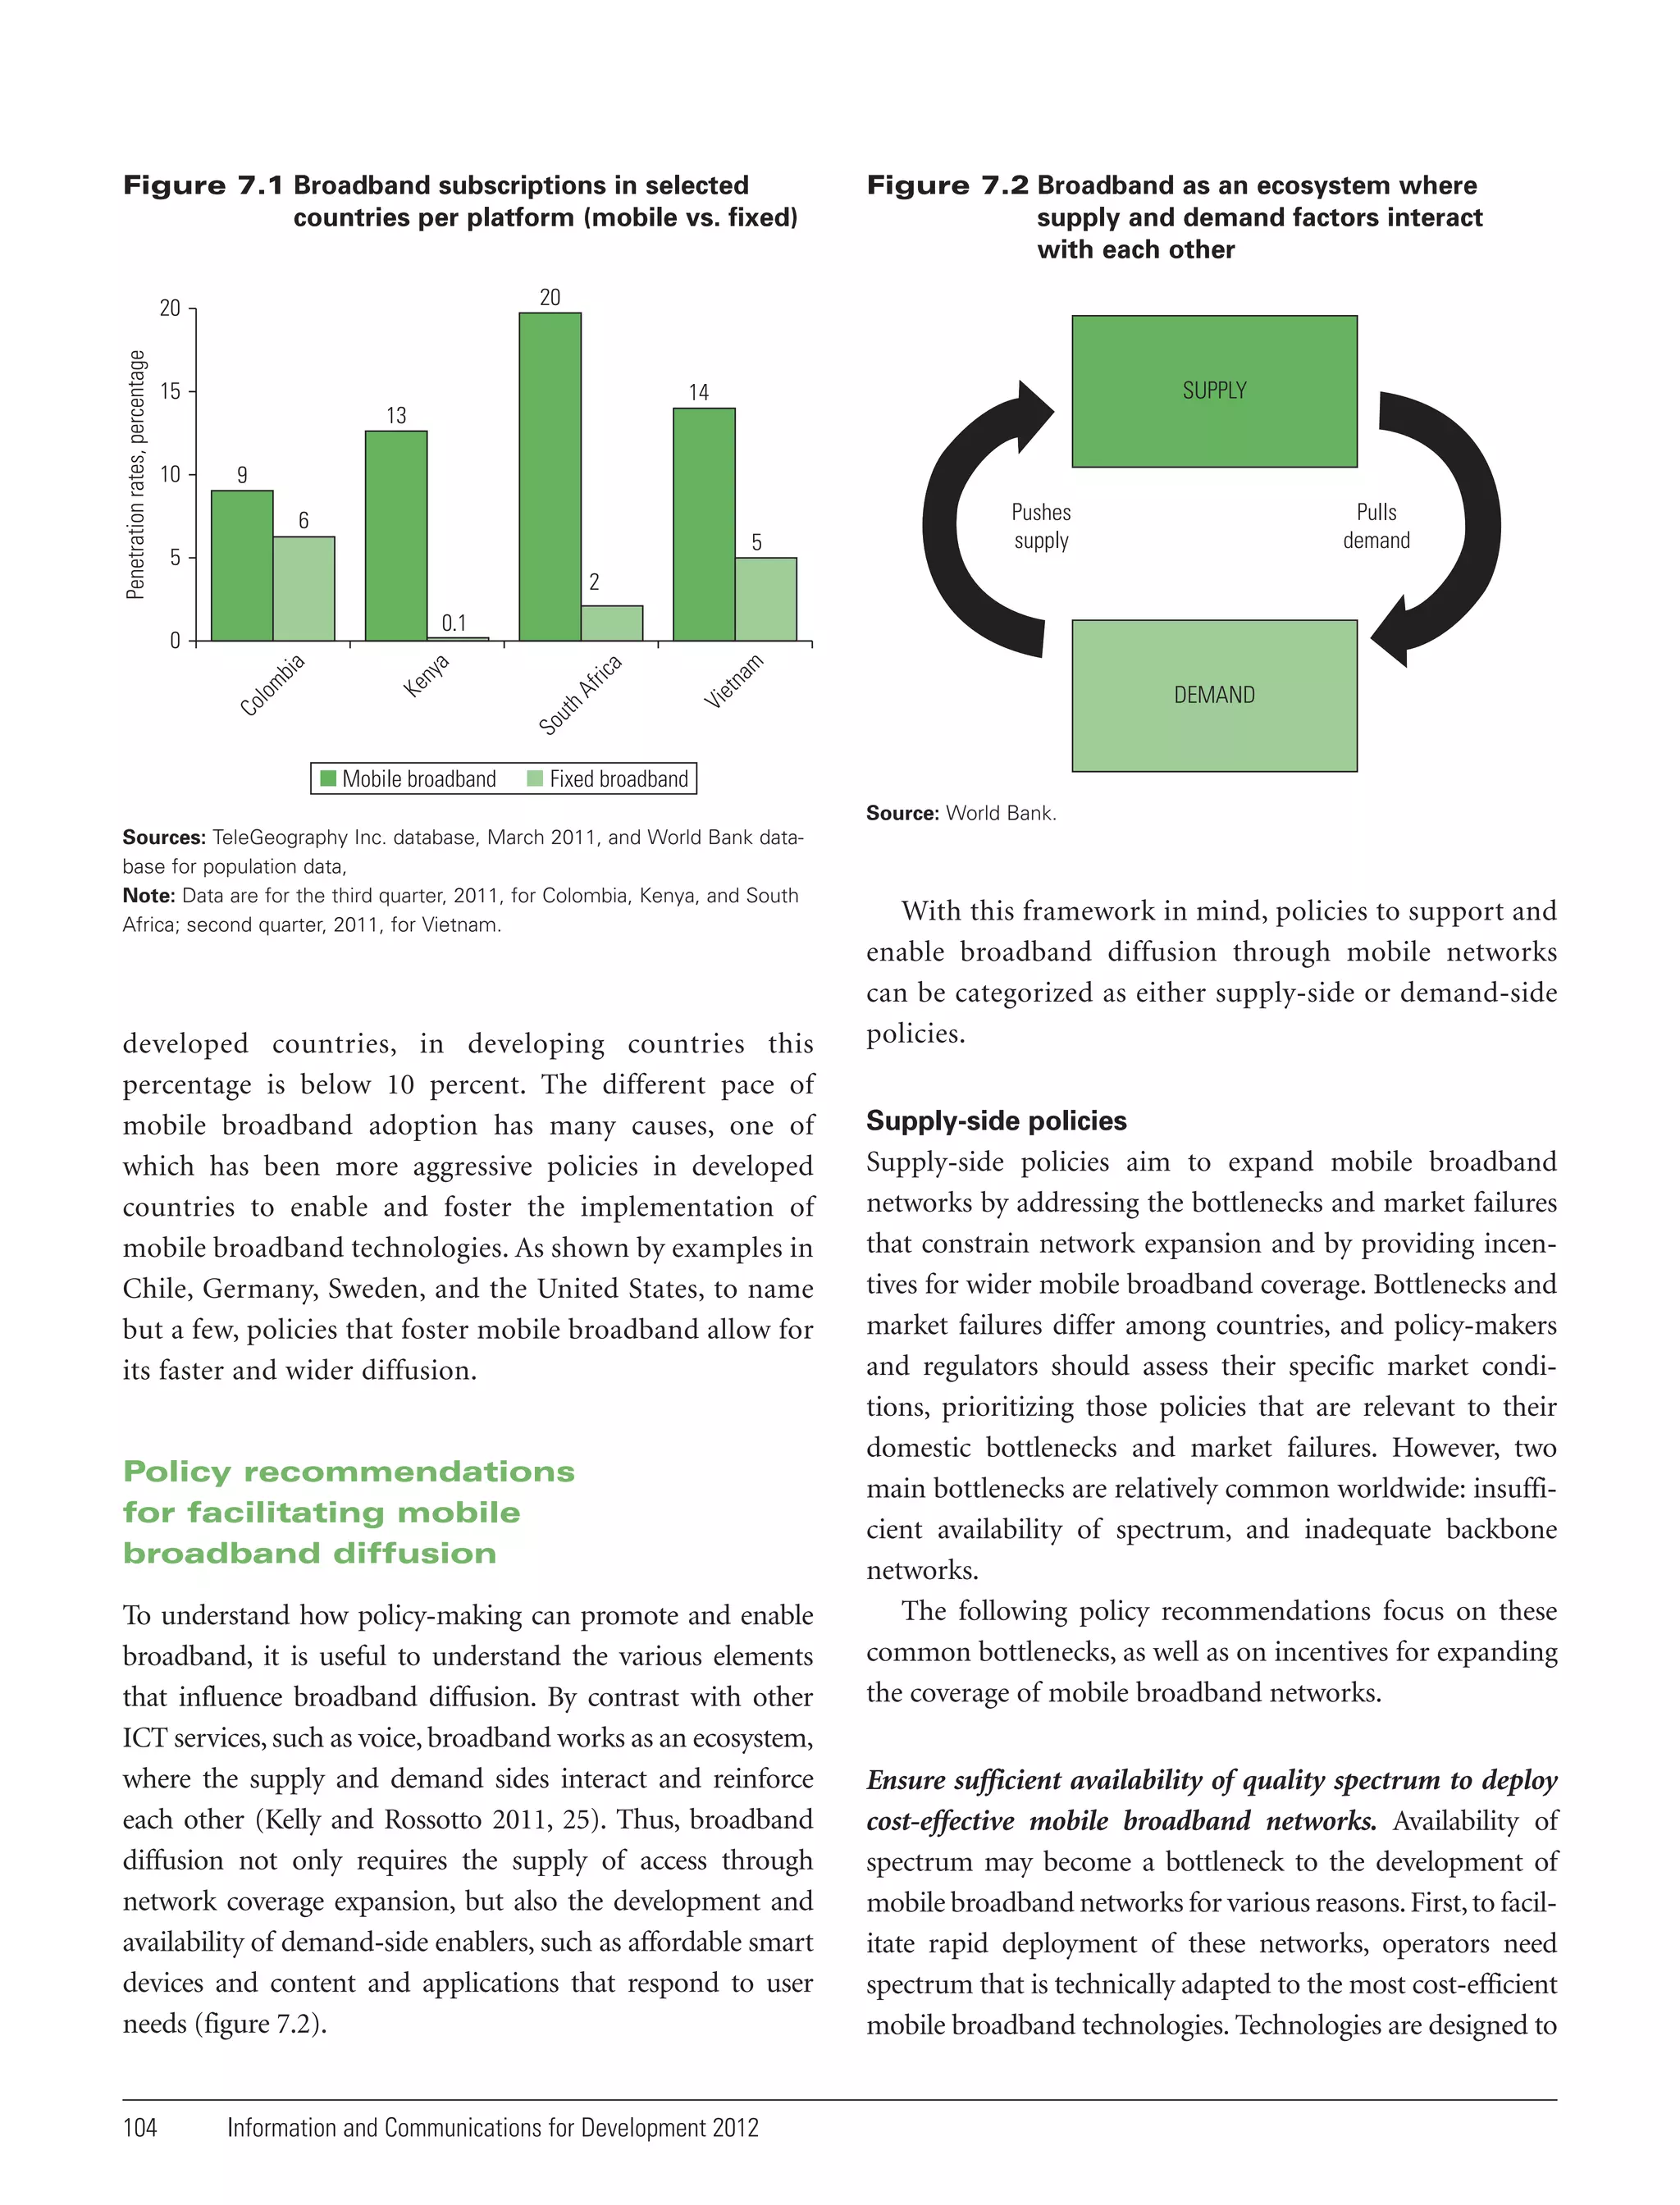
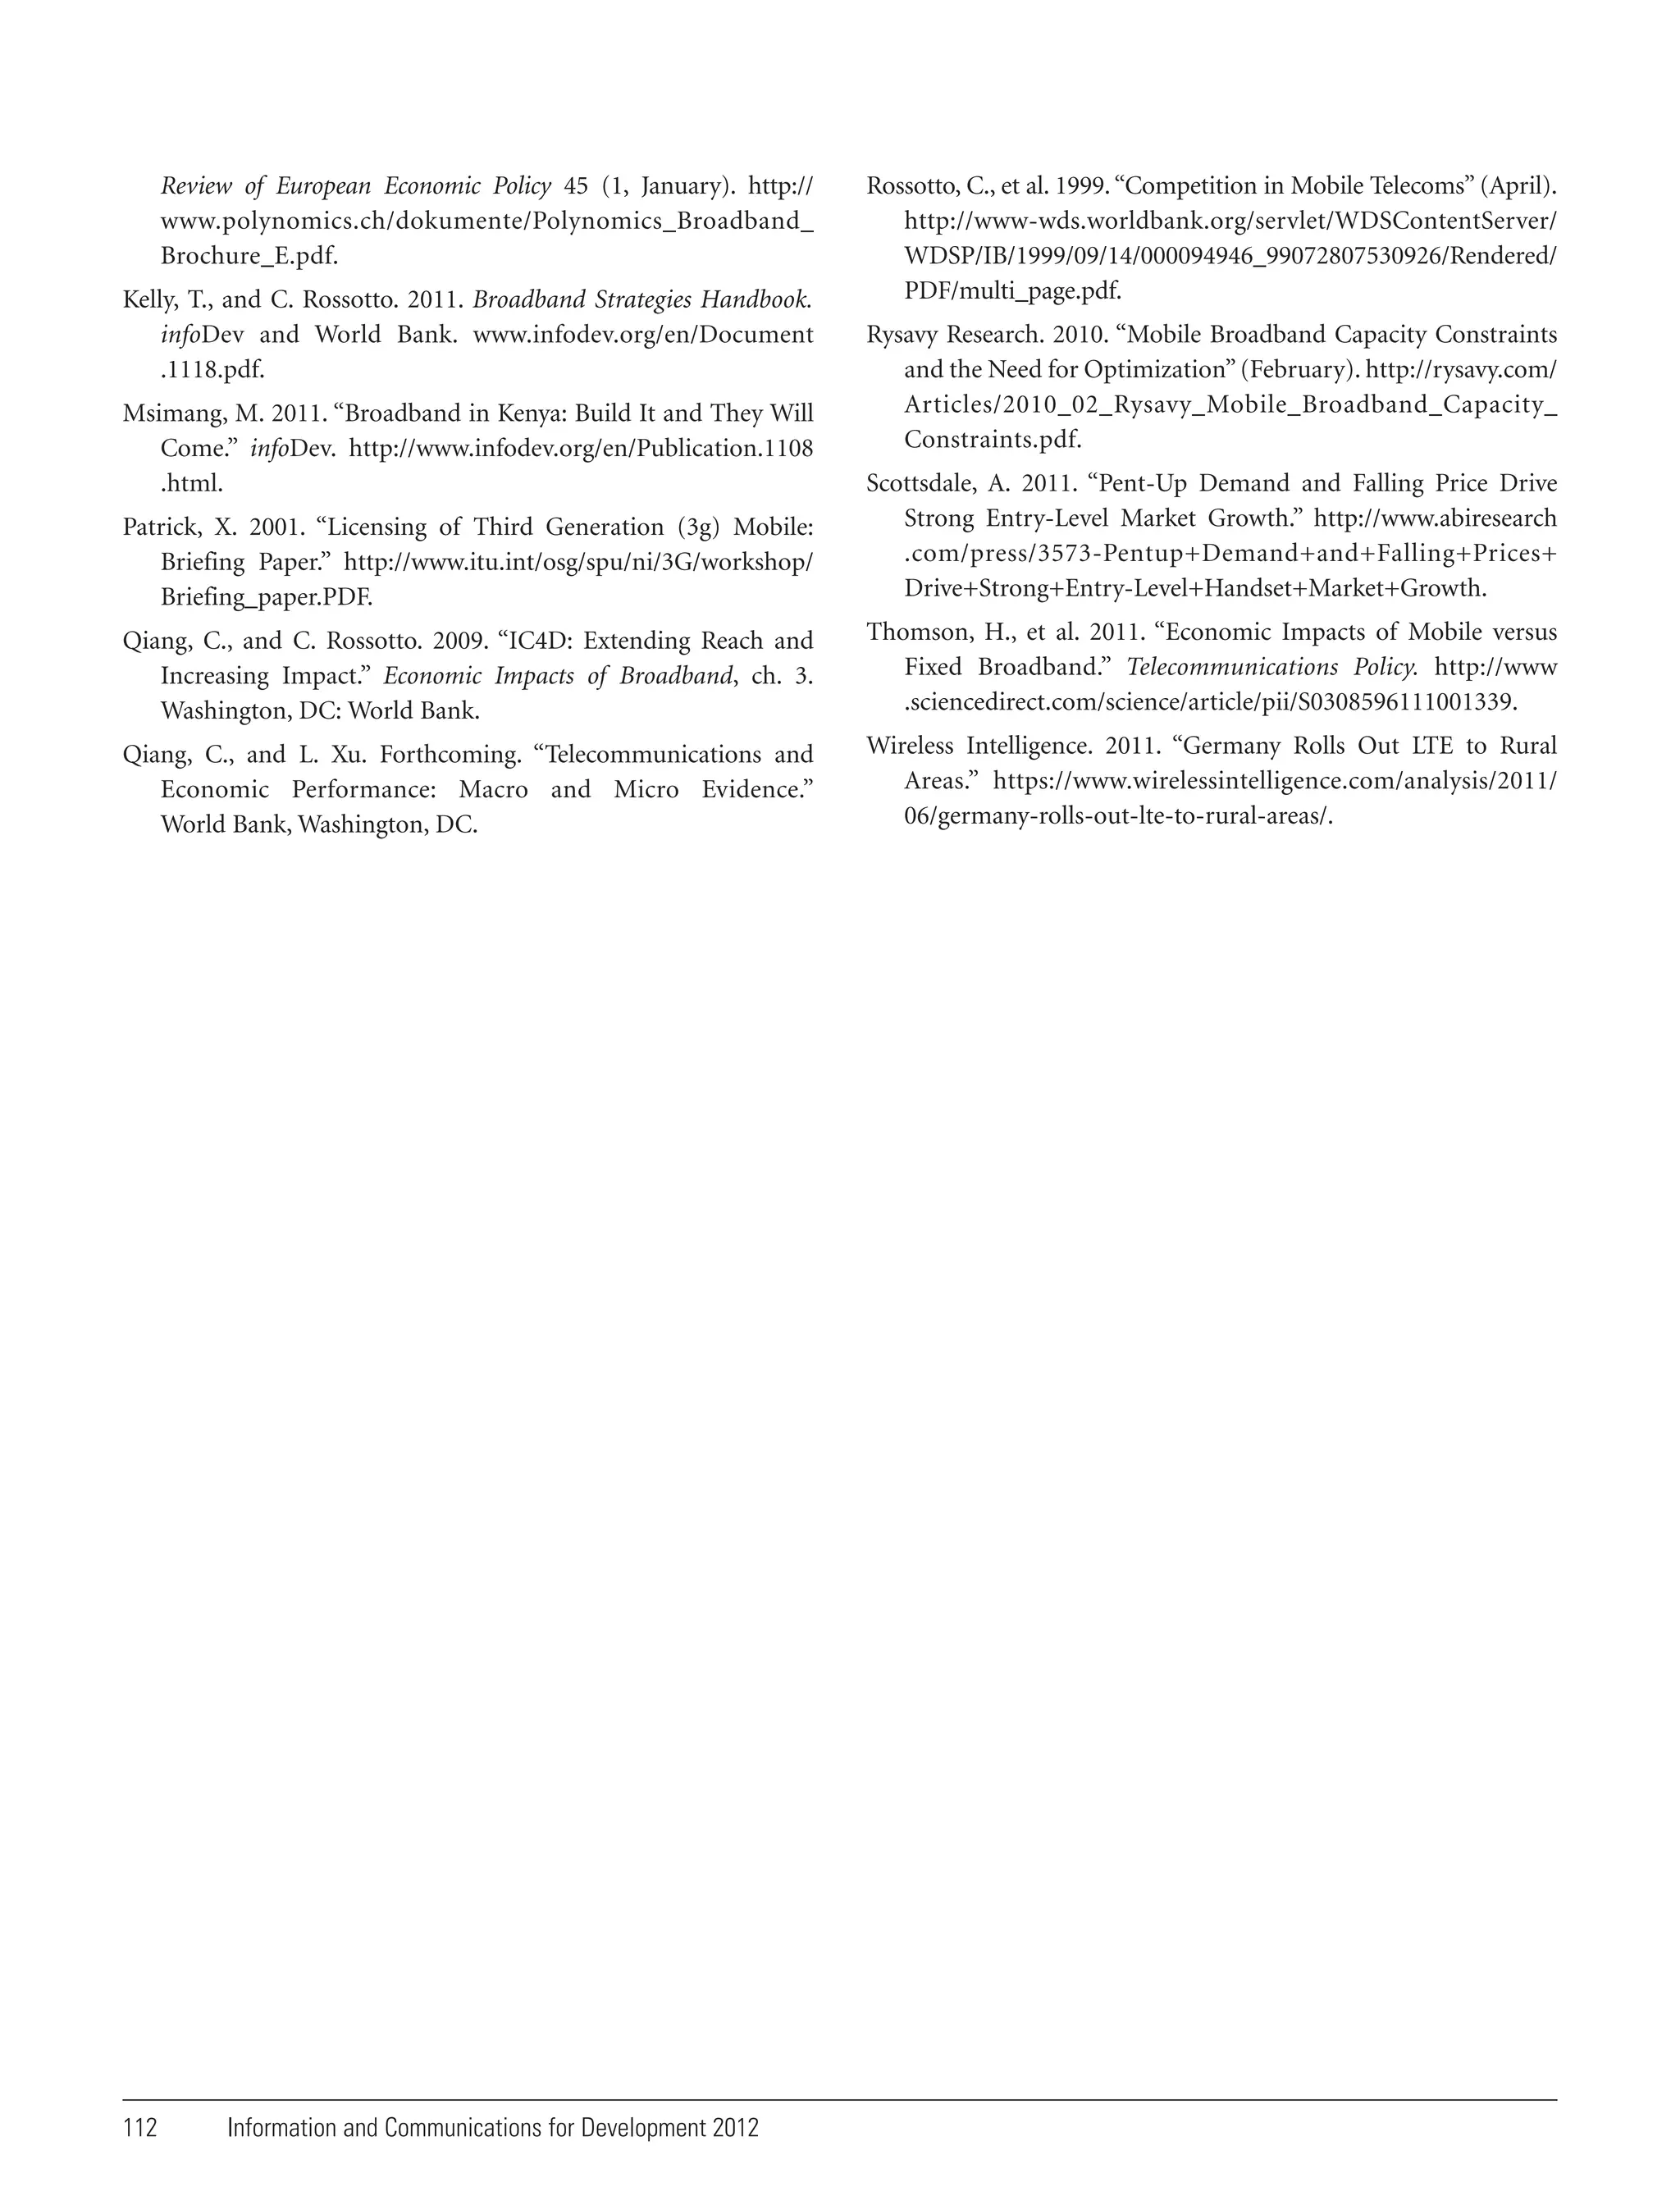
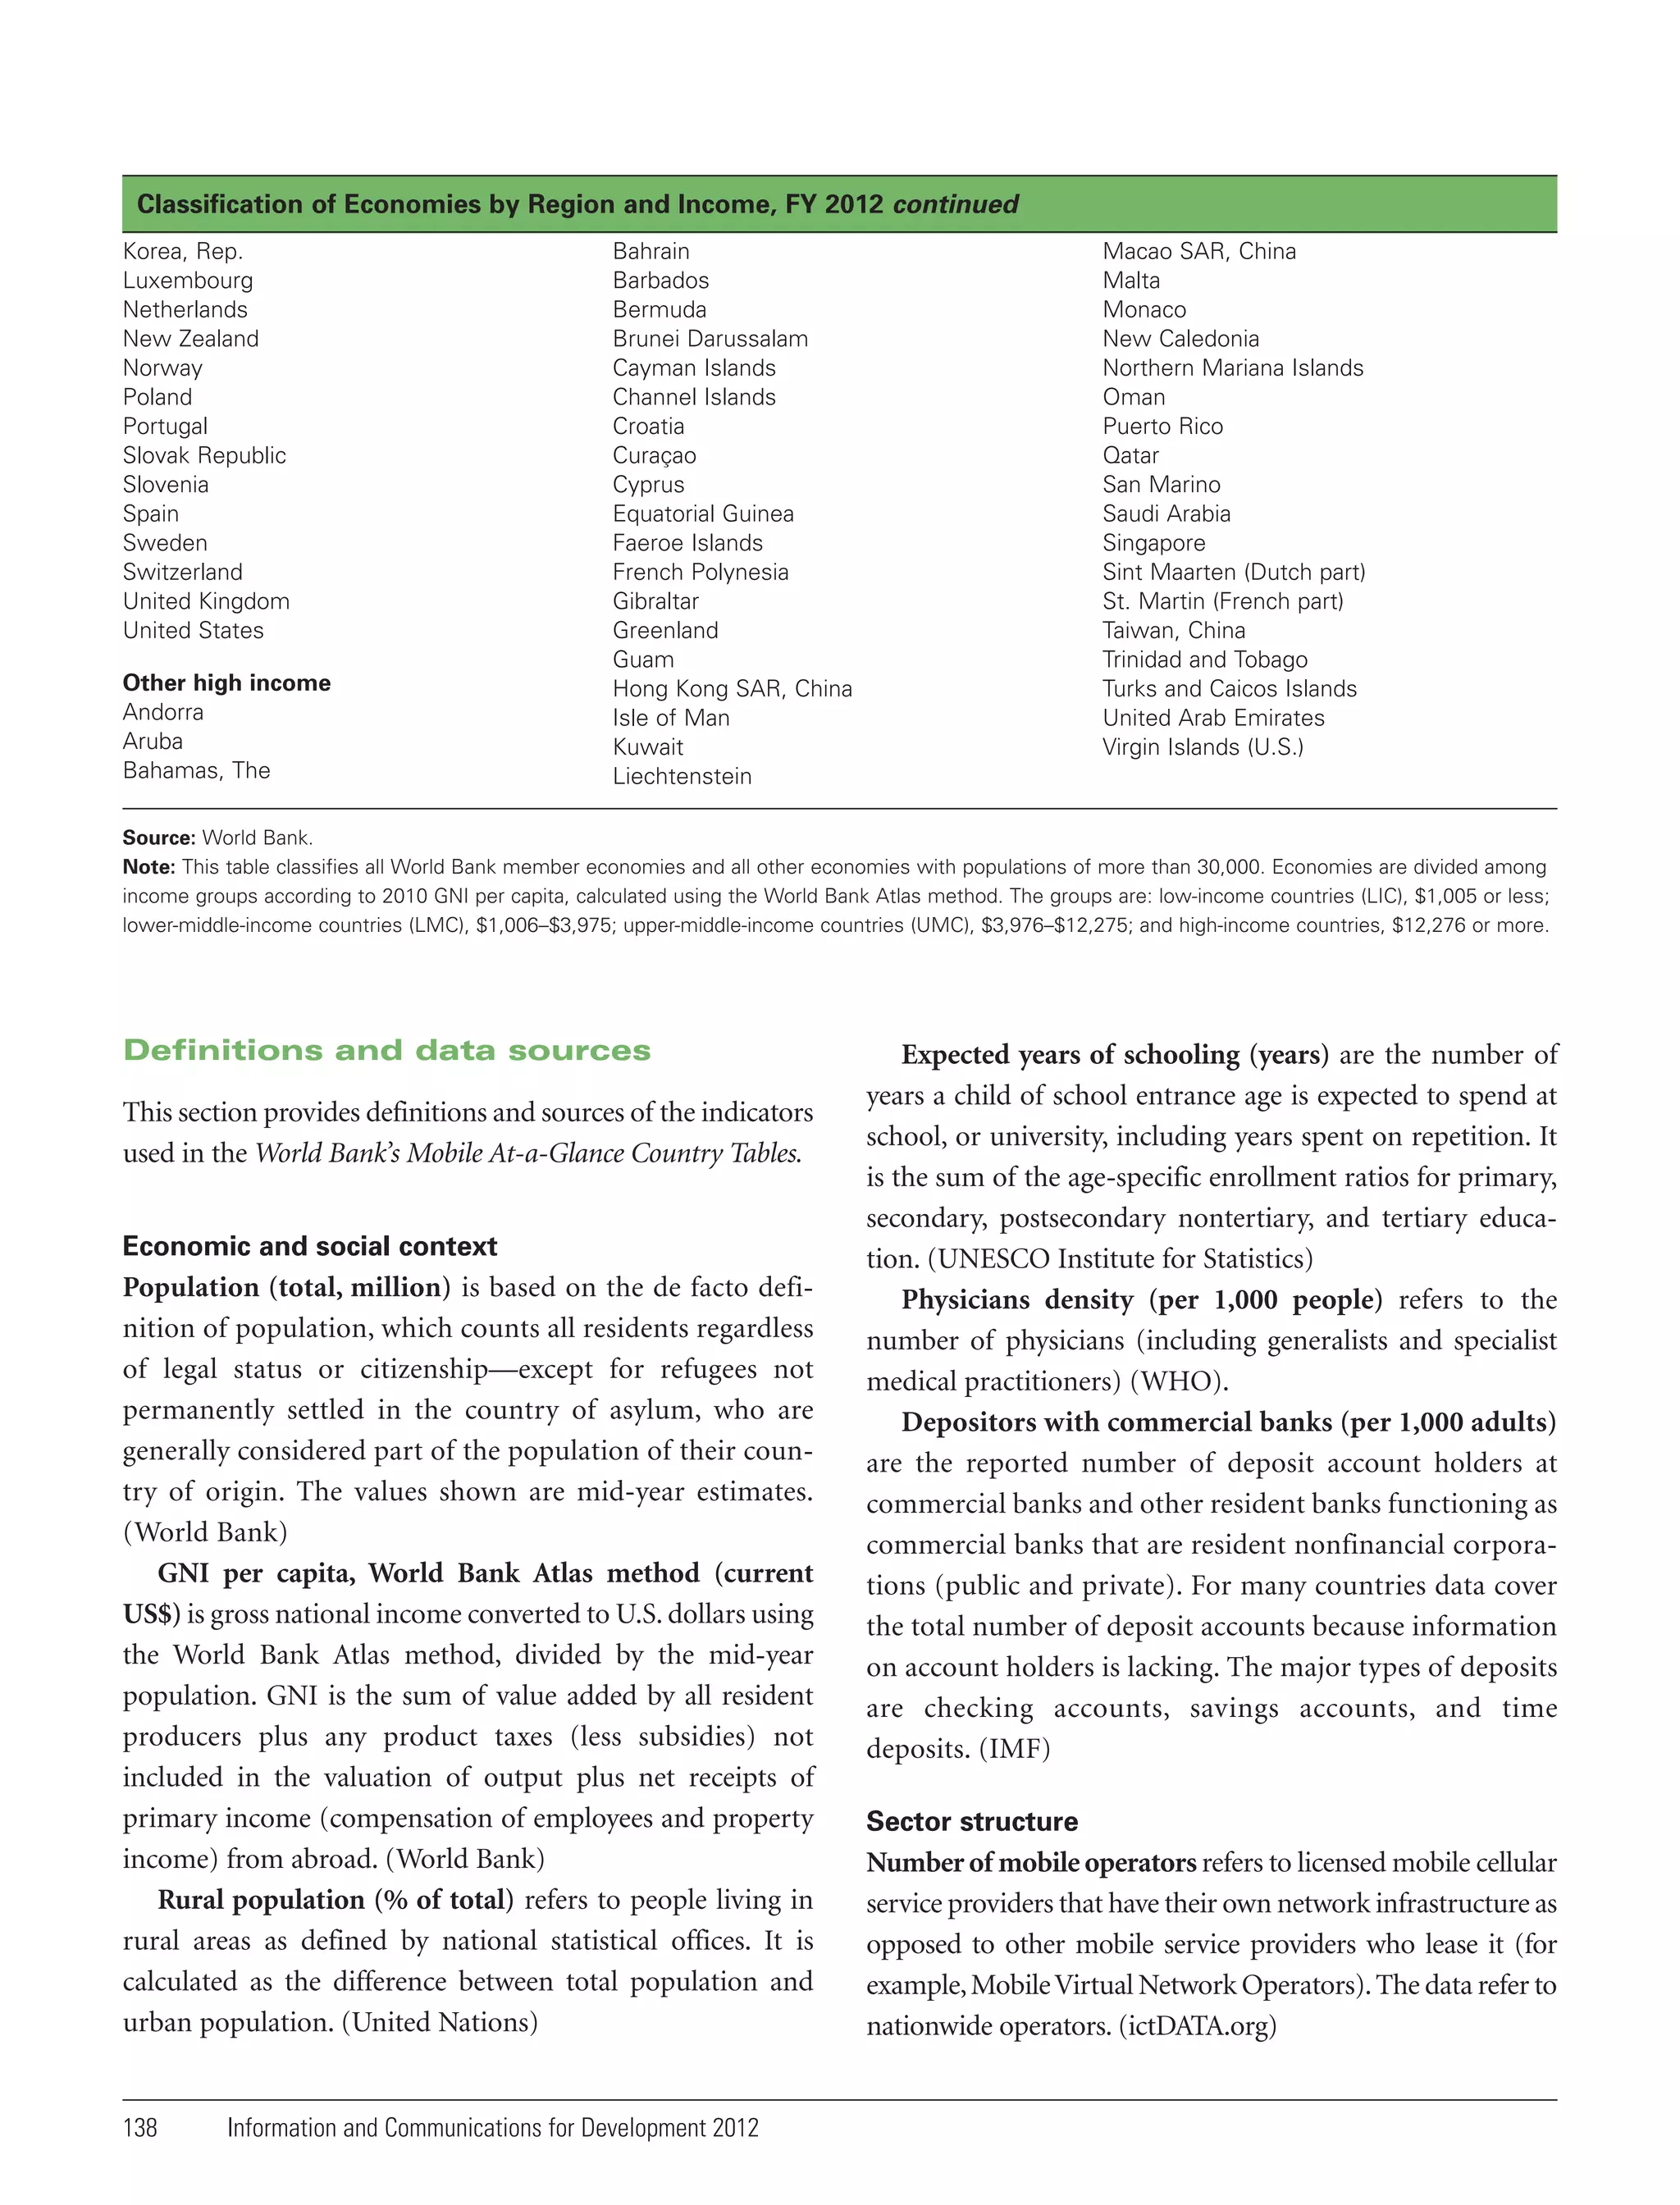
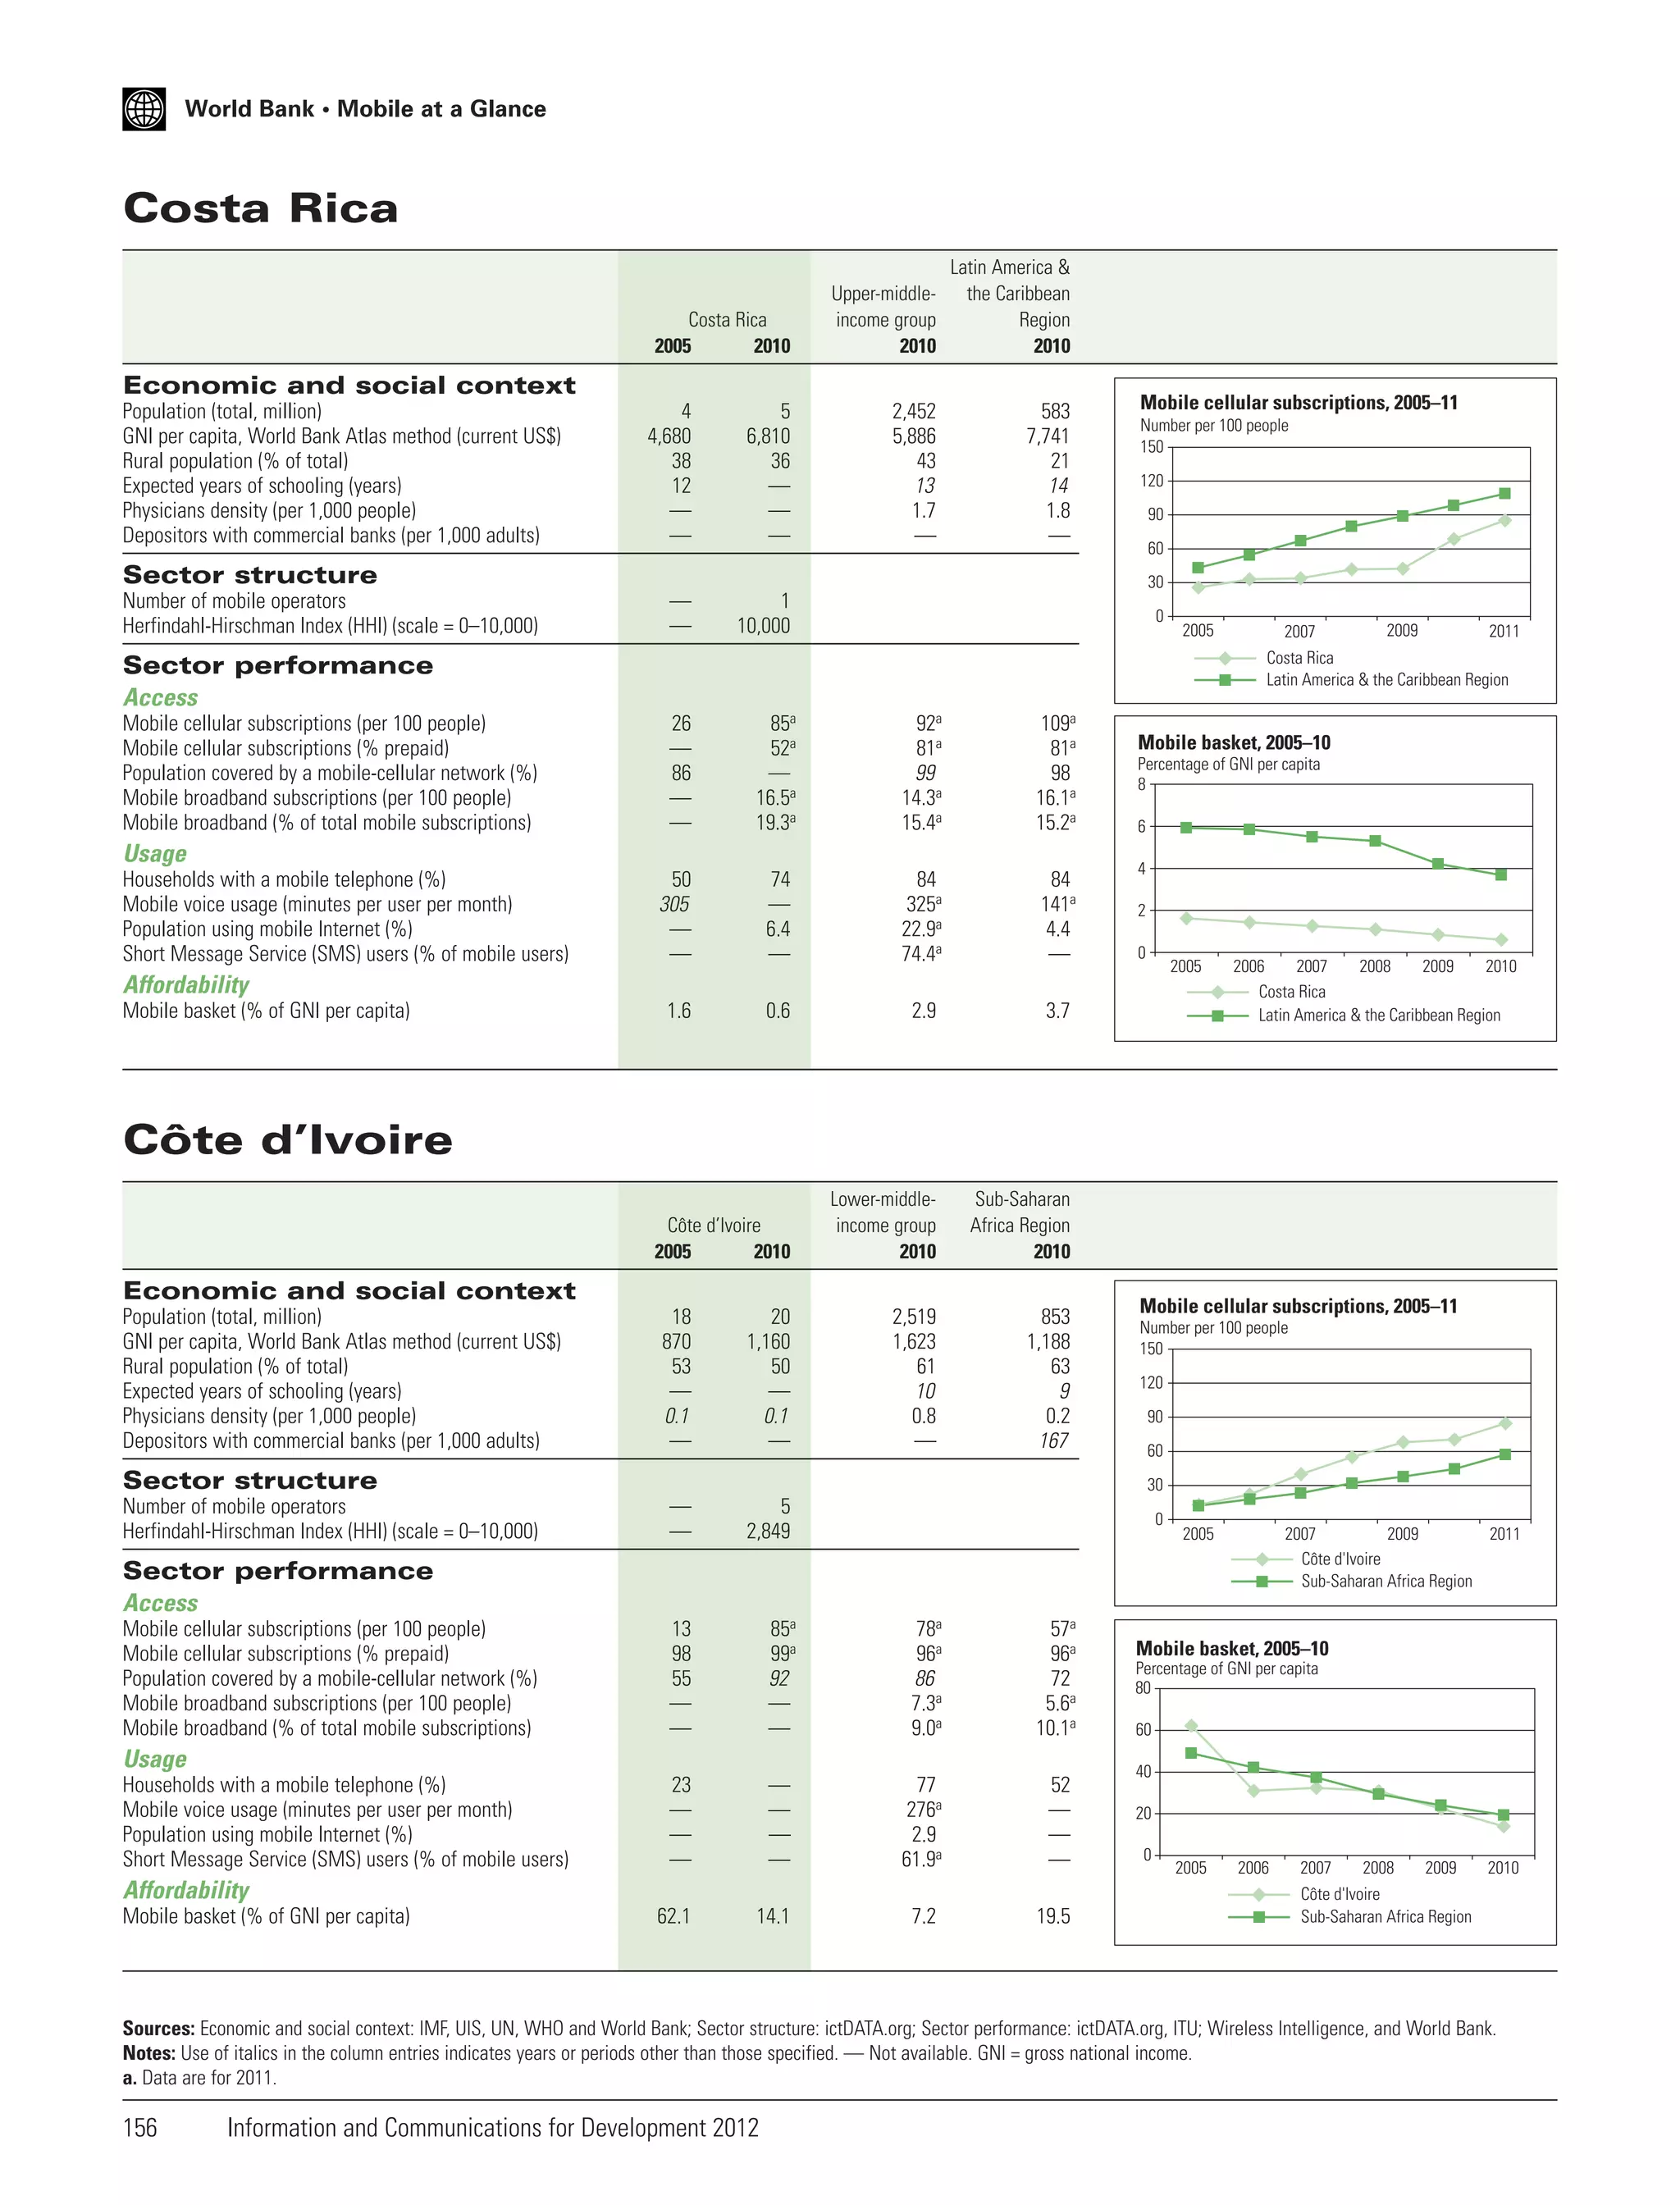
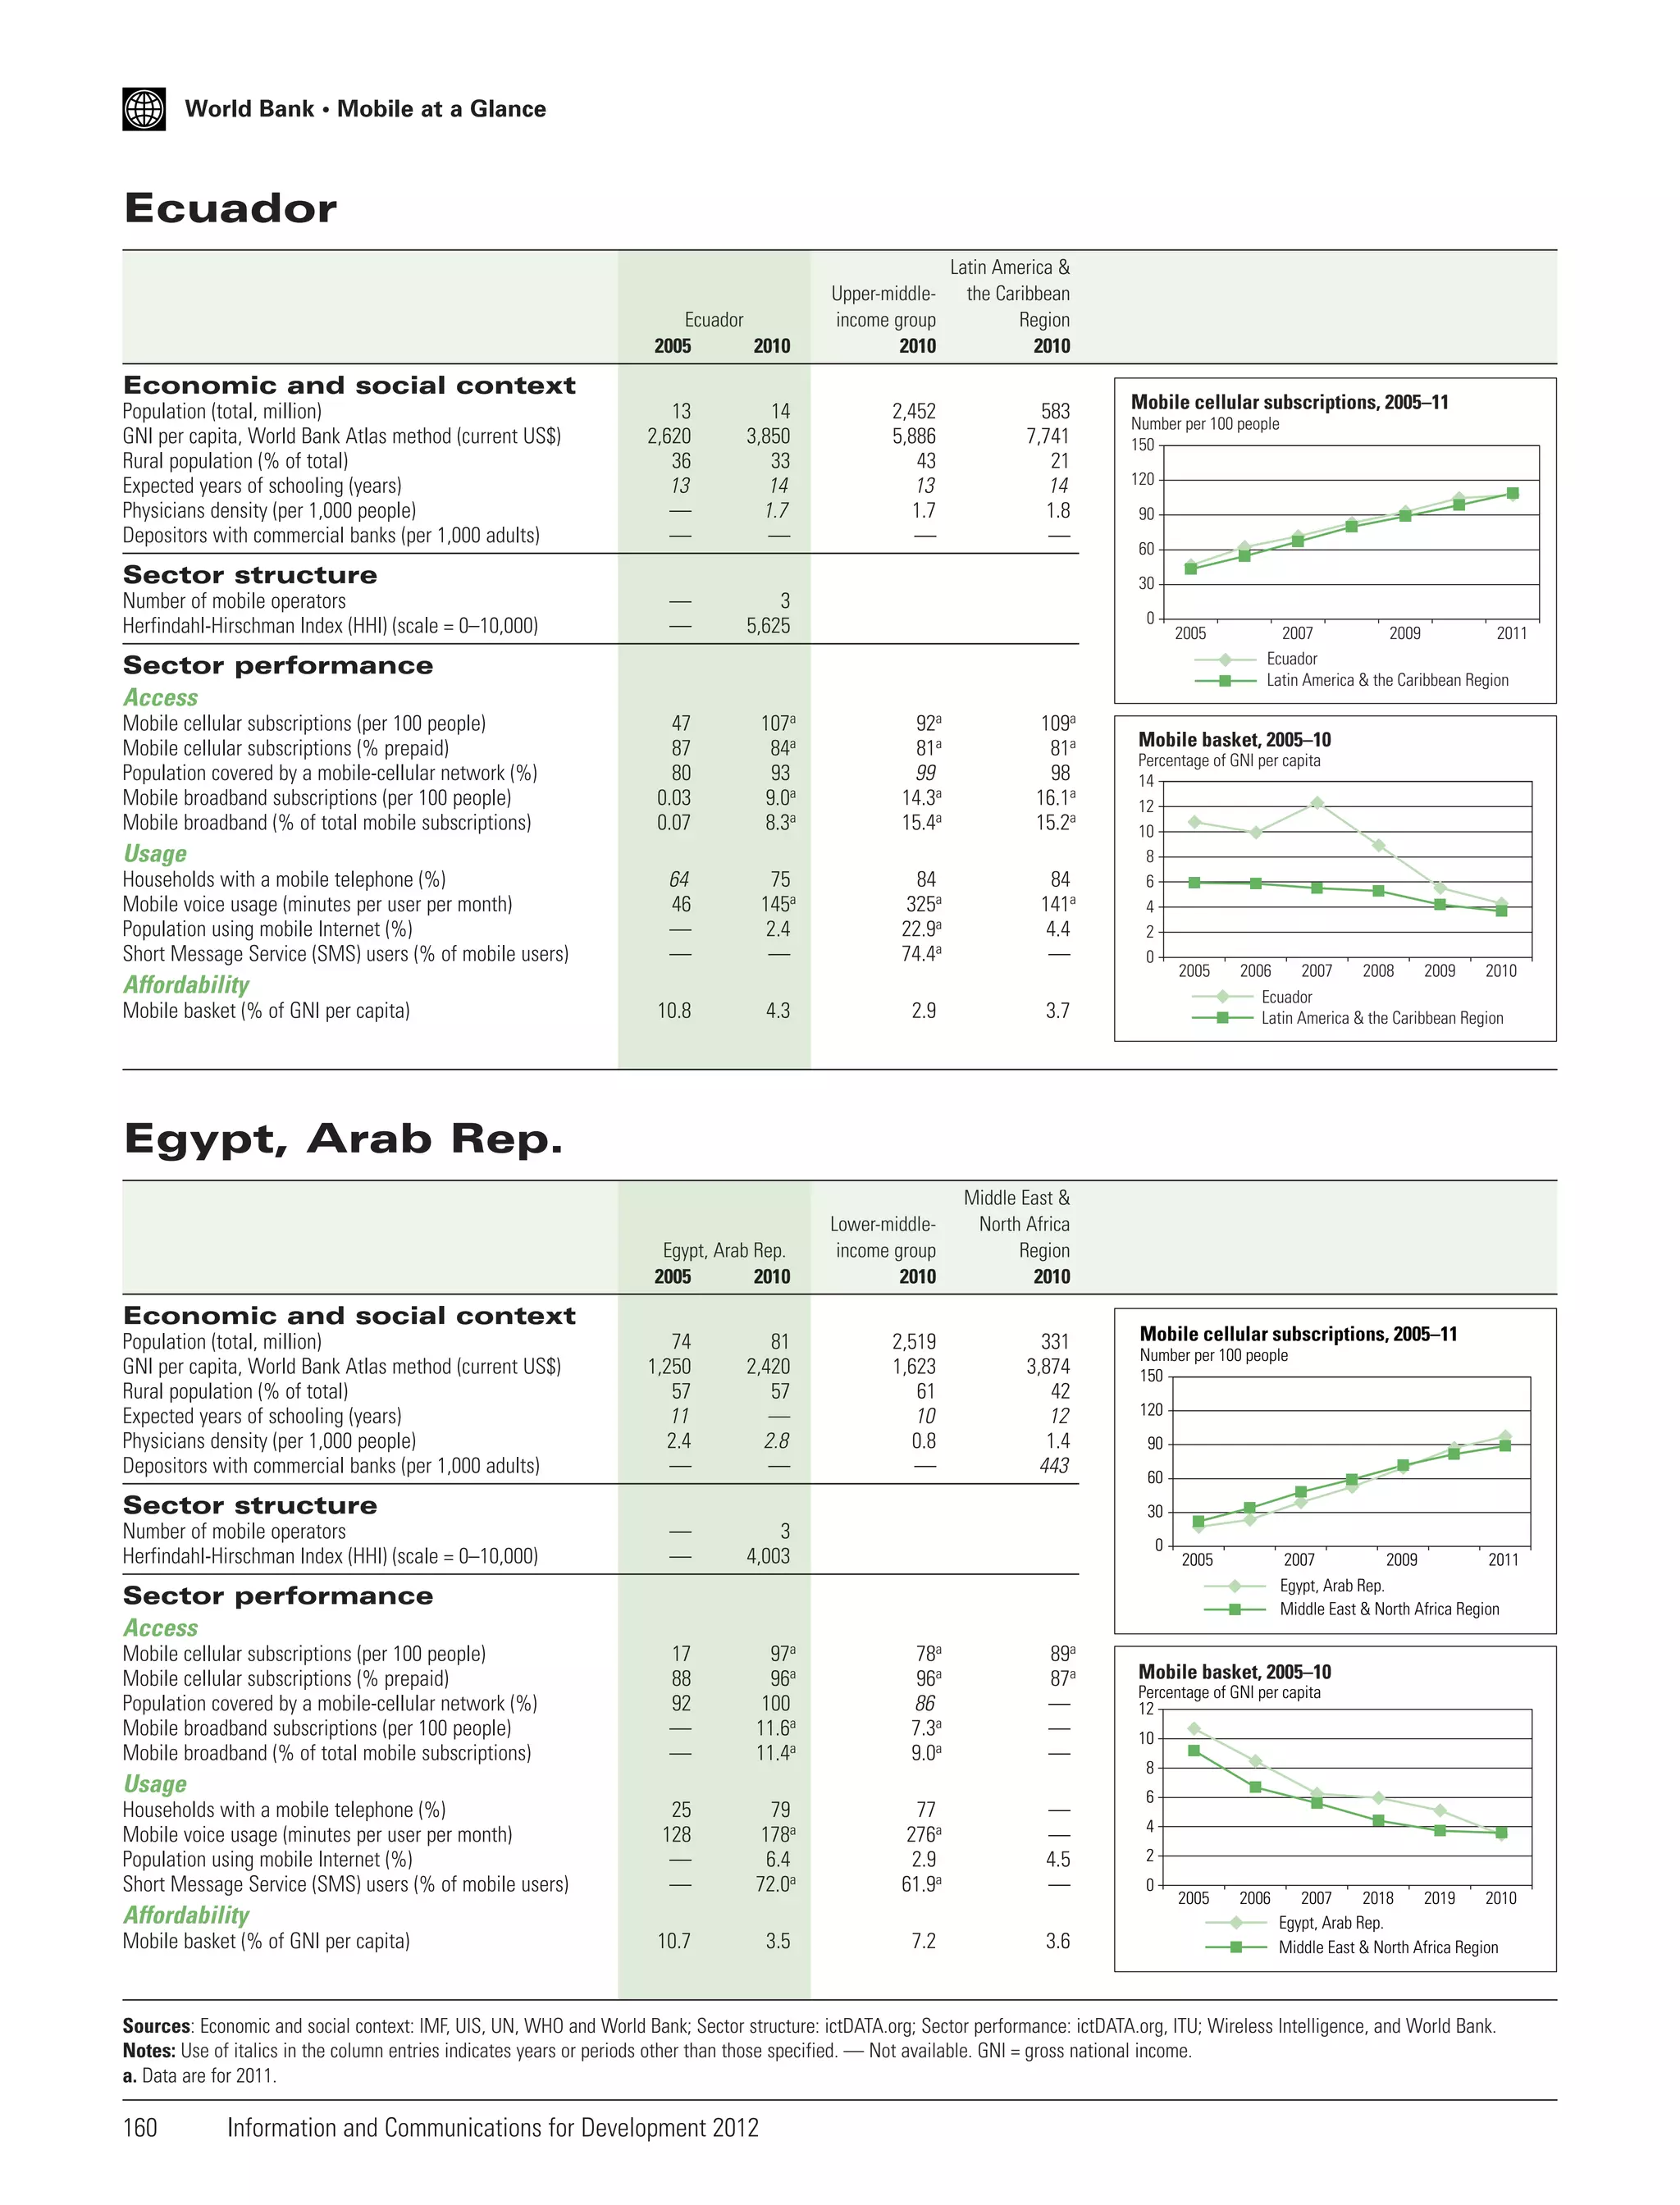
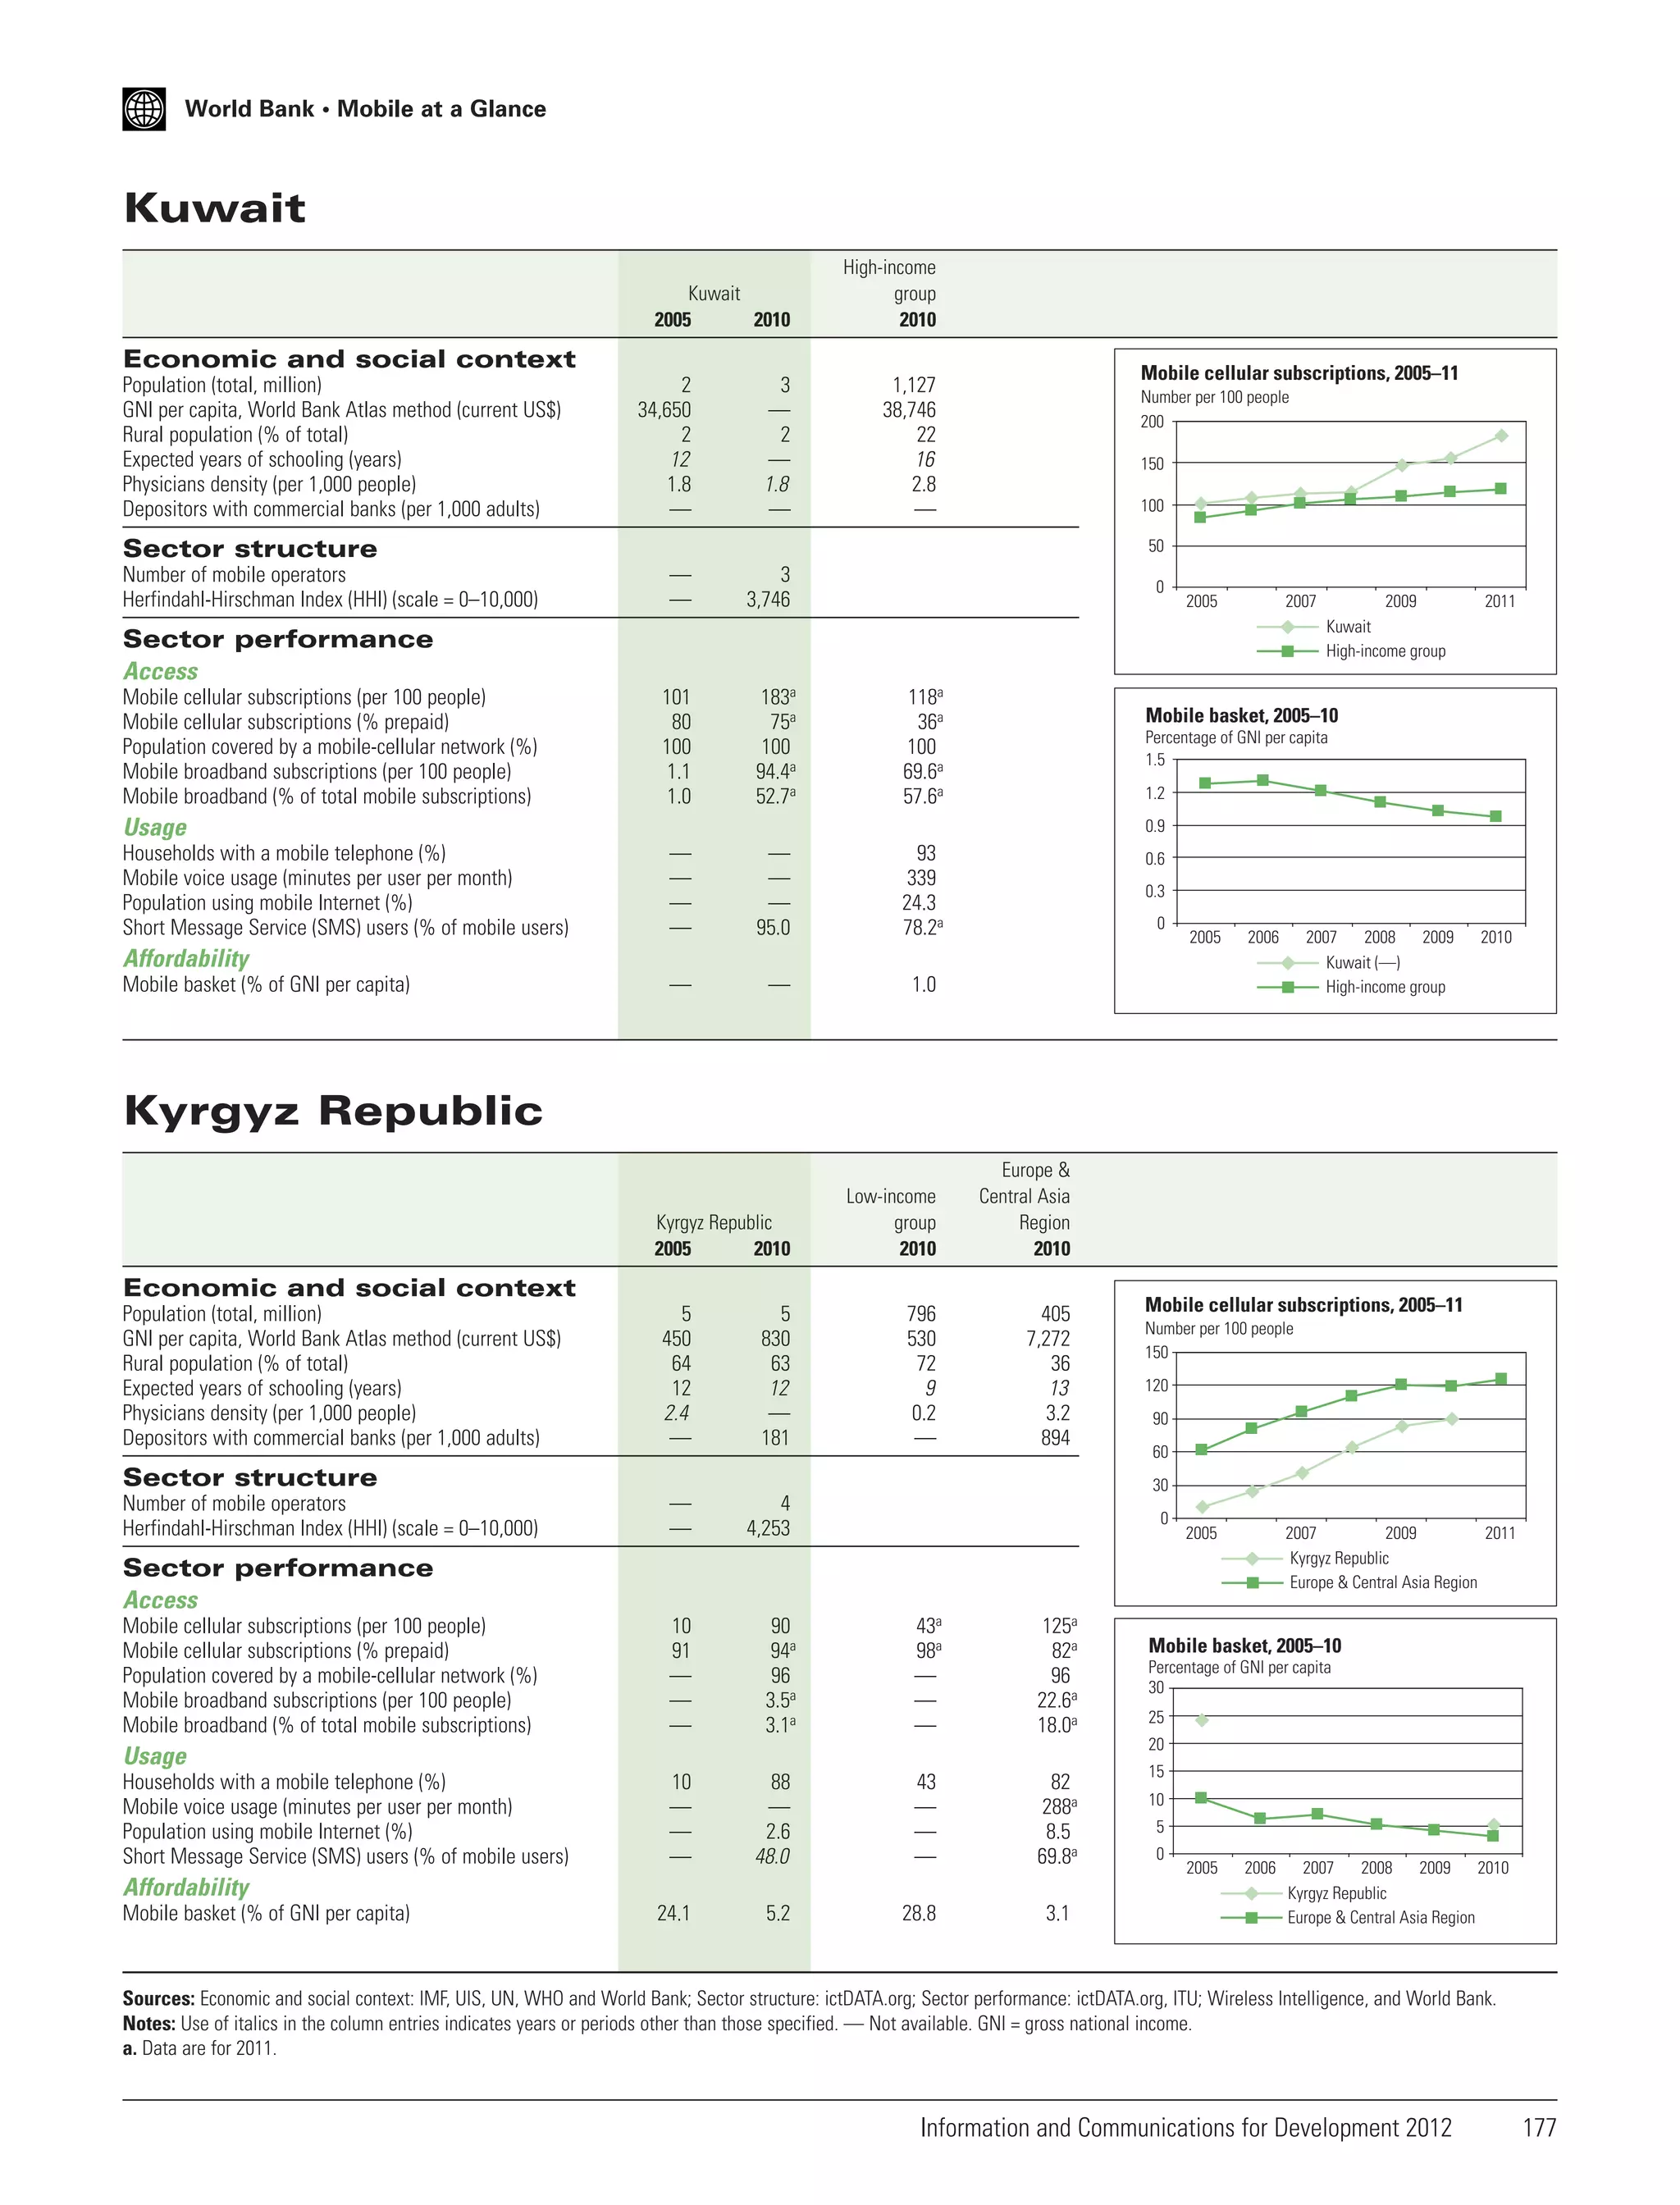
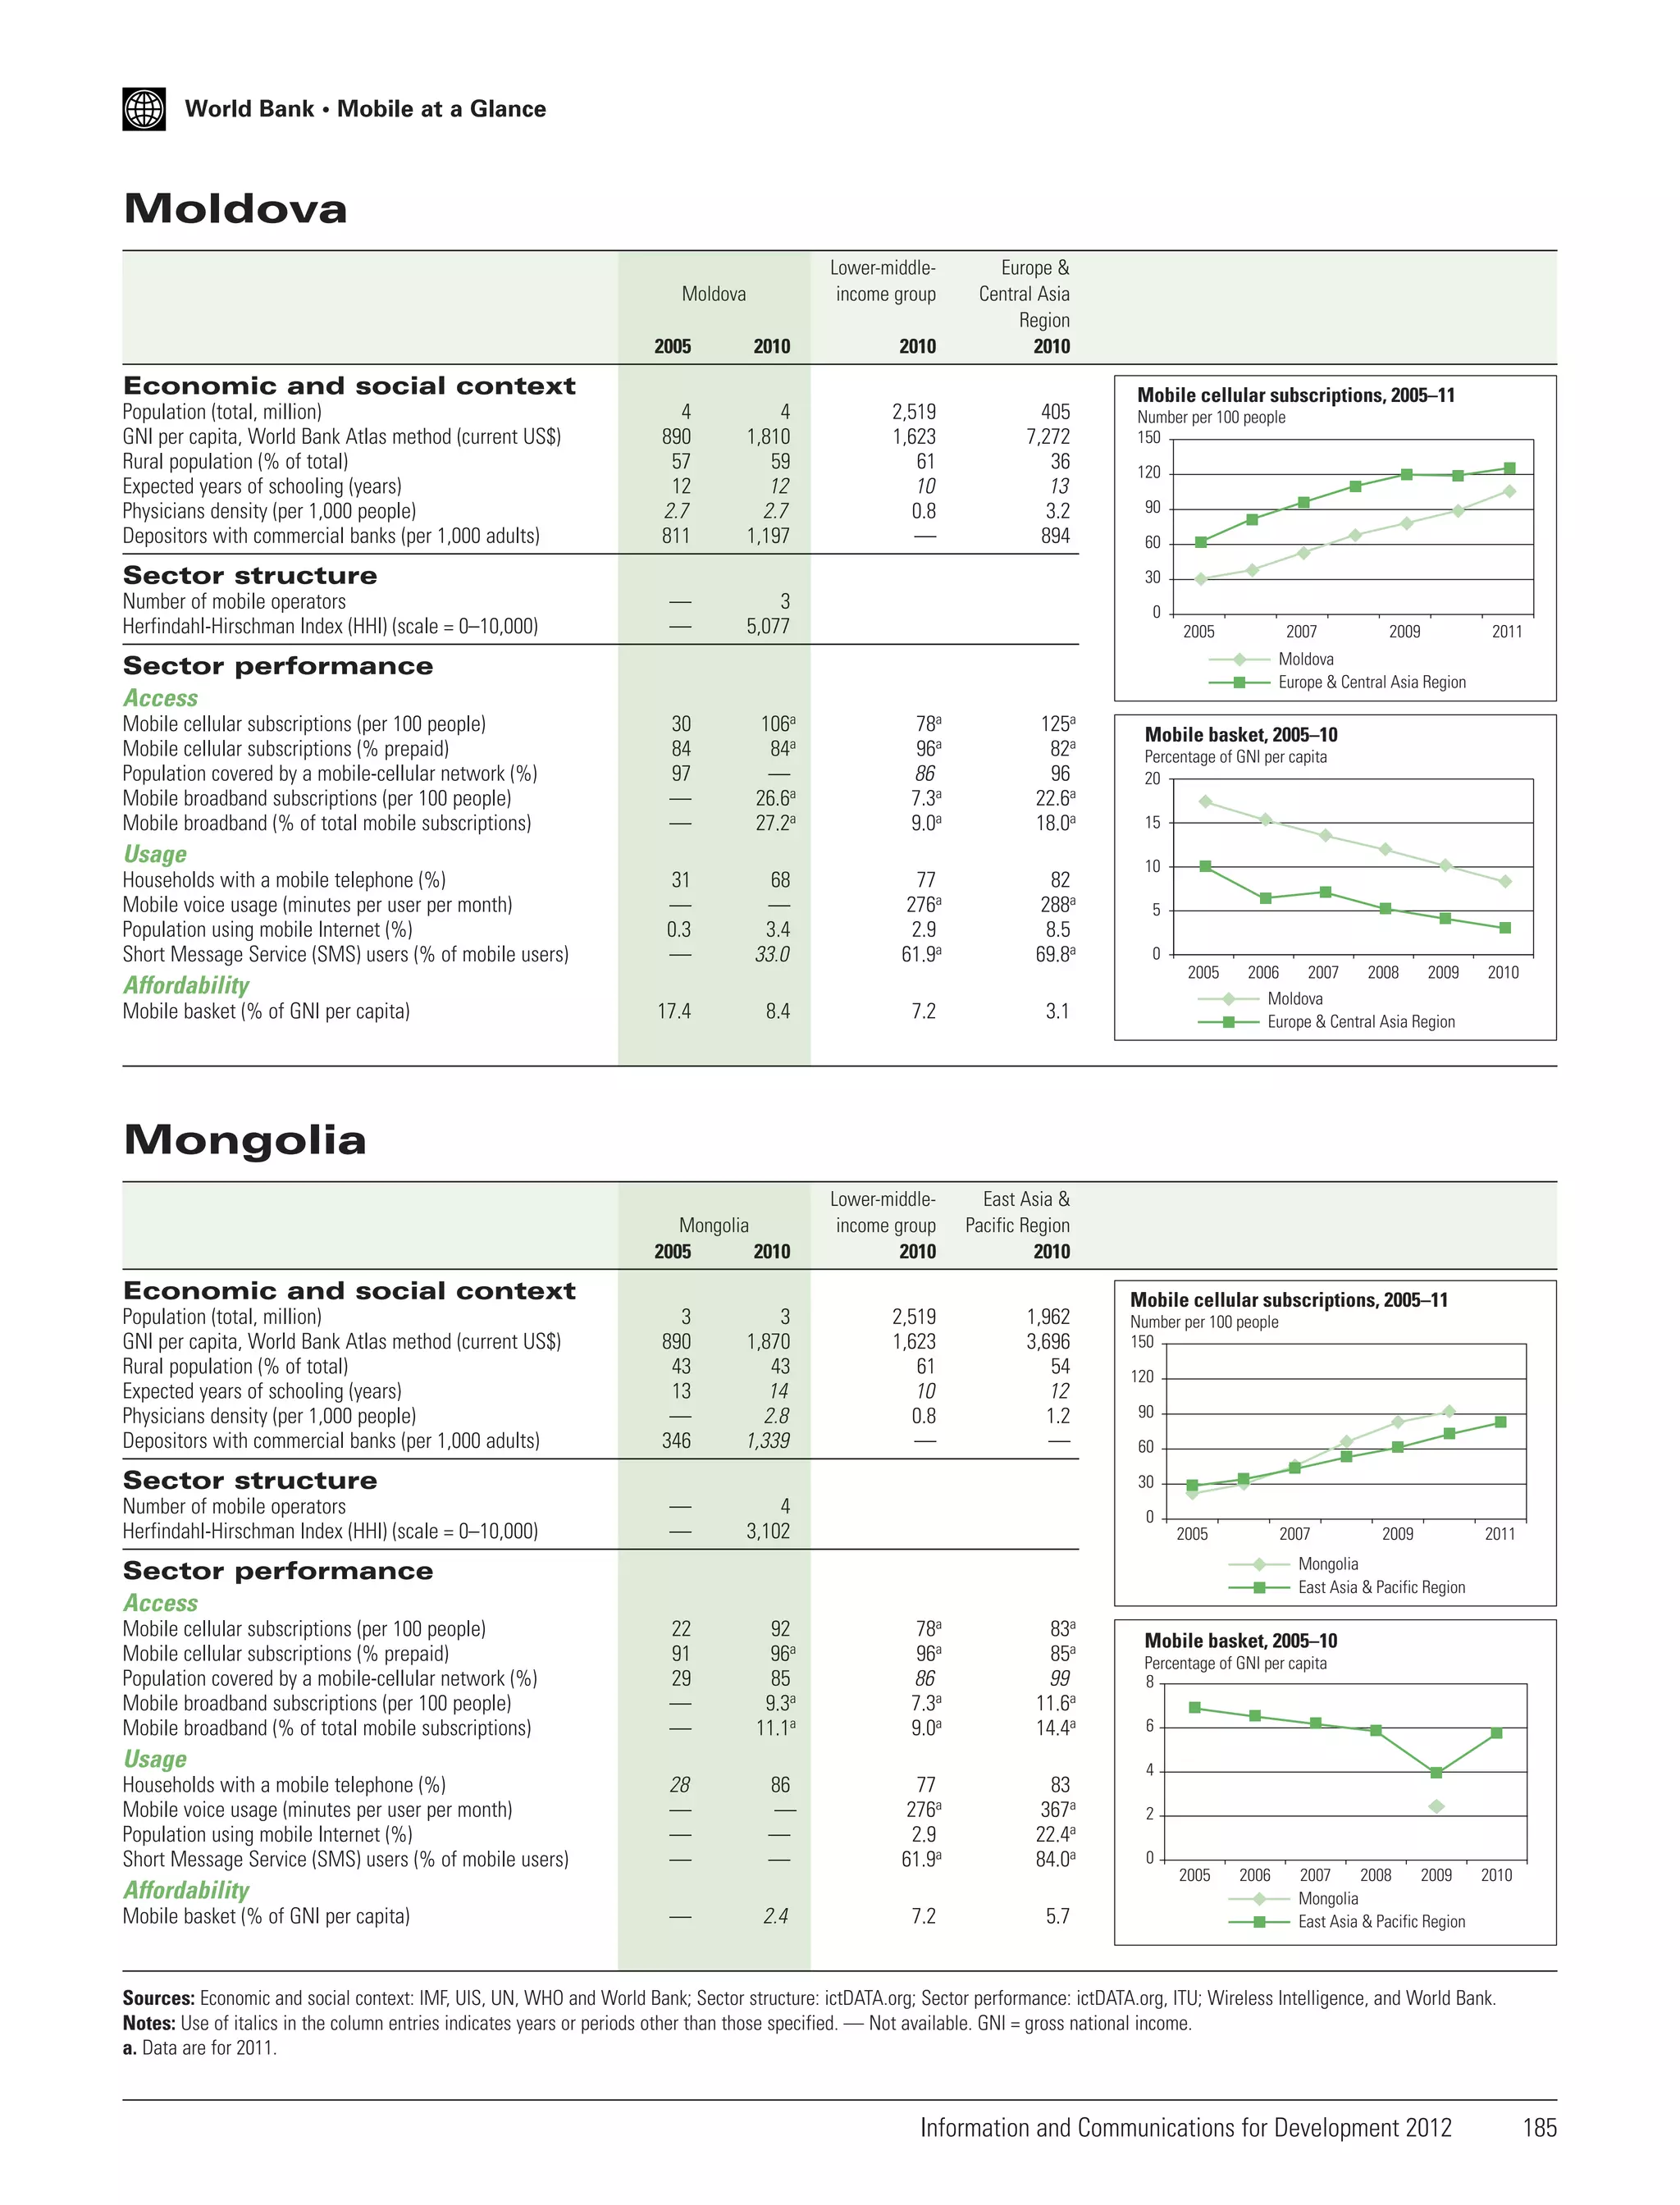
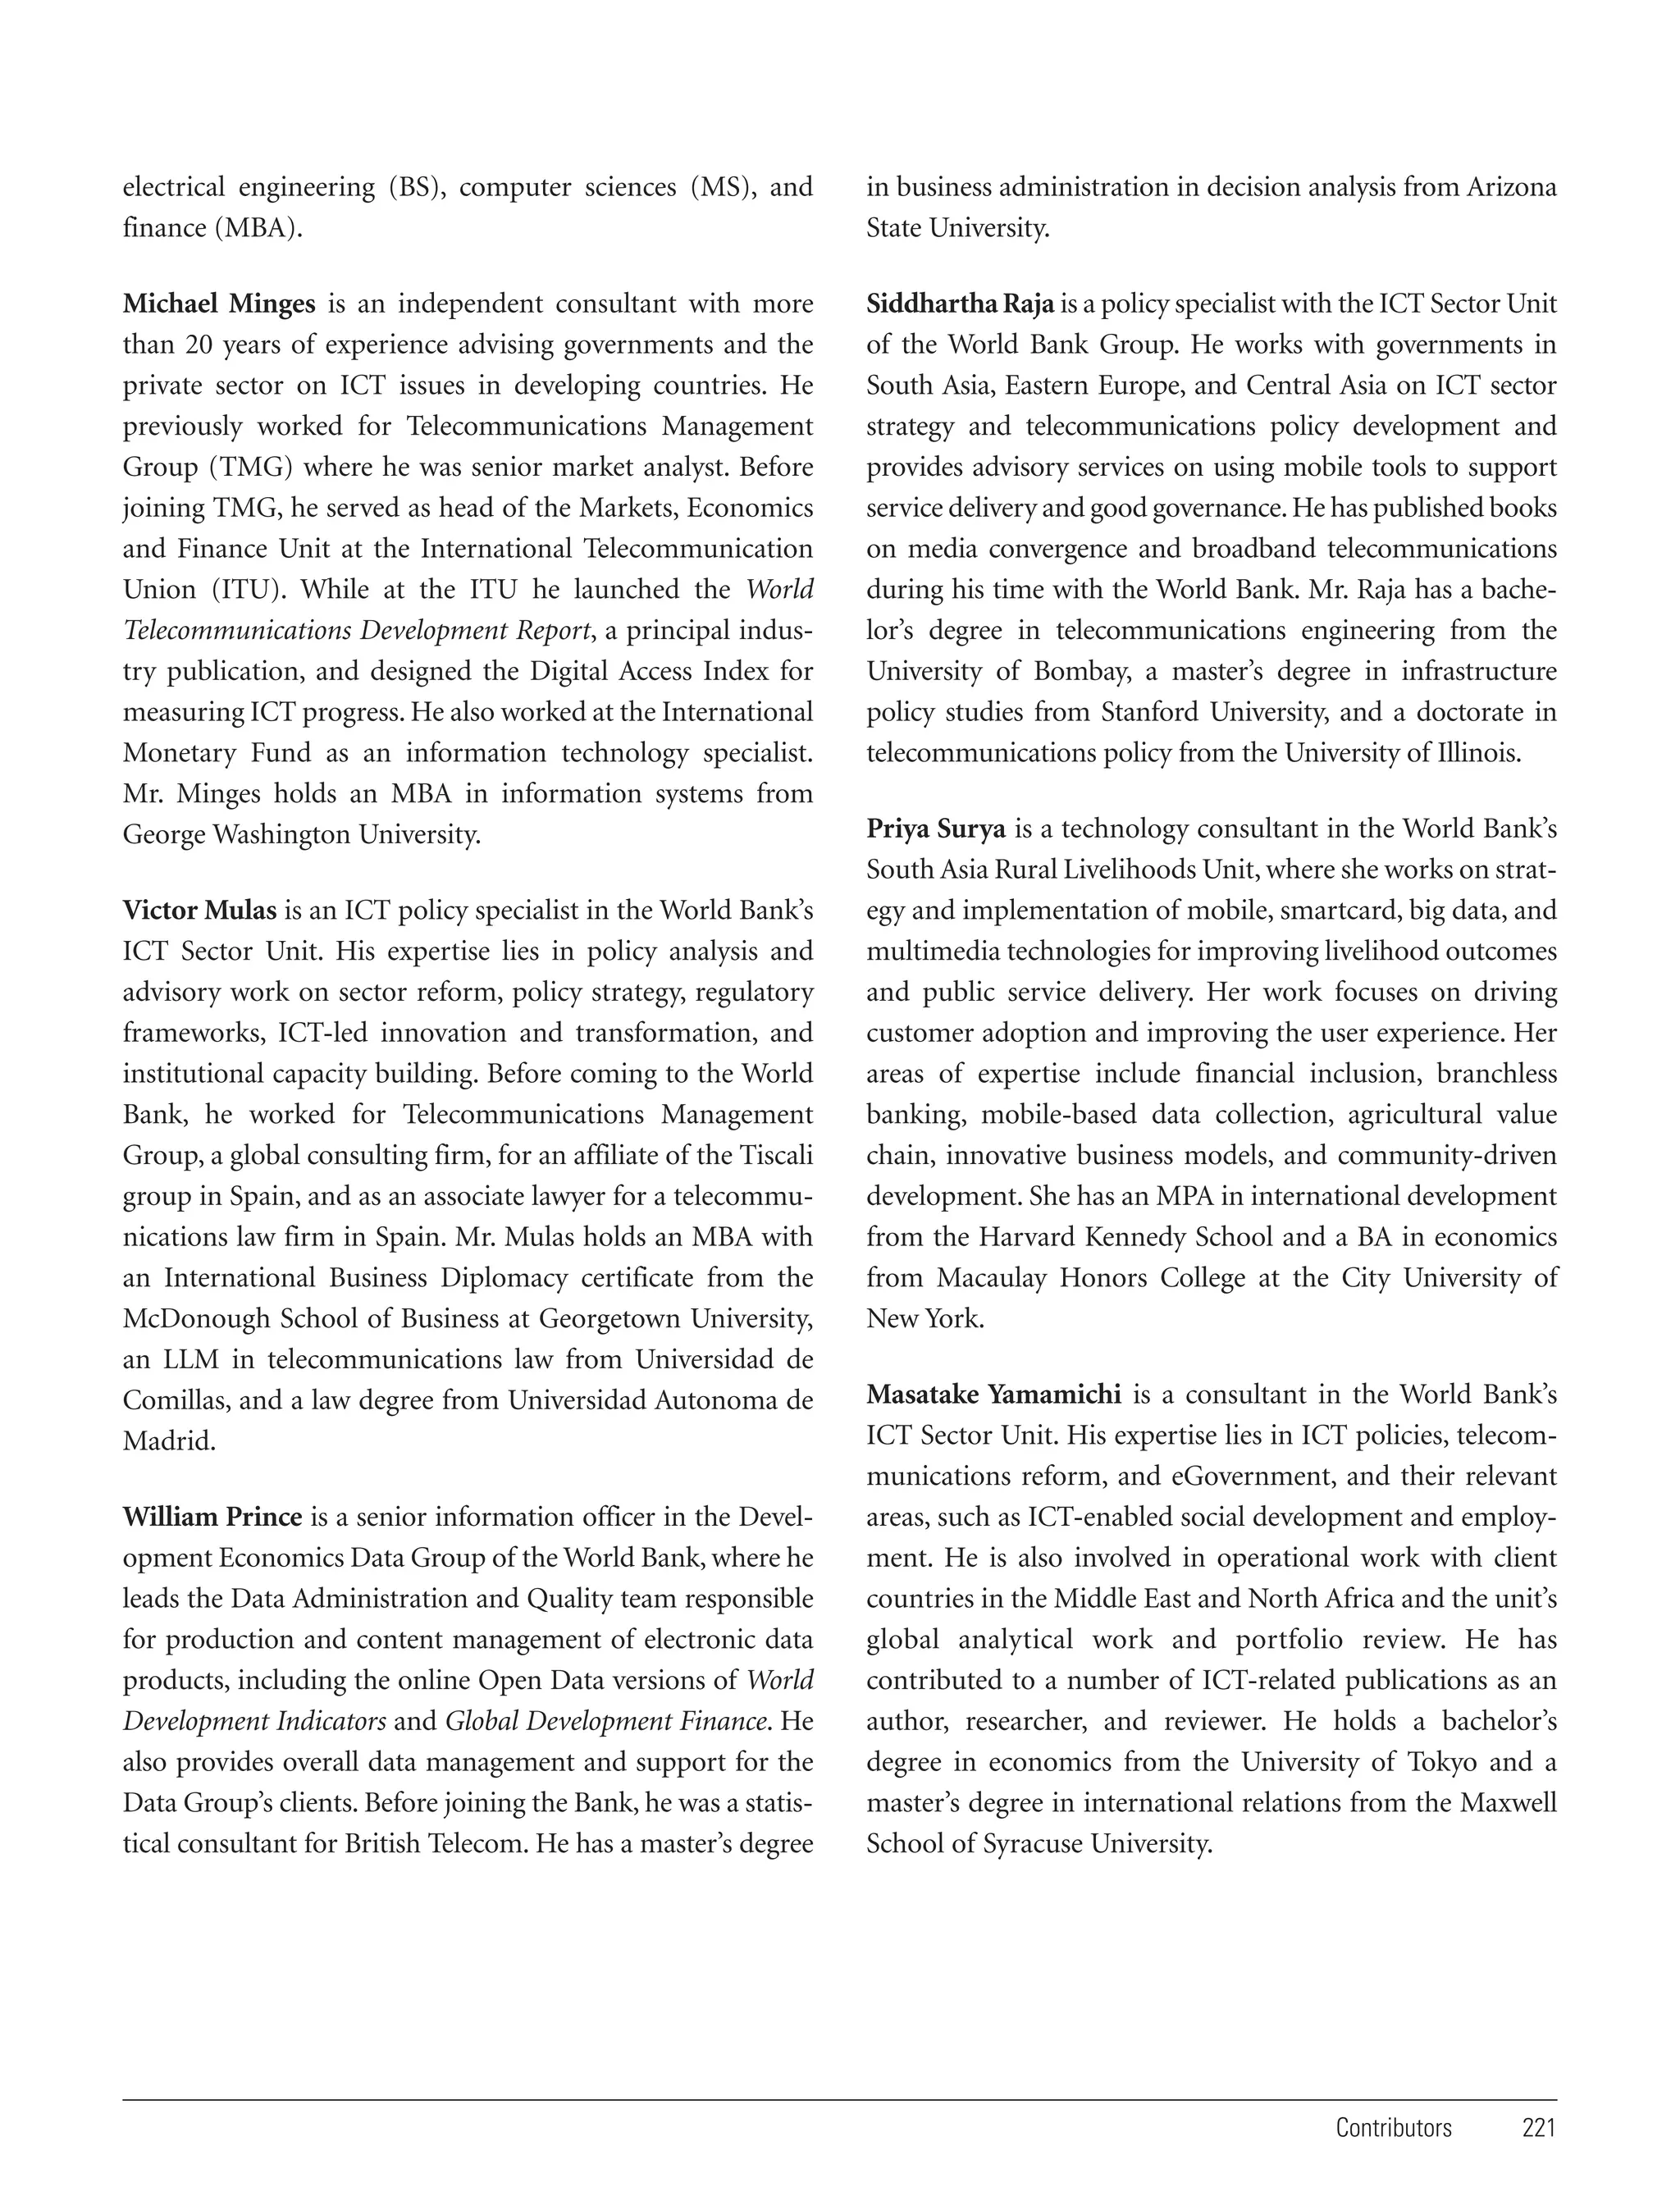
![Box 4.2 Using mobile money
Mobile money applications are typically small pieces of software embedded on a SIM card or
available over a mobile network. A customer can use an inexpensive mobile to send value to
someone else. To change this digital value into cash, a user simply visits a retail agent who
verifies the user’s identity and makes the switch. In this way, money can cross enormous
distances at the speed of a text message. Consider a young Tanzanian who has moved to Dar
es Salaam to find work. With mobile money, he can send regular, small payments to his family
at their rural home without needing to pay and trust a courier or take it himself. His family can
then exchange the digital value for cash at a local agent.
market floods with other families seeking to convert similar
assets to cash at the same time. Moreover, sending gold
bracelets or cash to a family or friend in need can be a risky
enterprise. Mobile money can be an accessible and convenient medium for the delivery of financial services and more
reliable than traditional, informal methods.
Benefits from scale
In some jurisdictions, mobile money has achieved critical
mass, so nonusers are encouraged to adopt the systems used
by their peers. When the poor are connected on a large scale,
they are able to use mobile money to improve their livelihoods. The best data available on this point comes again
from Kenya, where households with access to mobile money
were better able than those without to manage negative
shocks (including job loss, death of livestock, or problems
with harvests). Whereas households that did not use MPESA saw consumption fall by 6–10 percent on average, MPESA users were often able to fully absorb the shocks,
because they received more remittances and lost less to
transaction costs (Suri and Jack 2011). Evidence of such
“livelihood strategies” was also evident during the violence
following Kenya’s 2007 election, during which M-PESA
“became one of the only means through which [residents of
Nairobi’s informal Kibera settlement] could access cash”
(Morawczynski 2009). Even in less tumultuous times,
mobile money at scale can serve to meet the needs of the
poor: research in Kenya found that M-PESA was a useful
means to access cash. Often the poor lack fungible sources of
exchange such as cash, and through the network of cash
agents and people’s contacts willing to send value, mobile
64
Information and Communications for Development 2012
money allows many to get cash when and where they need it
(Stuart and Cohen 2011).
Mobile money can also prove commercially significant
for service providers, when it reaches scale. Although the
transaction fees that mobile money providers charge are
individually quite small, in total, they can represent an
important revenue source. For example, Safaricom, the
mobile operator that offers M-PESA, reported mobile
money revenues for the first half of 2011 of K Sh 7.9 billion
($90 million). In addition, cash agents may also gain
commercial benefit from the fees they receive.
Benefits from innovation
Improving the ability of the poor to transfer money is
certainly beneficial, but in isolation, mobile transfer ser vices do not capture the full potential of mobile money to
enhance financial inclusion. Early studies of South
African mobile money found that while it had the potential to advance financial inclusion, it had not increased
access to banking, especially compared with nontechnological efforts, such as a particular type of bank account
designed especially for the poor (Porteous 2007). In
Kenya, for example, the predominant use of M-PESA
is still sending money, although some people use it for
savings (Stuart and Cohen 2011). Access and use of more
sophisticated financial services such as savings, credit, and
insurance could prove far more beneficial to the poor. To
develop these services, businesses, governments, and
other institutions must innovate actively on top of the
payment services that are being deployed by mobile
money operators.7](https://image.slidesharecdn.com/random-140112120019-phpapp01/75/2012-84-2048.jpg)


This document is the 2012 report by the World Bank titled "Information and Communications for Development: Maximizing Mobile". It focuses on how mobile technologies are being used to promote development, especially in agriculture, health, financial services, and government. Some key findings include: - Mobile phones are transforming livelihoods by helping create new businesses and changing communication. Their potential is a challenge for governments, the private sector, and development community. - Mobile applications are improving access to information for farmers and traders, enhancing market access, and increasing efficiency in agricultural value chains. - mHealth via mobile phones shows promise in improving healthcare, though challenges around implementation and sustainability remain. - Mobile money has expanded financial inclusion, but issues around


![Coded Agents – with UiPath SDK + LangGraph [Virtual Hands-on Workshop]](https://cdn.slidesharecdn.com/ss_thumbnails/codedagentsdeck-251215155422-5497c599-thumbnail.jpg?width=640&height=640&fit=bounds)


