This document discusses identifying transcriptional start sites (TSSs) of human microRNAs (miRNAs) based on high-throughput sequencing data. It integrates cap analysis of gene expression (CAGE) tags, TSS Seq libraries, and H3K4me3 chromatin signature data to identify 847 human miRNA TSSs, including 70 TSSs of miRNA clusters. A machine learning-based Support Vector Machine (SVM) model is developed to systematically select representative TSSs for each miRNA. The TSS of the important human miRNA hsa-miR-122 is experimentally validated to demonstrate the effectiveness of the proposed resource for identifying human miRNA TSSs.
Prediction of mi-RNA related to late blight disease of potatoAnimesh Kumar
The document summarizes the process of predicting miRNAs related to late blight disease of potato using bioinformatics approaches. It discusses how miRNAs play an important role in host-pathogen interactions and regulates genes. The author proposes to identify potential pathogenic miRNAs and their targets in Solanum tuberosum in response to Phytophthora infestans infection using available EST sequences. A multi-step computational approach including screening ESTs, identifying pre-miRNAs, predicting secondary structures, and identifying targets is outlined. Relevant literature on plant miRNA prediction and P. infestans is also reviewed.
International Journal of Engineering Research and DevelopmentIJERD Editor
This document discusses a study that uses the ke-REM (ke-Rule Extraction Method) classifier to predict promoter regions in DNA sequences. The study evaluates the performance of ke-REM compared to existing promoter prediction techniques. ke-REM constructs rules based on attribute-value pairs from a dataset of 106 E. coli DNA sequences, each containing 57 nucleotides. The results show that ke-REM competes well with existing methods for identifying promoter regions in DNA.
Analytical Study of Hexapod miRNAs using Phylogenetic Methodscscpconf
MicroRNAs (miRNAs) are a class of non-coding RNAs that regulate gene expression.
Identification of total number of miRNAs even in completely sequenced organisms is still an
open problem. However, researchers have been using techniques that can predict limited
number of miRNA in an organism. In this paper, we have used homology based approach for
comparative analysis of miRNA of hexapoda group .We have used Apis mellifera, Bombyx
mori, Anopholes gambiae and Drosophila melanogaster miRNA datasets from miRBase
repository. We have done pair wise as well as multiple alignments for the available miRNAs in
the repository to identify and analyse conserved regions among related species. Unfortunately,
to the best of our knowledge, miRNA related literature does not provide in depth analysis of
hexapods. We have made an attempt to derive the commonality among the miRNAs and to
identify the conserved regions which are still not available in miRNA repositories. The results
are good approximation with a small number of mismatches. However, they are encouraging and may facilitate miRNA biogenesis for hexapods.
This document describes MORPH-R, a tool for predicting missing genes in biological pathways. MORPH-R is available both as a web server and standalone software. It uses the MORPH algorithm to rank candidate genes for their likelihood of participating in or affecting biological pathways of interest. MORPH-R was tested on potato data and achieved high performance, identifying novel candidate genes for potato pathways and gene ontology categories. The tool allows users to analyze pathways in tomato, Arabidopsis, rice and potato, and can be customized to analyze additional organisms by adding new gene expression and interaction network data.
This document summarizes research on analyzing differential miRNA-mRNA co-expression networks in colorectal cancer. The researchers analyzed paired expression data from cancer and normal tissues to identify changes in interactions. They found that cancer networks have decreased connectivity and identified differentially connected genes, including known cancer genes. Pathway analysis revealed an alteration in colorectal cancer tissues in the interplay between miRNAs and the eukaryotic translation initiation factor 3 complex, which is important for translation. Certain miRNAs were also identified as having many differentially co-expressed target mRNAs.
The document summarizes research presented at the CNCP 2010 conference. It describes work in several areas of proteomics research including fragmentation analysis, labeling strategies, de novo sequencing, identification, label-free quantification, database construction, data quality control, data processing platforms, glycoproteomics, and proteogenomics. Specific projects are mentioned that improved peptide identification, developed in vivo termini amino acid labeling, performed de novo sequencing of peptides from unknown genomes, optimized peptide mass fingerprinting for protein mixtures, detected post-translational modifications, and more.
This document discusses the collaboration between molecular medicine and bioinformatics. It defines bioinformatics as the science of storing, retrieving, and analyzing large amounts of biological data, cutting across biology, computer science, and mathematics. It gives examples of how bioinformatics can be applied in molecular medicine for studying pathogenicity, therapeutic targets, molecular diagnostics, and host-pathogen interactions. The document also outlines how bioinformatics supports molecular medicine through genome analysis, database and tool development, and describes some catalysts like genome sequencing that have expanded bioinformatics.
The document describes a new database called ComiRNet that uses an integrative data-mining approach to discover microRNA-gene regulatory networks. It uses a semi-supervised learning method called HOCCLUS2 to extract overlapping biclusters from predicted and validated miRNA-mRNA interactions. These biclusters represent potential regulatory networks. The database contains over 5 million predicted interactions between miRNAs and mRNAs organized into 15 hierarchical levels of biclusters. ComiRNet aims to help elucidate miRNA functional roles and mechanisms in biological processes.
An expression meta-analysis of predicted microRNA targets identifies a diagno...Yu Liang
This study identifies a 17-gene expression signature that can accurately classify lung adenocarcinoma and squamous cell carcinoma, the two major histological subtypes of lung cancer. The signature was developed by predicting microRNA target genes, filtering them based on gene ontology terms and ability to classify cancers, and analyzing gene expression data from multiple datasets. When validated in independent datasets, the signature correctly classified 87% of adenocarcinoma and 82% of squamous cell carcinoma samples on average. Expression of the signature also showed potential for early lung cancer detection in bronchial epithelial cells from smokers.
This document summarizes a scientific article about overcoming limitations in sample material for miRNA biomarker discovery. It discusses how miRNAs have potential as diagnostic, prognostic, and theranostic biomarkers but valuable sample types like laser-captured samples or circulating tumor cells often have insufficient amounts of material for full miRNA profiling. The article presents an integrated PCR-based system that reduces the sample amount needed for full miRNA profiling by several orders of magnitude, enabling detailed analysis of even the smallest samples. This advance opens up new possibilities for biomarker development using hard-to-obtain sample types.
This study used mass spectrometry to validate genome annotations of nine diverse mycobacteriophages and identify their expressed proteins during infection of Mycobacterium smegmatis. Peptides matching both characterized and uncharacterized putative phage proteins were detected, validating the genome annotations. Over 100 peptides were identified for some phages, including proteins for virion structure, DNA replication, and host lysis. The study demonstrates mass spectrometry can rapidly validate phage genome annotations and identify expressed proteins, aiding characterization of phage-host interactions.
This document describes a bioinformatics approach for prioritizing disease-causing human mitochondrial DNA mutations. It uses a "disease score" that averages the probabilities from six pathogenicity prediction methods to determine if a mutation is deleterious or benign. The approach was trained on 53 known disease-associated mutations and tested on 1872 observed mutations, achieving a disease score cutoff of 0.4311. Mutations meeting criteria of being rare, conserved, predicted pathogenic and occurring at low variability sites were prioritized. When tested on 21 tumor samples, 8/268 prioritized nonsynonymous mutations were tumor-specific, confirming the approach's ability to identify potentially pathogenic mutations.
The document provides information about various bioinformatics tools for DNA sequence analysis. It describes tools for finding protein coding regions like GeneMark and GENSCAN. It discusses tools for predicting promoters like SoftBerry Promoter and Promoter 2.0. It outlines how Tandem Repeat Finder can detect tandem repeats and how RepeatMasker can mask interspersed repeats in a sequence. It also discusses UTRScan for finding UTR locations and CpG Islands for detecting CpG islands. For each tool, it provides the procedure and interpretation of sample results.
This document discusses using hierarchical clustering algorithms to mine pharmacogenomic data from a clinical data warehouse containing both genomic and clinical trial data. It describes hierarchical clustering as an approach to analyze gene expression microarray data by grouping single profiles into clusters in a tree structure. Six main hierarchical clustering algorithms are outlined that differ in how they calculate distances between clusters. The goal of pharmacogenomic data mining is to discover knowledge that can identify the most effective and least toxic drugs for individuals based on their genetic makeup and disease.
Structural genomics aims to determine the 3D structure of all proteins in a genome. It uses high-throughput methods like X-ray crystallography and NMR on a genomic scale. This allows determination of protein structures for entire proteomes. It provides insights into protein function and can aid drug discovery by identifying potential drug targets like in Mycobacterium tuberculosis. Structural genomics leverages completed genome sequences to clone and express all encoded proteins for structural characterization.
Comparing Genetic Evolutionary Algorithms on Three Enzymes of HIV-1: Integras...CSCJournals
In this work, we utilized Quantitative Structure-Activity Relationship (QSAR) techniques to develop predictive models for inhibitors of the HIV-1 enzymes Integrase, HIV-Protease, and Reverse Transcriptase. Each predictive model was composed of quantitative drug characteristics that were selected by genetic evolutionary algorithms, such as Genetic Algorithm (GE), Differential Evolutionary Algorithm (DE), Binary Particle Swarm Optimization (BPSO), and Differential Evolution with Binary Particle Swarm Optimization (DE-BPSO). After characteristic selection, each model was tested with machine-learning algorithms such as Multiple Linear Regression (MLR), Support Vector Machine (SVM), and Multi-Layer Perceptron neural networks (MLP/ANN). We found that a combination of DE-BPSO combined with Multi-Layer Perceptron produced the most accurate predictive models as measured by R2, the statistical measure of proportion of variance in prediction values, and root-mean-square-error (RMSE) of prediction values compared to observed values. As for the models themselves: the best predictors for Integrase inhibitor included mass-weighted centred Broto-Moreau autocorrelation values, Moran autocorrelations, and eigenvalues of Burden matrices weighted by I-states; the best predictors for HIV-Protease inhibitors included the second Zagreb index value, the normalized spectral positive sum from Laplace matrix, and the connectivity-like index of order 0 from edge adjacency mat; and the best predictors for Reverse Transcriptase inhibitors included the number of hydrogen atoms, the molecular path count of order 7, the centred Broto-Moreau autocorrelation of lag 2 weighted by Sanderson electronegativity, the P_VSA-like on ionization potential, and the frequency of C – N bonds at topological distance 3.
This document describes a bioinformatics tool that predicts gene expression in cancer using copy number alterations and methylation data as predictors in a linear model. The tool was created using data from The Cancer Genome Atlas and the R programming language. It analyzes specific cancers to identify oncogenes and tumor suppressor genes that are relevant to those cancers, and determines which genetic or epigenetic factors drive the expression of those genes. The tool provides comprehensive analysis of individual genes and ranks their relevance to different cancers. It allows researchers to efficiently understand disease-specific gene expression and identify additional genes involved in cancer.
This document provides an introduction to the field of bioinformatics. It defines bioinformatics as a branch of science that uses computer technology to analyze and integrate biological information that can be applied to gene-based drug discoveries. It discusses the emergence of bioinformatics due to the desire to understand how genetic structure affects traits. It also outlines some common applications of bioinformatics like drug design, gene therapy, and microbial genomic analysis. Finally, it provides examples of some bioinformatics tools, databases, and centers in India.
This document discusses approaches for identifying somatic mutations from cancer sequencing data using multiple mutation callers. It compares several popular mutation callers, explores a simple consensus approach, and proposes an integrated ensemble approach. The ensemble approach applies multiple callers, filters using GATK, and assigns a ranking score to variants based on validation rates to generate a high-confidence list of somatic mutations. This strategy aims to leverage the strengths of different callers to improve accuracy over any single caller.
Genomics, proteomics, and bioinformatics are important fields that help advance drug development. Genomics studies entire genomes and can identify disease-associated genes. Proteomics identifies the proteins expressed in a sample and how they differ between healthy and diseased tissues. Bioinformatics uses computers to store and analyze biochemical and biological data, especially related to genomics. These fields help discover new drug targets, validate existing targets, select drug candidates, study mechanisms of action and toxicity. Integrating omics data from genomics to proteomics provides a more comprehensive understanding of biological systems compared to individual fields alone.
This document provides an overview of bioinformatics and some of its key applications. It discusses how bioinformatics is an interdisciplinary field that uses computer science, statistics and other approaches to analyze large amounts of biological data. It notes that bioinformatics has become necessary due to the explosion of genomic data from projects like the Human Genome Project. Some of the goals and uses of bioinformatics mentioned include uncovering biological information from data, applications in molecular medicine, agriculture and environmental science. The document also provides brief descriptions of structural bioinformatics, common biological databases, MASCOT database searching, and scoring schemes used in bioinformatics.
Presentation for Network Biology SIG 2013 by Thomas Kelder, Bioinformatics Scientist at TNO in The Netherlands. “Functional Network Signatures Link Anti-diabetic Interventions with Disease Parameters”
Bioinformatics is the application of information technology to analyze biological data. This document provides an overview of bioinformatics, including publicly available genome sequences from 1998, promises for applications in medicine and biotechnology, the need for bioinformaticians to analyze growing biological databases, common bioinformatics tasks like sequence analysis and molecular modeling, and important databases like GenBank, SwissProt, and NCBI.
Protein microarrays are high-throughput methods that allow researchers to study protein interactions and functions on a large scale. There are three main types of protein microarrays: analytical microarrays use antibodies to detect specific proteins in samples; functional microarrays examine protein-protein and other molecular interactions; and reverse-phase protein microarrays profile protein expression levels and post-translational modifications by immobilizing cell or tissue lysates. Protein microarrays have applications in diagnostics, proteomics, studying protein functions, and analyzing antibodies.
This document summarizes a study that integrated pathway and gene expression data from over 13,000 samples across 17 platforms to perform multi-label classification of 48 diseases. Pathway activity scores were calculated for each sample and used as features for classification, along with sample labels determined through manual dataset analysis. Classification was performed using multiple algorithms and validated through cross-validation and comparison to previous studies. Performance was improved over previous work, as shown by increased recall and precision. Relationships between diseases and pathways were also modeled in a network graph.
Bioinformatics is the use of computers for storage, retrieval, manipulation, and distribution of information related to biological macromolecules such as DNA, RNA, and proteins. It involves developing computational tools and databases to analyze biological data. Key areas include sequence analysis, structural analysis, functional analysis, biological databases, sequence alignment, protein structure prediction, molecular phylogenetics, and genomics. The goals are to better understand living systems at the molecular level through computational analysis of biological data.
Efficiency of Using Sequence Discovery for Polymorphism in DNA SequenceIJSTA
This document summarizes a research paper that proposes an effective sequence pattern discovery method to find polymorphic motifs in human DNA sequences to detect genetic medical conditions. The method uses three algorithms - LDK, HVS, and MDFS. It aims to identify disease-causing sequences, like those related to Ebola, by finding matching patterns in polymorphic DNA sequences. The position scrolling matrix is used to report test results of sequence pattern matching.
This document summarizes a database called miRvar that comprehensively catalogs genetic variations in human microRNA (miRNA) loci. The database was created by manually curating variations from public databases and literature. It uses the Leiden Open Variation Database platform and provides gene pages for each miRNA with known variations. The document describes the standardized nomenclature used for miRNAs and how a computational pipeline was developed to predict potential functional effects of variations on miRNA biogenesis and targeting of mRNAs. This is presented as the first comprehensive effort to catalog and analyze genomic variations in miRNA loci.
This document summarizes the underlying tensions between Japan, China, and South Korea related to territorial disputes and differing historical interpretations. Rising nationalism in the countries has exacerbated long-standing conflicts over islands and how to address Japan's World War II legacy. Failure to manage these issues risks undermining peace and cooperation in Northeast Asia as regional power shifts occur. Practical steps like joint resource management, people-to-people exchanges, and regional institutions could help address disputes and build confidence.
1) Mice lacking the gene encoding miR-122a (Mir122a-/- mice) developed steatohepatitis, fibrosis, and hepatocellular carcinoma at a high frequency and in a sex-dependent manner similar to humans.
2) Mir122a-/- mice exhibited impaired lipid metabolism including reduced expression of the microsomal triglyceride transfer protein MTTP, contributing to steatosis.
3) Restoring MTTP or miR-122a expression in Mir122a-/- mice reduced disease manifestations by reversing steatosis, inflammation, and fibrosis and improving liver function.
This document summarizes a study investigating the role of microRNA-122 (miR-122) in regulating intrahepatic metastasis of hepatocellular carcinoma (HCC). The study found that miR-122 expression is significantly downregulated in HCC tumors with intrahepatic metastasis. Restoring miR-122 expression in metastatic HCC cell lines reduced in vitro migration, invasion, and tumor growth in vivo. Computational analysis identified multiple target genes of miR-122, including ADAM17, which was shown to be involved in metastasis. Silencing ADAM17 had similar effects as restoring miR-122, reducing in vitro and in vivo measures of metastasis. The study suggests that miR-122 acts as a tumor suppressor
The document summarizes a student's hospital preceptorship experience at Burjeel Hospital in Abu Dhabi. It provides details about the hospital's location, vision and mission, and medical records department organizational chart. It describes the student's weekly work, which involved entry of newborn documents, medical records assembly and analysis, coding, and releasing medical reports. The student learned the importance of time management, hard work, cooperation, and respect. Positives included easy assigned work and welcoming staff, while negatives were staff busyness and lack of planning. The student suggests improved planning and organization.
Do Maternity Policies in the UK in practice enable and empower women to make ...Claire Carey
This chapter provides a historical overview of maternity policy development in the UK from the 1940s onwards. Key policies and reports are discussed, including the introduction of the NHS in 1948, the Cranbrook Report in 1959, and the influential Peel Report in 1970 which recommended all births take place in hospitals. Criticism of medicalization of birth and lack of women's voices in policy led to advocacy groups campaigning for informed choice. Later reports in the 1980s reinforced hospital birth recommendations but alternative views calling for less intervention and empowering women were also emerging. The analysis sets the context for understanding women's experiences within the system.
Arnaldo Citterio is an Italian national with over 30 years of experience in medical device development and manufacturing, quality assurance, and regulatory compliance. He currently works as a Standards Compliance Team Coordinator and Senior Quality Engineer at Flextronics Design Srl in Milan, Italy. Previous roles include Technical Services Responsible, Quality Responsible, and Certification Responsible at various companies in Italy. He has extensive expertise in European and international medical device standards including ISO 13485, IEC 60601, and the ISO 11608 series.
Coeficiente de correlacion de pearson y spermanalmedo95
Este documento explica los coeficientes de correlación de Pearson y Spearman. El coeficiente de Pearson mide la relación lineal entre dos variables cuantitativas, mientras que el coeficiente de Spearman puede usarse cuando las variables están en escala ordinal. Ambos coeficientes oscilan entre -1 y 1, donde valores cercanos a cero indican poca correlación y valores cercanos a 1 o -1 indican alta correlación positiva o negativa respectivamente.
The prime responsibility of the fuel pump is to transfer vehicle's fuel from the tank to the engine. And if the pump fails to do so, the vehicle may not run properly. This problem in your car leads to many other major problems. So you must learn how to diagnose this fuel pump problem easily. Check the slides here to know the diagnosing processes.
Characterization of microRNA expression profiles in normal human tissuesYu Liang
This document describes a study that characterized the expression profiles of microRNAs (miRNAs) in 40 normal human tissues. The researchers used quantitative real-time PCR to measure the expression levels of 345 miRNAs. They found that tissues from similar anatomical locations or with related physiological functions tended to cluster together based on their miRNA expression profiles. Many miRNAs showed exclusive or preferential expression in certain tissue types. The genomic locations of miRNAs also correlated with their expression patterns, as miRNAs located near each other on chromosomes often showed coordinated expression. The study provided a global view of miRNA tissue distribution and their potential roles in regulating normal tissue physiology.
This document describes a study that identified microRNAs (miRNAs) in paprika (Capsicum annuum) through analysis of expressed sequence tags (ESTs). The researchers obtained 33,311 paprika ESTs from databases, removed redundancy, and used bioinformatics tools to predict 85 miRNAs. Thirteen of these miRNAs showed similarity to known plant miRNAs. Most predicted miRNAs targeted genes involved in plant growth, development, and environmental stress responses. The study provides evidence that miRNAs are conserved across plants and play important roles in paprika development and stress response.
Forecasting clinical behavior and therapeutic response of human cancer currently utilizes a limited number of tumor markers in combination with characteristics of the patient and their disease. Although few tumor markers and molecular targets exist for evaluation, the wealth of information derived from recent sequencing advancements provides greater opportunities to develop more precise tests for diagnostics, prognostics, therapy selection and monitoring in the future. The objectives of this study are to study miRNA and mRNA expression profiles of laser capture microdissection (LCM)-procured tumor cells and intact serial sections of breast tissue samples using next generation sequencing (NGS) methods. Our hypothesis is that miRNA signatures discerned from specific tumor cell populations more precisely correlate with behavior than that provided by conventional biomarkers from intact tissue samples. Additionally, we hypothesize the data generated in this study will present mRNA signatures informative for breast tumor research and support our miRNA findings through suggesting relevant miRNA:mRNA target associations.
De-identified frozen research samples of primary invasive ductal tumors of known grade and biomarker status containing 35-70% tumor were selected from an IRB-approved Biorepository. Comparison of expressed miRNAs from intact tissue sections with those of cognate tumor cells procured by LCM revealed, in general, that smaller defined miRNA gene sets were expressed in LCM isolated populations of tumor cells. In addition to miRNA sequencing, targeted RNA sequencing with the Ion AmpliSeq™ Transcriptome Human Gene Expression Kit was used to capture mRNA expression information. Data presented here demonstrates high mapping rates for targeted mRNA (>91% of reads) and miRNA (> 88% of reads) libraries. We also demonstrate high technical reproducibility between multiple libraries from the same tumor sample for both mRNA (R>0.99) and miRNA (R>0.97) libraries. We also report suggested miRNA:mRNA target associations identified in our set of breast tumor research samples. These data provide insights into breast cancer biology that may lead to new molecular diagnostics and targets for drug design in the future as well as an improved understanding of the molecular basis of clinical behavior and potential therapeutic response.
A Review Of Databases Predicting The Effects Of SNPs In MiRNA Genes Or MiRNA-...Jennifer Daniel
This document reviews several databases that predict the effects of single nucleotide polymorphisms (SNPs) in microRNA (miRNA) genes and miRNA binding sites. It compares the core functionalities and features of databases like miRdSNP, MirSNP, PolymiRTS and miRNASNP. These databases store predictions of how SNPs may impact miRNA-target relationships by creating or deleting miRNA response elements (MREs) or changing binding affinity. The review evaluates these databases and outlines recommendations for future developments, highlighting the need for regularly updating SNP and miRNA data to keep predictions current.
COMPETENCY 3Integrate credible and relevant sources into coursewLynellBull52
COMPETENCY 3
Integrate credible and relevant sources into coursework to enhance clarity and support claims.
CRITERION
Reflect on how credibility and relevance of a chosen resource were determined.
Your result: Non-Performance
Distinguished
Reflects on how credibility and relevance of a chosen resource were determined. Notes how specific aspects of the assessment were used to determine relevance.
Proficient
Reflects on how credibility and relevance of a chosen resource were determined.
Basic
Explains the concepts of credibility and relevance in general terms, but does not specifically address how this was used to determine if the specific resource was credible and relevant.
Non-Performance
Does not explain the concepts of credibility and relevance in general terms.
Faculty Comments:
I did not see a discussion of source credibility/relevance. For this assignment you were are also required to locate an article in the library about time organizing strategies (outlined in Part I). Then, you were asked in Part II to reflect on how you determined the credibility and relevance of your chosen library resource to support your task prioritization.
ONCOLOGY LETTERS 19: 595-605, 2020
Abstract. Numerous types of molecular mechanisms mediate
the development of cancer. Non-coding RNAs (ncRNAs) are
being increasingly recognized to play important role in medi-
ating the development of diseases, including cancer. Long
non-coding RNAs (lncRNAs) and microRNAs (miRNAs) are
the two most widely studied ncRNAs. Thus far, lncRNAs are
known to have biological roles through a variety of mecha-
nisms, including genetic imprinting, chromatin remodeling,
cell cycle control, splicing regulation, mRNA decay and
translational regulation, and miRNAs regulate gene expres-
sion through the degradation of mRNAs and lncRNAs.
Although ncRNAs account for a major proportion of the total
RNA, the mechanisms underlying the physiological or patho-
logical processes mediated by various types of ncRNAs, and
the specific interaction mechanisms between miRNAs and
lncRNAs in various physiological and pathological processes,
remain largely unknown. Thus, further research in this field
is required. In general, the interaction mechanisms between
miRNAs and lncRNAs in human cancer have become
important research topics, and the study thereof has led to
the recent development of related technologies. By providing
examples and descriptions, and performing chart analysis, the
present study aimed to review the interaction mechanisms and
research approaches for these two types of ncRNAs, as well
as their roles in the occurrence and development of cancer.
These details have far‑reaching significance for the utilization
of these molecules in the diagnosis and treatment of cancer.
Contents
1. Introduction
2. Interactions between lncRNAs and miRNAs
3. Methods of research in to lncRNAs and miRNAs
4. lncRNAs and miRNAs in cancer
5. Conclusion
1. Introduction
In 1993, Lee e ...
MPSS is a technique for analyzing gene expression that involves sequencing cDNA fragments cloned onto microbeads. It allows for the simultaneous sequencing of over 1 million cDNA clones. MPSS generates 17-base signature sequences that uniquely identify mRNA transcripts. Gene expression levels are quantified by counting the number of signatures for each gene. MPSS provides a more in-depth analysis of gene expression compared to other methods as it can detect genes expressed at very low levels and does not require prior knowledge of gene sequences.
The document describes RT2 miRNA PCR Arrays from SABiosciences for analyzing microRNA (miRNA) expression. Key points:
Relative Detection
(% perfect match)
1) The system allows simultaneous detection of over 700 miRNAs representing most functional human miRNAs.
hsa-miR-10a
hsa-miR-10b
100
0.01
2) It uses a universal polyadenylation and reverse transcription approach followed by SYBR Green-based real-time PCR, offering improved sensitivity, specificity, and reproducibility over other methods.
hsa-miR-10a
hsa-miR-10b
0.01
2016 micro rna in control of gene expression an overview of nuclear functionsAntar
This document summarizes recent research on the nuclear functions of microRNAs (miRNAs). It discusses how miRNAs and miRNA-induced silencing complexes (miRISCs) can shuttle between the cytoplasm and nucleus. While miRNAs primarily regulate gene expression post-transcriptionally in the cytoplasm, growing evidence indicates they also have specific nuclear functions, particularly in transcriptionally controlling gene expression. However, the specific mechanisms by which miRNAs identify and target genes for transcriptional control in the nucleus are still being debated.
Araport is an online resource for Arabidopsis research that integrates data from various sources through federation and warehousing. It provides updated gene annotations including over 1,000 new protein coding genes and 50k new splice variants identified from RNA-seq data. Araport's goals are to serve as a comprehensive "one-stop-shop" for Arabidopsis genomic data, literature, and tools through its combination of software and state-of-the-art web technologies.
MicroRNA-Disease Predictions Based On Genomic Dataijtsrd
Gene Ontology is a structured library of concepts related with one or more gene products through a process called annotation. Association Rules that discovers biologically relevant and corresponding associations. In the existing system, they used Gene Ontology-based Weighted Association Rules for extracting annotated datasets. We here adapt the MOAL algorithm to mine cross-ontology association rules. Cross ontology rules to manipulate the Protein values from three sub ontologys for identifying the gene attacked disease. It focused on intrinsic and extrinsic values. The Co-Regulatory modules between microRNA, Transcription Factor and gene on function level with multiple genomic data. The regulations are compared with the help of integration technique. Iterative Multiplicative Updating Algorithm is used in our project to solve the optimization module function for the above interactions. Comparing the regulatory modules and protein value for gene and generating Bayesian rose tree for the efficiency of our result. Ajitha. C | DivyaLakshmi. K | Jothi Jayashree. M"MicroRNA-Disease Predictions Based On Genomic Data" Published in International Journal of Trend in Scientific Research and Development (ijtsrd), ISSN: 2456-6470, Volume-2 | Issue-3 , April 2018, URL: http://www.ijtsrd.com/papers/ijtsrd11386.pdf http://www.ijtsrd.com/computer-science/data-miining/11386/microrna-disease-predictions-based-on-genomic-data/ajitha-c
This document discusses microRNAs (miRNAs), which are small non-coding RNA molecules that regulate gene expression. It provides a brief history of miRNA discovery and defines miRNAs and how they differ from siRNAs. The document highlights that miRNAs are encoded in genomes and bind to mRNAs to repress translation or promote degradation. It notes miRNAs play key roles in processes like cell differentiation and growth. The document also summarizes some of the main functions of miRNAs in controlling gene expression and development.
The IOSR Journal of Pharmacy (IOSRPHR) is an open access online & offline peer reviewed international journal, which publishes innovative research papers, reviews, mini-reviews, short communications and notes dealing with Pharmaceutical Sciences( Pharmaceutical Technology, Pharmaceutics, Biopharmaceutics, Pharmacokinetics, Pharmaceutical/Medicinal Chemistry, Computational Chemistry and Molecular Drug Design, Pharmacognosy & Phytochemistry, Pharmacology, Pharmaceutical Analysis, Pharmacy Practice, Clinical and Hospital Pharmacy, Cell Biology, Genomics and Proteomics, Pharmacogenomics, Bioinformatics and Biotechnology of Pharmaceutical Interest........more details on Aim & Scope).
Global run-on sequencing (GRO-Seq) is a method to map the binding sites of transcriptionally active RNA polymerase II. It involves allowing RNA polymerase II to actively transcribe in the presence of labeled nucleotides, followed by purification and sequencing of the newly synthesized RNA. This provides sequences of RNAs that are currently being transcribed, without prior knowledge of transcription sites. While it directly determines relative transcriptional activity, GRO-Seq is limited to cell cultures and may introduce artifacts during nuclear preparation or transcription run-on.
Please describe in detaila. How to create and to use a transpo.pdf4babies2010
Please answer the discussion questions and TYPE you answers. MINICASE ARE YOU
REALLY BUYING AMERICAN? Consider the follawing scenario of a typical\" American fam
work, stopping for gas at the Shell station. At the grocery ily: The Osbornes, Jesse and Ann, live
in the suburbs of store, she fills her cart with a variety of items, including Chicago Jesse is a
manager at Trader Joe\'s specialty grocery Ragu spaghetti sauce, Hellmann\'s mayonnaise,
Carnation store chain. Ann is an edvertising executive for Leo Burnett Instant Breakfast drink, a
case of Arrowhead water, CoffeeMate nondairy coffee creamer, Chicken-of the-Sea Ann listens
to the new Adam Lambert CD on her Alpine car stereo in her Jeep Cherakes while driving homa
from canned tuna, Lipton tea, a hall-dozen cans of Slim-Fast. Dannon yogurt, and several
packages of Stouffer\'s Lean dinners and some Hot Packats. For a treat. Groupe Danone of
France produces Dannon yogurt she picks up some Ben & Jerry\'s ice cream, Toll House cook-
es, and a Butterfinger candy bar. She also grabs several cans af Alpo for thair dog, Sassy, and a
box of Friskies and a bag of Tidy Cat cat litter for their cat, Lily. She goes down the toilet- ries
aisle for some Dove soap, Q-tips cotton swabs, Vaseline Samsung smartphones are made by
South Korea\'s lip gloss, and Jergen\'s moisturizing lotion. Before fhng,Samsung- she calls Jesse
on her Samsung smartphone to see whetherBertelsmann AG of Germany owns 53 percent of
there is anything else he needs. Ho asks her to pick up some PowerBars for him to take to the
gym during his lunchtime the remaining 47 percent. workouts next week. She also stops at the
bookstore andSociete Bic of France produces Bic pens picks up the new John Grisham book
published by Random House, signing the credit card slip with her Bic pen. Chicken-of the Sea
tuna is made by Chicken of the Sea International, which is besed in Thailand. Japan\'s Kao owns
Jergen\'s. Penquin Random House, and Pearson plc of the UK owns ·Japan\'s Bridgestone
Corporation owns Firestone. BP of the United Kingdom owns BP gas stations. After leaving his
office, Jesse stops at the BP gas station to fili his gas tank and checks the air pressure in his
Firestone tires. He heads to the liquor store for a cese of Miller Genuine thSpiderman movies
Sony Pictures Tolovision distrib- Draft beer and a bottle of Wild Turkey bourbon. He walks next
door to the sporting goods store to pick up someSABMiller plc of the United Kingdom produces
Miller Columbia Pictures, owned by Sony of Japan, released utes Breaking Bad. Wilson
racquetballs for his workouts next week. boer, Ann\'s favorite TV show, Breaking Bad, is just
startinDavide Campari of Italy awns the Wild Turkay brand. comes in the door, so she pours
hersalf a glass af Amer Group of Finland owns Wilsan Sporting Goods. and turns on their Philips
high-. Baringer Winery of Napa, California, is owned by definition talevision while Jasse
prepares dinner loads the latest Spiderman inst.
A Comparative Encyclopedia Of DNA Elements In The Mouse GenomeDaniel Wachtel
The Mouse ENCODE Consortium mapped transcription, chromatin accessibility, transcription factor binding, chromatin modifications, and replication domains in over 100 mouse cell types and tissues to generate a comparative encyclopedia of functional DNA elements in the mouse genome. They found that while much is conserved with humans, many mouse genes and large portions of regulatory DNA show divergence. Mouse and human transcription factor networks are more conserved than cis-regulatory DNA. Species-specific regulatory sequences are enriched for repetitive elements. Chromatin state and replication timing landscapes are developmentally stable within species.
This study profiled circulating microRNAs (miRNAs) in human plasma and serum samples using deep sequencing of small RNA libraries. The researchers detected placental-specific miRNAs in maternal and newborn circulation, quantifying their relative abundance. They also found that sequence variations in placental miRNA profiles could be traced to the specific placenta of origin. This deep sequencing approach provides a comprehensive characterization of the miRNA content in circulation and establishes its potential for biomarker discovery and noninvasive detection of diseases originating from solid tissues like tumors or the placenta during pregnancy.
Potentiality of a triple microRNA classifier: miR- 193a-3p, miR-23a and miR-3...Enrique Moreno Gonzalez
MicroRNAs (miRNAs) are short, non-coding RNA molecules that act as regulators of gene expression. Circulating blood miRNAs offer great potential as cancer biomarkers. The objective of this study was to correlate the differential expression of miRNAs in tissue and blood in the identification of biomarkers for early detection of colorectal cancer (CRC).
1) The document discusses a study analyzing the impact of gene length on detecting differentially expressed genes using RNA-seq technology.
2) The study will first test the reproducibility of RNA-seq and the effect of normalization. It will then compare different statistical tests for identifying differentially expressed genes.
3) Finally, the study will specifically test how gene length impacts the likelihood of a gene being identified as differentially expressed, as longer genes are easier to map with short reads.
Degradome sequencing and small rna targetsAswinChilakala
small RNA have numerous roles in plant developmental biology their discovery is one of the important things to take advantage of the plant system moreover the gene target of small RNA identification helps us engineer the development of the plant in a better way one such method is Degradome sequencing.
Transcriptomics is the study of the transcriptome, which is the complete set of RNA transcripts produced by the genome under certain conditions, using high-throughput methods like microarray analysis. The transcriptome includes mRNA, rRNA, tRNA and other non-coding RNA transcribed in a cell or population of cells. Oncogenomics applies transcriptomics to characterize genes associated with cancer. Gene expression analysis focuses on relevant target genes and their location and distances on chromosomes can be determined through sequence mapping. Non-coding RNAs regulate gene expression at the transcriptional and post-transcriptional levels.
1. Identifying transcriptional start sites of human
microRNAs based on high-throughput
sequencing data
Chia-Hung Chien1
, Yi-Ming Sun2
, Wen-Chi Chang3
, Pei-Yun Chiang-Hsieh4
,
Tzong-Yi Lee5
, Wei-Chih Tsai4
, Jorng-Tzong Horng2
, Ann-Ping Tsou4,
* and
Hsien-Da Huang1,6,
*
1
Institute of Bioinformatics and Systems Biology, National Chiao Tung University, Hsin-Chu 300, 2
Department of
Computer Science and Information Engineering, National Central University, Chung-Li 320, 3
Institute of Tropical
Plant Science, National Cheng Kung University, Tainan 701, 4
Department of Biotechnology and Laboratory
Science in Medicine, National Yang-Ming University, Taipei 112, 5
Department of Computer Science and
Engineering, Yuan Ze University, Taoyuan 320 and 6
Department of Biological Science and Technology,
National Chiao Tung University, Hsin-Chu 300, Taiwan
Received December 14, 2010; Accepted July 6, 2011
ABSTRACT
MicroRNAs (miRNAs) are critical small non-coding
RNAs that regulate gene expression by hybridizing
to the 30
-untranslated regions (30
-UTR) of target
mRNAs, subsequently controlling diverse biological
processes at post-transcriptional level. How miRNA
genes are regulated receives considerable attention
because it directly affects miRNA-mediated gene
regulatory networks. Although numerous prediction
models were developed for identifying miRNA pro-
moters or transcriptional start sites (TSSs), most of
them lack experimental validation and are inad-
equate to elucidate relationships between miRNA
genes and transcription factors (TFs). Here, we inte-
grate three experimental datasets, including cap
analysis of gene expression (CAGE) tags, TSS Seq
libraries and H3K4me3 chromatin signature derived
from high-throughput sequencing analysis of gene
initiation, to provide direct evidence of miRNA TSSs,
thus establishing an experimental-based resource of
human miRNA TSSs, named miRStart. Moreover, a
machine-learning-based Support Vector Machine
(SVM) model is developed to systematically identify
representative TSSs for each miRNA gene. Finally,
to demonstrate the effectiveness of the proposed
resource, an important human intergenic miRNA,
hsa-miR-122, is selected to experimentally validate
putative TSS owing to its high expression in a
normal liver. In conclusion, this work successfully
identified 847 human miRNA TSSs (292 of them are
clustered to 70 TSSs of miRNA clusters) based on
the utilization of high-throughput sequencing data
from TSS-relevant experiments, and establish a
valuable resource for biologists in advanced re-
search in miRNA-mediated regulatory networks.
INTRODUCTION
MicroRNAs (miRNAs) are $22 bp-long, endogenous
RNA molecules that act as regulators, leading either
mRNA cleavage or translational repression by principally
hybridizing to the 30
-untranslated regions (30
UTRs) of
their target mRNAs. This negative regulatory mechanism
at the post-transcriptional level ensures that miRNAs play
prominent roles in controlling diverse biological processes
such as carcinogenesis, cellular proliferation and differen-
tiation (1–3).
Recently, an increasing number of miRNA target pre-
diction tools have been developed (4–8). As well as putative
miRNA-target interactions, numerous miRNA targets are
experimentally validated and collected in TarBase (9),
miRecords (10), miR2Disease (11) and miRTarBase (12).
According to the latest statistics in miRTarBase, for ex-
ample, there exist 58 and 43 known target genes of
hsa-miR-21 and hsa-miR-122, respectively. It reveals the
importance of miRNA functions in contributing to the
control of gene expression (Figure 1B). Therefore, tran-
scriptional regulatory networks have been expanded and
*To whom correspondence should be addressed. Tel: +886 3 5712121 Ext. 56952; Fax: +886 3 5739320; Email: bryan@mail.nctu.edu.tw
Correspondence may also be addressed to Ann-Ping Tsou. Tel: +886 2 28267000; Ext. 7155; Fax: +886 2 28264092; Email: aptsou@ym.edu.tw
Published online 5 August 2011 Nucleic Acids Research, 2011, Vol. 39, No. 21 9345–9356
doi:10.1093/nar/gkr604
ß The Author(s) 2011. Published by Oxford University Press.
This is an Open Access article distributed under the terms of the Creative Commons Attribution Non-Commercial License (http://creativecommons.org/licenses/
by-nc/3.0), which permits unrestricted non-commercial use, distribution, and reproduction in any medium, provided the original work is properly cited.
2. become rather complex due to the involvement of
miRNAs (13).
Given the significance of miRNA functions and its role
in gene regulation, how miRNA genes are regulated re-
ceives considerable attention and directly affects miRNA-
mediated gene regulatory networks. Several studies thus
elucidated which transcription factors (TFs) can regulate
the transcription of miRNA genes (14–16), and which
ones should be involved in specific regulatory circuitries
(Figure 1C). Moreover, Wang et al. (17) manually identi-
fied 243 TF-miRNA regulatory relations by conducting a
literature survey and constructing a database, TransmiR.
Although such data provide deep insights into the miRNA
transcriptional regulation, most of them remain unknown
unless a large-scale investigation of novel cis- and trans-
elements is undertaken to further determine more TF-
miRNA regulatory relations. Hence, precisely locating
promoter regions of miRNA genes is of priority
concern, in which transcriptional start sites (TSSs) of
miRNA genes must be identified first (Figure 1D and E).
Since most miRNA genes are transcribed by RNA poly-
merase II (18–21), promoter prediction models or genomic
annotation based on transcriptional features of RNA
polymerase II (class II) gene were used to characterize 50
boundaries of primary miRNAs (pri-miRNAs) and to
identify putative core promoters of miRNA genes
(22–24). Additionally, previous studies applied chromatin
immunoprecipitation (ChIP) data of RNA polymerase II
and histone methylations, which reveal gene promoter
signals, for detecting miRNA promoters systematically
(25,26). However, all miRNA promoters mentioned above
are computationally predicted, without experimental val-
idation to support their reliability. Until now, only few of
miRNA promoters predicted by using chromatin signa-
tures have been confirmed by promoter reporter assay
(27,28).
Obviously, rather than promoter/TSS prediction tools
or computational models, experimental datasets derived
from high-throughput sequencing analysis of gene initi-
ation reveal how TSS signals are distributed in the genome
and provide direct evidence of gene promoters. In this
work, we attempt to identify miRNA TSSs by incor-
porating current datasets, including cap analysis of gene
expression (CAGE) tags, TSS Seq libraries and H3K4me3
chromatin signature, to establish an experimental-based
resource of miRNA TSSs, named miRStart, with a par-
ticular emphasis on the human genome. Moreover, a
machine-learning-based support vector machine (SVM)
model is developed to select the representative TSSs sys-
tematically for each miRNA gene. A user-friendly web
resource allows scientists to select miRNA TSSs based
on the straightforward display of experimental TSS
signals. Besides, this work successfully validates the puta-
tive promoter of liver-specific hsa-miR-122 by 50
RACE
and luciferase reporter assay, which contains the exhaust-
ive structure and is more authentic than previous one (27).
As a novel resource for biologists in advanced research in
miRNA-mediated regulatory networks, miRStart inte-
grates abundant data from TSS-relevant experiments,
offering reliable human miRNA TSSs to further decipher
the miRNA transcription regulation. The resource is cur-
rently available at http://mirstart.mbc.nctu.edu.tw/.
Figure 1. The collaboration of miRNAs and TFs makes transcriptional regulatory networks more complex. Shown is (A) a traditional regulatory
circuitry that considers only genes and their TFs. (B) A miR-involved regulatory circuitry. (C) The entire regulatory circuitry containing TFs,
miRNA genes, miRNAs and their target genes. (D) Identifying TSSs of miRNA genes is the first step to investigate TF-miRNA regulatory relations.
(E) Investigation of novel cis- and trans-elements of miRNA genes.
9346 Nucleic Acids Research, 2011, Vol. 39, No. 21
3. MATERIALS AND METHODS
Data collection
Human miRNAs and gene annotation. The genomic coord-
inates of 940 human pre-miRNAs were obtained from
miRBase release 15 (29). According to a previous study,
two miRNAs within a distance <50 kb tend to share a
common primary transcript (30). Therefore, this work ana-
lyzed the 50 kb-long upstream region of each pre-miRNA
to identify putative TSSs. Upstream flanking sequences
were then downloaded using the BioMart data mining ap-
proach provided by Ensembl release 58 (31). Additionally,
Homo sapiens genes (GRCh37) with HGNC symbols were
also obtained from Ensembl either to define intragenic and
intergenic miRNAs or to avoid overlapping an identified
TSS with other TSS of an annotated gene. Typically,
pre-miRNAs embedded in the same strand of Ensembl
genes are defined as ‘intragenic miRNAs’, whereas pre-
miRNAs located between Ensembl genes are ‘intergenic
miRNAs’.
TSS-relevant datasets derived from high-throughput
sequencing. In this work, CAGE tags, TSS Seq tags and
H3K4me3 modification were mapped directly to the up-
stream flanking regions of miRNA precursors for TSS
detection (Supplementary Table S1). Totally, 29 million
CAGE tags derived from 127 human RNA samples were
obtained from FANTOM4 (32). This work also incor-
porated 75 361 186 and 241 440 055 TSS Seq tags derived
from eight human normal tissues (five fetal tissues and
three adult tissues) and six human cell lines (DLD1,
HEK293, Beas2B, Ramos, MCF7 and TIG) from
DBTSS release 7.0, respectively (33). For H3K4me3 modi-
fication, high-resolution ChIP-seq data of human CD4+
T cells reported in 2007 (34) were used and downloaded
from http://dir.nhlbi.nih.gov/papers/lmi/epigenomes/
hgtcell.aspx. Since genomic coordinates of these three ex-
perimental datasets are based on NCBI36/hg18, the
liftOver program obtained from UCSC Genome browser
(35) was applied to convert genomic loci into GRCh37/
hg19 (compatible to miRBase release 15).
Supporting evidence of miRNA TSSs. Human expressed
sequence tags (ESTs) located in pre-miRNA upstreams
and the conservation within those regions provide strong
evidences of TSS loci. Here, all human ESTs and conser-
vation among 46 vertebrate species using phastCons
method were retrieved from UCSC Genome Browser.
They are useful in supporting miRNA TSSs estimated
by the proposed SVM model.
SVM-based prediction model
Computational models for miRNA TSS identification are
generated by adopting the SVM, which incorporates
CAGE tags, TSS Seq tags and H3K4me3 modification
as training evidence. Based on the binary classification,
SVM maps the input samples into a higher dimensional
space using a kernel function and, then, identifies a
hyper-plane that discriminates between the two classes
with a maximal margin and minimal error. A public
SVM library, LibSVM (36), is used to train the predictive
model with positive and negative training sets, which are
encoded based on different training features. 7286 protein-
coding genes with unique TSS were collected from DBTSS
as the training sets for establishing a SVM-based TSS pre-
diction model. The total number of CAGE tags, TSS Seq
tags and H3K4me3 modification within a 200 bp-long
window size from À1100 to +1100 relative to 7286
TSSs was calculated and defined as positive sets,
whereas Æ10 kb away in relation to 7286 TSSs were
defined as negative sets. The comparison between
positive and negative sets is illustrated in Supplementary
Figure S1B (see Supplementary Data). Then, a matrix
with 33 features of 7286 experimentally verified TSS was
created (Supplementary Figure S2). This observation
reveals how TSS-relevant signals are distributed around
exact TSSs and are the inputs for SVM training.
After the establishment of SVM-based model for
miRNA TSS prediction, the model performance was eva-
luated by 5-fold cross-validation. Next, the SVM model
scanned up to 50-kb upstream regions for each pre-
miRNA with a 2200 bp-long window and a 100 bp-long
step to identify a 200 bp-long region containing
high-confidence TSS. The putative region containing the
most possible TSS of a miRNA is selected as a priority if:
(i) The region is classified into ‘positive’ by the SVM
model.
(ii) The positive region does not overlap with exons of
protein-coding genes.
(iii) ESTs and conservation are supported around the
region.
(iv) The positive region is nearest to the 50
end of
pre-miRNA.
Finally, the tag density in representative regions is
calculated using the following density function:
x ¼
Xn
i¼1,i6¼x
1
jLoci À Locxj+1
where x denotes the density of each locus within a repre-
sentative region possibly contained miRNA TSSs; Loci
represents the location of site i; and Locx denotes the
location of sitex. The total number of sites detected in
the representative region is denoted as n. We recommend
a putative miRNA TSS if the locus has the highest density
of CAGE tags and TSS Seq tags. Since polycistronic
miRNAs tend to be transcribed from a common transcrip-
tion unit (30), it is logical to provide putative TSSs of
miRNA clusters rather than the TSS of each miRNA.
For this reason, human miRNAs with identical putative
TSSs in miRStart were defined as a miRNA cluster.
Besides, as suggested in the previous study, miRNAs
within a distance 50 kb were assigned to a new cluster
or the existed clusters. Such miRNAs were excluded if
they are reported to be embedded in different host genes
and not all of them are intragenic or intergenic.
Cell lines and RNA interference with shRNA
The human HCC cell lines, HuH-7, Hep3B and human
embryonic kidney HEK293T cells were cultured as
Nucleic Acids Research, 2011, Vol. 39, No. 21 9347
4. described previously (37). HuH7 cells were plated and
infected with lentiviruses expressing shDGCR8 in the
presence of 8 mg/ml protamine sulfate for 24 h, which
was followed by puromycin (2 mg/ml; 48 h) selection. The
shRNA target sequences for DGCR8 were 50
GCTCGAT
GAGTTAGAAGATTT30
(TRCN0000159003). The
shLuc (TRCN0000072243, shLuc) targeting the luciferase
gene was used as a control for RNA interference. Gene
expression and the knockdown efficiency of DGCR8 were
examined using RT–PCR and standard gel electrophor-
esis. Expression of pri-miR-122 and mature miR-122
was detected by RT–PCR and low stringency northern
blotting, respectively (38). [g-32P]-labeled 50
-ACAAACA
CCATTGTCACACTCCA-30
was used in detecting
miR-122 by northern blotting. U6 snRNA was used as
an internal control. The primer sequences are listed in
Supplementary Table S2.
RNA ligase mediated rapid amplification of cDNA ends
PolyA+RNA was purified from HuH7 that were infected
with lentiviruses expressing shDGCR8 using OligotexR
mRNA Kit (Qiagen). RNA ligase-mediated rapid ampli-
fication of cDNA ends (RLM-RACE) was performed
using FirstChoice RLM-RACE Kit (Ambion) and
250 ng of polyA+ RNA, following the manufacturer’s in-
structions. The gene-specific primer for the 50
-RACE was
reverse primer R01863_R’ (50
-AGGGACCTAGAACAG
AAATCG-30
). For the 30
-RACE, three forward gene-
specific primers were used: 122-D1 (50
-CAATGGTGTTT
GTGTCTAAACT-30
), 122-D2 (50
-CTACCGTGTGCCT
GAC-30
), and 122-D3 (50
-CTCCTGGCACCATCTAC-30
).
Plasmid constructs
Luciferase reporter constructs containing several upstream
regions of pri-miR-122 (nucleotides À1 to À182, À1 to
À391, À1 to À1358, À375 to À1358 and À1329 to
À2221) were subcloned in pGL3-basic vector (Promega)
and designated as pGL3-miR-122-U, ÀU1, ÀU12, ÀU2
and ÀU3, respectively. Mutations of two putative TATA
boxes were generated using a QuickChange Site-Directed
Mutagenesis Kit (Stratagene). The TATA boxes were
mutated at À23 to À28 (mTATA1) and À81 to À87
(mTATA2). The RT–PCR primers used in mutagenesis
are listed in Supplementary Table S2.
Promoter reporter assay
Cells (5 Â 104
/well) were seeded in 24-well plate and co-
transfected with 0.5 mg of pGL3-basic or pGL3-basic-
promoter constructs and 0.05 mg of pRL-TK (Promega)
using jetPEI reagent (Polyplus-Transfection). After 48 h,
the luciferase activity was measured using the Dual-
Luciferase Reporter Assay System kit (Promega). pGL3-
NRP1 promoter construct (37) was used as a positive
control for the promoter reporter assay.
Statistical analysis
All data are expressed as mean Æ SD and compared
between groups using the Student’s t-test. A P0.05 was
considered to be statistically significant.
RESULTS
CAGE tags, TSS Seq tags and H3K4me3 enriched loci
reveal TSSs of RNA polymerase II genes
As $20-nt sequences are derived from the 50
terminal of
cDNAs, CAGE tags can be massively generated using a
biotinylated cap-trapper with specific linkers to ensure
that the sequences after 50
cap of cDNAs are reserved
(39). Based on this attribute, CAGE tags are extensively
adopted to identify the TSSs of genes with 50
cap tran-
scripts, i.e. RNA polymerase II (class II) genes (40).
Similar to CAGE tags, TSS Seq tags initially denominated
by DBTSS are also the 50
-end sequences of human and
mice cDNAs based on use of the TSS Seq method (33).
More than 300 million TSS Seq tags were generated by
integrating the oligo-capping method and Solexa
sequencing technology, offering an abundant resource to
detect class II TSSs. Besides, histone methylation signifi-
cantly influences gene expression. H3K4me3, which repre-
sents histone H3 as trimethylated at its lysine 4 residue, is
enriched around TSS and positively correlated with gene
expression, regardless of whether or not the genes are
transcribed productively. As a massive parallel signature
sequencing technique, ChIP-seq performs well in chroma-
tin modifications and provides high-resolution profiling of
histone methylations in the human genome (34).
To evaluate the feasibility of using these three
experimental-based datasets to identify miRNA TSS, the
occurrence distributions of CAGE tags, TSS Seq tags, and
H3K4me4 modification around experimentally verified
TSSs of RNA polymerase II genes were examined
(Figure 2). After obtaining 7286 annotated genes with
Entrez Gene ID and unique TSS from DBTSS, genes
with multiple TSSs were omitted to avoid the overlapping
tags between adjacent TSSs (Supplementary Figure S3).
Next, the averages of CAGE tags, TSS Seq tags and
H3K4me4-enriched loci from À2500 to +2500 (window
size = 200 bp) relative to each TSS were mapped and
analyzed. Figure 2A depicts the tag occurrence distribu-
tions of three sets of experimental evidence, and the peaks
of CAGE and TSS Seq tags are positively correlated with
the locations of the experimentally verified TSSs as well as
H3K4me3-enriched loci. It implies that CAGE tags, TSS
Seq tags and H3K4me3-enriched loci can be considered as
effective supporting evidences for revealing the TSSs of
RNA polymerase II genes, including TSSs of miRNAs
(Figure 2B).
TSS candidates of intragenic and intergenic human
miRNAs
To identify miRNA TSSs in the human genome, three sets
of experimental evidence including CAGE tags, TSS Seq
tags and H3K4me4 modification were mapped to the
50 kb upstream region of each miRNA precursor to
observe their occurrence distribution. According to the
evaluation process mentioned above, genomic loci that
aggregated by three sets of experimental evidence with
apparent peaks reveals a highly probable regions for
miRNA TSSs. Additionally, expressed sequence tags
(ESTs) and evolutionarily conserved genomic regions
9348 Nucleic Acids Research, 2011, Vol. 39, No. 21
5. around putative miRNA TSSs also provide strong
evidence to increase the reliability of corresponding
miRNA TSSs.
Among the 940 human miRNAs in miRBase release 15
(29), 483 (51%) are classified as intragenic and 457 (49%)
are classified as intergenic in miRStart. As is generally
assumed, intragenic miRNAs, whose precursors are
located within introns, exons or UTRs of protein-coding
transcripts, share common promoters with their host genes
and are expressed simultaneously (30,41,42). However, for
intergenic miRNAs, their primary transcripts are trans-
cribed from individual, non-protein-coding genes and
have their own promoters (18). The human miRNA
let-7a-1 provides a typical example of how to use the
above-mentioned experimental evidence to define inter-
genic miRNA TSSs (Supplementary Figure S4). In total,
1083 CAGE tags and 208 TSS Seq tags are within the
50 kb upstream region of let-7a-1 precursor (Genomic
coordinates Chr9: 96938239-96938318 [+]). The aggrega-
tion of CAGE tags, TSS Seq tags and H3K4me3 modifi-
cation is apparently around the 9000–10 000 upstream
region of precursor, implying that TSS candidates of
let-7a-1 may be located between 96928239 and 96929239.
It is noticed that CAGE tags are strikingly assembled at
96928529 that denotes the putative TSS of let-7a-1. As
anticipated, an EST BG326593 at 96928570 nearby
putative TSS provides supporting evidence that the
determined TSS is reliable. The upstream region immedi-
ately adjacent to putative TSS is quite conserved between
44 vertebrate species, implying that this motif may have
promoter activity. Furthermore, two miRNAs, let-7f-1
and let-7d, close to let-7a-1 (distance less than 3000 bps)
have identical TSS coordinates in miRStart. This observa-
tion suggests that the three miRNAs should be clustered
and may be transcribed as a single primary transcript. In
sum, TSSs of either intragenic or intergenic miRNAs in
human are defined properly in miRStart and can be
further analyzed to elucidate TF-miRNA regulatory
relations.
Systematically identifying human miRNA TSSs by
the SVM model
SVM, a machine-learning method, has been adopted to
solve pattern identification problems with an obvious cor-
relation with the underlying statistical learning theory
(43). SVM focuses on mapping input vectors to a higher
dimensional space in which a maximal separating hyper-
plane is defined. Two parallel hyperplanes are constructed
on each side of the hyperplane that separates the data into
two groups. The separating hyperplane maximizes the dis-
tance between the two parallel hyperplanes. Moreover,
SVM can solve a classification problem when the number
of training data is extremely small (44). Therefore, to
identify 940 human miRNA TSSs efficiently, a SVM
model was developed to systematically select the represen-
tative TSSs for each miRNA gene. The model perform-
ance was evaluated by a 5-fold cross-validation test,
indicating the following: sensitivity of 90.36%, specificity
of 90.05%, accuracy of 90.21% and precision of 90.08%.
The randomization test was carried out to avoid the oc-
currence of overfitting as well (Supplementary Table S3).
After scanning the 50 kb upstream region of miRNA pre-
cursors with SVM model and then executing the filtering
process, miRStart provides 10 TSS candidates for each
intergenic miRNA gene. As for intragenic miRNA
genes, although miRStart officially uses their host gene
starts as TSSs, putative TSSs identified by SVM model
are still provided because several investigations have
demonstrated that intragenic miRNA genes may have
their own promoters (26,45). Figure 3 depicts the system
flow of miRStart.
In total, miRStart identified 90% (847 out of 940)
putative TSSs of human miRNAs, among them are 365
putative TSSs of intergenic miRNAs. miRStart also clus-
tered 292 human miRNAs with 70 putative TSSs of tran-
scription units. Users can access the suggested TSSs of
individual miRNAs or miRNA clusters (by switching to
the ‘cluster list’ view). Table 1 lists 30 TSSs of intergenic
Figure 2. CAGE tags, TSS Seq tags and H3K4me3 modification ag-
gregate around 7286 experimentally verified TSSs and can be used to
identify miRNA TSSs. (A) Tag occurrence distribution of the three sets
of experimental evidence near TSSs. (B) Examples of three identified
miRNA TSSs in miRStart. Notably, the three miRNA TSSs are ex-
perimentally verified, revealing that miRNA TSSs can be determined
based on the tag occurrence distributions of CAGE tags, TSS Seq tags
and H3K4me3 modification.
Nucleic Acids Research, 2011, Vol. 39, No. 21 9349
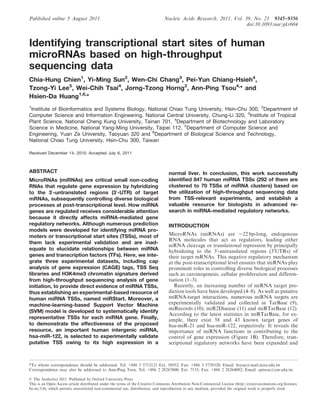
6. miRNA genes identified by SVM model (Supplementary
Table S4 for the entire list). Notably, the distances
between intergenic miRNA TSSs and their precursors sig-
nificantly fluctuate from less than 100 bps to 50 kb. A
comparison was made of the distance between intergenic
pre-miRNA and its TSS with the 50
UTR length of protein-
coding gene by calculating the distance between 7286 ex-
perimentally verified TSSs and their CDS starts. Figure 4
indicates that in contrast with intergenic miRNAs, the
50
UTR lengths of 7286 protein-coding genes are nearly
within 50 bps to 100 bps, results of which correspond to
a previous study (46).
Moreover, this work compared putative TSSs identified
by our SVM model with experimentally verified TSSs
from previous efforts. First, the miRNA cluster
hsa-miR-23a$27a$24-2 was examined and the putative
TSS located 1821 bp upstream of the hsa-miR-23a precur-
sor was obtained with a score of 0.94935. This observation
markedly differs from the position verified experimentally
in a previous study (18). Although the SVM model
identified a putative TSS near the position reported by
Lee et al. (47), that TSS is not included in the list of ten
TSS candidates. Next, putative TSSs of miR-146a and
miR-146b in miRStart were compared with the reported
loci. miRStart identified miR-146a TSS located 17 115 bp
upstream of its precursor, which perfectly matches the ex-
perimentally verified TSS. With regard to miR-146b, the
TSS candidate located 813 bp upstream of its precursor is
quite near the verified one. Another intergenic miRNA
examined in this work is hsa-miR-21. Cai et al. (48)
indicated that the TSS of hsa-miR-21 is located 2445 bp
upstream of its precursor, whereas a different TSS was
identified of the longer distance about 3300 bp.
According to our results, the putative TSS is located
3300 bp upstream of the precursor and overlaps with the
protein-coding gene, TMEM49. Notably, many positive
regions have a high probability ranging from 1 to
4500 bp upstream of the hsa-mir-21 precursor, as
identified by the SVM model. This finding reveals that
hsa-mir-21 gene may have multiple TSSs. Supplementary
Table S5 summarizes more putative TSSs overlap with
annotated genes for reference.
In addition to the putative miRNA TSSs suggested in
miRStart, the user-friendly web resource allows scientists
to customize their preferable miRNA TSSs based on a
straightforward display of CAGE tags, TSS Seq tags
and H3K4me3 modification. After the representative
TSS for each miRNA gene is selected, miRStart offers
the 5000 bp-long upstream sequence of that TSS. Users
can download miRNA promoter sequences and search
for possible cis- and trans-elements within them in a
relevant database such as JASPAR (49).
Experimental validation of putative miR-122
TSS/promoter
To estimate the reliability of putative miRNA TSSs from
miRStart resource, hsa-mir-122 was selected to perform
the validation process. Investigations have been shown
that this liver-specific miRNA is significantly down-
regulated in hepatocellular carcinoma and profoundly
impacts carcinogenesis (38). Figure 5A illustrates the oc-
currence distribution of experimental evidence within the
50 kb upstream region of pre-miR-122 in miRStart web
interface. The putative miR-122 TSS identified by SVM
model is located at 56113494 (4812 bp upstream of the
precursor).
Hsa-mir-122 is an intergenic miRNA located at
18q21.31. Previously we successfully ectopically expressed
mature miR-122 from a 562-bp cDNA fragment encom-
passing 54 269 034–54 269 595 bp of 18q21.31 (UCSC
Genome Browser NCBI36/hg18 Assembly) subcloned in
the lentiviral expression vector (38). In order to determine
the full-length pri-mir-122, we first enriched the abun-
dance of the primary transcripts by reducing the endogen-
ous level of DGCR8 with RNAi approach. As shown in
Figure 6, knockdown of DGCR8 resulted in the
Figure 3. System flow of miRStart.
9350 Nucleic Acids Research, 2011, Vol. 39, No. 21
7. accumulation of pri-miR-122 and reduction of mature
miR-122. In the upstream region from this 562-bp
fragment, an EST clone R01863 which was derived from
a cDNA library of human fetal liver and spleen origin
(Soares fetal liver spleen 1NFLS) was identified. Using
the primers R01863_F0
and 122_R0
, a distinct 2 kb
fragment from the total RNA prepared from DGCR8-
knockdown HuH7 cells was obtained (Figure 6D).
Nucleotide sequencing results showed that this 2 kb frag-
ment contains R01863 and pre-miR-122 sequences. We
then performed the 50
RLM-RACE with poly+ RNA
derived from DGCR8-knockdown HuH7 cells with a
gene-specific primer R01863_R0
. A DNA fragment of ap-
proximate 350 bp in length was cloned. The nucleotide
sequences revealed the potential TSS and an intron of
2969 bp in length (Figure 6E). We further performed 30
RLM-RACE reactions and revealed three transcripts of
2770 nucleotides, 2944 nucleotides and 3078 nucleotides in
length. Three poly adenylation sites were mapped. The
gene structure of full-length pri-miR-122 is illustrated in
Supplementary Figure S5.
Characterization of the pri-mir-122 promoter
To functionally characterize the pri-mir-122 promoter, the
genomic fragments containing the putative core promoter
region and the upstream regions were subcloned into
pGL3-basic vector (Figure 7A). The reporter constructs
were subsequently transfected into two HCC cell lines,
HuH7 and Hep3B, as well as human embryonic kidney
cell line, HEK293T. As a positive control for the promoter
reporter assay, the construct containing the core promoter
of neuropilin-1 (pGL3-NRP1) (37) was used. As shown in
Figure 7B and C, significant increase of luciferase activity
was detected in the constructs containing U fragment (À1
to À182), U1 fragment (À1 to À391), U2 fragment (À375
to À1358) and U12 fragment (À1 to À1358) in both HuH7
cells and Hep3B cells but not in the U3 fragment (À1329
to À2221). The U fragment elicited strongest activation of
45-fold and 5-fold in HuH7 and Hep3B cells, respectively.
The difference in induction is due to the poor transfection
efficiency of Hep3B cells. Notably, none of the pri-mir-122
promoter constructs directed luciferase gene activity in
HEK293T cells, suggesting a preferential activation of
the pri-mir-122 promoter in the context of hepatocytes
(Figure 7D). Within the core promoter region (À1 to
À182), two TATA boxes were identified. We mutated
each of the TATA boxes (Figure 8A) and measured
luciferase activity following transfection to HuH7 cells.
Mutation of TATA1 and TATA2 led to reductions
of 20% and 44% of activity, respectively (Figure 8B).
Table 1. Partial list of intergenic miRNA TSSs identified by SVM model in miRStart
miRNA/miRNA cluster Genomic
coordinates
Putative
TSS
Distance
from
precursor
Supporting evidences
No. of
CAGE
tags
No. of
TSS tags
H3K4me3 ESTs Conservation
hsa-mir-9-3 Chr15: 89911248 [+] 89905739 5509 56 11 + +
hsa-mir-223 ChrX: 65238712 [+] 65235302 3410 92 10 + +
hsa-mir-183$96$182 Chr7: 129414854 [À] 129420061 5207 27 + +
hsa-mir-3132 Chr2: 220413869 [À] 220462760 48891 2 + +
hsa-mir-196a-2 Chr12: 54385522 [+] 54380426 5096 278 5 + +
hsa-mir-3193 Chr20: 30194989 [+] 30161116 33873 24 40 + +
hsa-mir-3142$146a Chr5: 159901409 [+] 159895244 6165 686 37 + +
hsa-mir-130a Chr11: 57408671 [+] 57405960 2711 81 54 + +
hsa-mir-548o Chr7: 102046302 [À] 102074066 27764 675 + +
hsa-mir-9-2 Chr5: 87962757 [À] 87980642 17885 4171 + +
hsa-mir-190b Chr1: 154166219 [À] 154209596 43377 2198 + +
hsa-mir-3167 Chr11: 126858438 [À] 126870487 12049 1 + +
hsa-mir-124-2 Chr8: 65291706 [+] 65285788 5918 2 5 + +
hsa-mir-143$145 Chr5: 148808481 [+] 148786413 22068 2689 2 + +
hsa-mir-1470 Chr19: 15560359 [+] 15511768 48591 251 21 + +
hsa-mir-193b$365-1 Chr16: 14397824 [+] 14396078 1746 37 14 + +
hsa-mir-1244-2 Chr5: 118310281 [+] 118310172 109 12 + +
hsa-mir-659 Chr22: 38243781 [À] 38273766 29985 225 + +
hsa-mir-146b Chr10: 104196269 [+] 104179511 16758 2 26 + +
hsa-mir-324 Chr17: 7126698 [À] 7141111 14413 4544 + +
hsa-mir-200c$141 Chr12: 7072862 [+] 7036976 35886 21 5928 6 + +
hsa-mir-142 Chr17: 56408679 [À] 56409879 1200 12 + +
hsa-mir-1305 Chr4: 183090446 [+] 183065816 24630 82 1 + +
hsa-mir-607 Chr10: 98588521 [À] 98592266 3745 3 + +
hsa-mir-29b-1$29a Chr7: 130562298 [À] 130596999 34701 100 + +
hsa-mir-21 Chr17: 57918627 [+] 57915327 3300 1 28 + +
hsa-mir-181c$181d Chr19: 13985513 [+] 13976434 9079 2 10 + +
hsa-mir-122 Chr18: 56118306 [+] 56113494 4812 18 1 + +
hsa-mir-563 Chr3: 15915278 [+] 15901463 13815 36 33 + +
hsa-mir-200b$200a$429 Chr1: 1102484 [+] 1098321 4163 15 2 + +
All TSSs are listed in Supplementary Table S4.
Nucleic Acids Research, 2011, Vol. 39, No. 21 9351
8. This result further confirmed the core promoter of
pri-mir-122 gene.
DISCUSSION
Precisely identifying miRNA TSSs is essential for facilitat-
ing the discovery of TF-miRNA regulatory relationships
and for further elucidating the transcriptional regulation
of miRNA expressions. Owing to this significance, an
increasing number of investigations have attempted to
identify the miRNA promoter by using either a computa-
tional or experimental approach. Although chromatin sig-
nature is normally used to locate miRNA promoters,
numerous miRNA promoters still remain unclear (25–28).
Rather than using a single TSS signature, miRStart suc-
cessfully integrates three next-generation sequencing
(NGS) datasets derived from TSS-related experiments to
determine the TSS of human miRNAs. Additionally, a
SVM-based model is developed to determine the TSS can-
didates for each miRNA gene systematically, thus
providing users the most probable miRNA TSSs with ex-
perimental evidences for deciphering the transcriptional
regulation of miRNA expressions.
Although miRStart identified most human miRNA
TSSs, 92 intergenic miRNAs still have no putative TSS,
which is attributed to the following reasons. First, their
TSSs may be outside the 50 kb upstream regions from
precursors. miRStart did not analyze the range beyond
50 kb because a previous study surveyed microarray ex-
pression profiles of 175 human miRNAs, indicating that
two miRNAs 50 kb-long apart are co-expressed and
share the common primary transcript (30). Second,
although most intergenic miRNAs are transcribed by
RNA polymerase II, Borchert et al. (20) found that Alu
elements upstream of C19MC miRNAs retain sequences
deemed essential for Pol III activity, concluding that RNA
polymerase III can also transcribe human miRNAs.
Interestingly, rather than Pol III transcription, a recent
study demonstrated that C19MC miRNAs are processed
from introns of large Pol II, non-protein-coding tran-
scripts, thus contradicting the previous finding (21). In
fact, miRStart failed to obtain putative TSSs for most of
C19MC miRNAs because of sparse tag signals in their
upstream regions. Evan if the TSSs are determined, the
SVM scores are still very low, i.e. miR-515-1 and
miR-517a. It reflects the limitation that derived from the
50
-end sequences after cap structures, CAGE tags and TSS
Seq tags cannot detect TSS signals if miRNAs are merely
transcribed by RNA polymerase III. Third, pri-miRNA
has too low of a concentration for detection when per-
forming NGS, for example, miR-187. Low-concentration
pri-miRNAs lack a TSS-relevant signal unless the gene
encoded Drosha is eliminated to obtain more primary
transcripts of miRNAs for NGS. Finally, the TSS
signals in the upstream region of miRNA precursors are
not identified by the SVM model even if they are obvious,
for example, miR-1179. According to the occurrence dis-
tribution of TSS evidence, the putative TSS of miR-1179
may be located 3000 bp upstream of its precursor
(Supplementary Figure S6).
In addition to officially defining intragenic miRNA
TSSs by the transcription initiation of their host genes,
miRStart provides novel TSSs for intragenic miRNA
genes because previous investigations indicated that sev-
eral miRNAs do not share common promoters with their
host genes due to their inconsistent expression patterns
(26,28,45). Those studies further demonstrated that some
intragenic miRNA genes may possess individual TSS
based on the experimental TSS signals near the upstream
of miRNA precursors. For instance, the TSS of
miR-99a$let-7c is defined by their host gene C21orf34
(Genomic coordinates Chr21: 17442842 [+]) and is far
from the miR-99a precursor (Genomic coordinates
Chr21: 17911409-17911489 [+]). According to the occur-
rence distribution of TSS evidence in the upstream region
of miR-99a precursor, CAGE tags and TSS Seq tags are
aggregated at 17907551, where 5 ESTs are nearby and the
conservation score is extremely high (Supplementary
Figure S7). Rather than the TSS of C21orf34, the genomic
site located 3858 bp upstream of the miR-99a precursor is
most likely the genuine TSS of miR-99a$let-7c.
As is well known, CAGE tags and TSS Seq tags are
obtained from various human tissues and cell lines.
miRStart generally identifies miRNA TSSs based on the
tag occurrence distributions to obtain the entire view of
TSS candidates. To estimate how much of an effect of
datasets from different tissues/cell lines has on the SVM
classifier, we compared the output of the original SVM
model with a tissue-specific SVM model. The most
Figure 4. Statistical comparison of intergenic miRNA genes and
protein-coding genes. (Upper) The distances between intergenic
miRNA TSSs and their precursors significantly fluctuate from
100 bp to 50 kb. (Lower) The 50
-UTR lengths of 7286 protein-coding
genes are nearly within 50–100 bp.
9352 Nucleic Acids Research, 2011, Vol. 39, No. 21
9. typical example is miR-122, a liver-specific miRNA signifi-
cantly down-regulated in hepatocellular carcinoma (38).
No matter what SVM models are used, the putative TSS
of miR-122 is identified at the same genomic locus. Even if
miR-122 is liver-specific, the original SVM model still
performs well. However, the putative TSS selected by
SVM model is more obvious and authentic if only
liver-specific CAGE tags and TSS Seq tags distributed in
the upstream region of miR-122 precursor are considered
(Figure 5B). This is the reason why the function displaying
specific CAGE tags or TSS Seq tags in miRStart was
designed for users.
Based on the 50
RACE procedure and luciferase reporter
assay, this work verifies the genuine miR-122 TSS located
4812 bp upstream of its precursor, which definitely
matches the putative one. However, the TSS markedly
differs from that in a previous study (27). Barski et al.
indicated that the TSS of miR-122 gene is located at
56105891 (À12415 from precursor), whereas our TSS is
at 56113494 (À4812 from precursor). Actually, that
study identified miR-122 promoters by only using chro-
matin signitures from ChIP-seq data. In addition to using
the chromatin signitures (H3K4me3), we also combine
CAGE tags and TSS Seq tags to identify miR-122 TSS.
This work also differs from Barski et al. in that the latter
performed 50
RACE and promoter–reporter assay of
miR-122 promoter using total CD4+
T cells and detected
the acceptable luciferase activity. Nevertheless, miR-122 is
Figure 5. Identification of hsa-miR-122 TSS. (A) CAGE tags, TSS Seq tags, H3K4me3 modification, ESTs and conservation patterns are clearly
displayed in the 50 kb upstream region of hsa-miR-122. The red line in the block of putative TSS denotes the representative TSS, whereas the blue
lines denote other TSS candidates of hsa-miR-122. (B) Only liver-specific CAGE tags and TSS Seq tags (overlapped in dotted blue circle) are shown
in the upstream region of miR-122 precursor.
Nucleic Acids Research, 2011, Vol. 39, No. 21 9353
10. Figure 6. Mapping of TSS of pri-miR-122 gene by 50
RLM-RACE. (A) Suppression of DGCR8 mRNA expression in HuH7 cells by RNA inter-
ference. Five shDGCR8 lentiviral preparations were tested. #1 (TRCN0000159003) which showed the best knockdown efficiency was chosen for this
work. Knockdown of DGCR8 resulted in an enrichment of pri-miR-122 (B) and drastic depletion of mature miR-122. (C) Expression of pri-miR-122
and miR-122 was detected by RT–PCR and northern blotting, respectively. The sequences of the RT–PCR primers were listed in Supplementary
Table S2. (D) Total RNA from HuH7 cells with or without DGCR8 knockdown (shDG) was reverse transcribed and amplified by PCR using the
primers, R01863_F’ and R01863_R’. A distinct 2 kb fragment (arrow) was detected in DGCR8-knockdown HuH7 cells. Marker (M) sizes in base
pairs are indicated. Small arrow in (E) marked the 50
end of R01863_F’ primer. (E) The transcription unit of pri-miR-122 at 18q21.31 has a small
exon 1 of 78 bp, a large intron of 2969 bp and exon 2. (F) The TSS (+1) based on 50
RLM-RACE data. Two putative TATA boxes and two CCAAT
boxes were marked in the upstream region.
B DCHuH7 293THep3B
A
hsa-mir-122
+1
U1
U2
U12
U3
U-182
-391
-1358/-375
-1358
-2221/-1329
Pre-miR-122: 56118306-56118390
-2000 -1500 -1000 -500
Figure 7. The activity of the pri-mir-122 promoter in cultured HCC cells. (A) Genomic segments (U1, U2, U3 and U12) of the upstream region were
subcloned in pGL3-basic construct (grey bar) for promoter analysis in (B) HuH7, (C) Hep3B and in (D) 293T cells. The luciferase activity was
measured 48 h after transfection. NRP1 promoter was used as a positive control. The transfection efficiency was normalized against pRL-TK activity.
Normalized luciferase activity from triplicate samples is presented relative to that of cells transfected with the pGL3-basic construct (white bar). The
experiment was repeated twice with same results. *P 0.05; **P 0.01; ***P 0.001.
9354 Nucleic Acids Research, 2011, Vol. 39, No. 21
11. a liver-specific miRNA and is not expressed in other
tissues. Conversely, in this work, human HCC cell line,
HuH7 was used to perform 50
RACE and luciferase
reporter assay, subsequently obtaining a reliable and un-
controversial miR-122 TSS while satisfying promoter
activity.
In conclusion, miRStart is a valuable resource for biolo-
gists in advanced research in miRNA-mediated regulatory
networks. The main contribution of miRStart is to inte-
grate three experimental-based datasets including CAGE
tags, TSS Seq tags and H3K4me3 chromatin signature
and define miRNA TSSs according to the distribution
of tags derived from high-throughput sequencing
analysis (because each tag represents a possible TSS
signal). The SVM is a strategy to automatically identify
putative miRNA TSSs instead of manually selecting by
users. Limited to no relevant dataset derived from
CAGE, TSS Seq, and ChIP-Seq (H3K4me3) is available
for other organisms, miRStart can provide miRNA TSSs
in the human genome currently. Although FANTOM4
has published the mouse CAGE datasets, DBTSS offers
only one mouse TSS Seq dataset (mouse 3T3 solexa
tag mapping data) in the database. It is inadequate to
define miRNA TSSs for the SVM. We believe that more
and more high-throughput sequencing data will be gene-
rated and render miRStart more complete in the near
future.
SUPPLEMENTARY DATA
Supplementary Data are available at NAR Online.
ACKNOWLEDGEMENT
Ted Knoy is appreciated for his editorial assistance.
FUNDING
National Science Council of the Republic of China
(Contract No. NSC 98-2311-B-009-004-MY3 and NSC
99-2627-B-009-003); UST-UCSD International Center of
Excellence in Advanced Bio-engineering sponsored by the
Taiwan National Science Council I-RiCE Program
(NSC-99-2911-I-010-101, in part); MOE ATU (in part).
Funding for open access charge: National Science
Council of the Republic of China.
Conflict of interest statement. None declared.
REFERENCES
1. Bartel,D.P. (2004) MicroRNAs: genomics, biogenesis, mechanism,
and function. Cell, 116, 281–297.
2. Alvarez-Garcia,I. and Miska,E.A. (2005) MicroRNA functions in
animal development and human disease. Development, 132,
4653–4662.
3. Calin,G.A. and Croce,C.M. (2006) MicroRNA signatures in
human cancers. Nat. Rev. Cancer, 6, 857–866.
4. Enright,A.J., John,B., Gaul,U., Tuschl,T., Sander,C. and
Marks,D.S. (2003) MicroRNA targets in Drosophila.
Genome Biol., 5, R1.
5. John,B., Enright,A.J., Aravin,A., Tuschl,T., Sander,C. and
Marks,D.S. (2004) Human MicroRNA targets. PLoS Biol., 2,
e363.
6. Lewis,B.P., Shih,I.H., Jones-Rhoades,M.W., Bartel,D.P. and
Burge,C.B. (2003) Prediction of mammalian microRNA targets.
Cell, 115, 787–798.
7. Rehmsmeier,M., Steffen,P., Hochsmann,M. and Giegerich,R.
(2004) Fast and effective prediction of microRNA/target duplexes.
RNA, 10, 1507–1517.
8. Kertesz,M., Iovino,N., Unnerstall,U., Gaul,U. and Segal,E. (2007)
The role of site accessibility in microRNA target recognition.
Nat. Genet., 39, 1278–1284.
9. Papadopoulos,G.L., Reczko,M., Simossis,V.A., Sethupathy,P. and
Hatzigeorgiou,A.G. (2009) The database of experimentally
supported targets: a functional update of TarBase.
Nucleic Acids Res., 37, D155–D158.
10. Xiao,F., Zuo,Z., Cai,G., Kang,S., Gao,X. and Li,T. (2009)
miRecords: an integrated resource for microRNA-target
interactions. Nucleic Acids Res., 37, D105–D110.
11. Jiang,Q., Wang,Y., Hao,Y., Juan,L., Teng,M., Zhang,X., Li,M.,
Wang,G. and Liu,Y. (2009) miR2Disease: a manually curated
database for microRNA deregulation in human disease.
Nucleic Acids Res., 37, D98–D104.
12. Hsu,S.D., Lin,F.-M., Wu,W.-Y., Liang,C., Huang,W.-C.,
Chan,W.-L., Tsai,W.-T., Chen,G.-Z., Lee,C.-J., Chiu,C.-M. et al.
(2011) miRTarBase: a database curates experimentally validated
microRNA-target interactions. Nucleic Acids Res., 39,
D163–D169.
13. Yu,X., Lin,J., Zack,D.J., Mendell,J.T. and Qian,J. (2008) Analysis
of regulatory network topology reveals functionally distinct
classes of microRNAs. Nucleic Acids Res., 36, 6494–6503.
14. Bandyopadhyay,S. and Bhattacharyya,M. (2009) Analyzing
miRNA co-expression networks to explore TF-miRNA regulation.
BMC Bioinformatics, 10, 163.
15. Re,A., Cora,D., Taverna,D. and Caselle,M. (2009) Genome-wide
survey of microRNA-transcription factor feed-forward regulatory
circuits in human. Mol. Biosyst., 5, 854–867.
16. Shalgi,R., Lieber,D., Oren,M. and Pilpel,Y. (2007) Global and
local architecture of the mammalian microRNA-transcription
factor regulatory network. PLoS Comput. Biol., 3, e131.
Figure 8. Deletion analysis of the pri-mir-122 core promoter.
(A) Schematic representation of the deletion mutants of TATA boxes,
mTATA1 and mTATA2. (B) Luciferase activity of the promoter con-
structs transfected into HEK293T cells. Data shown represent three
independent experiments The transfection efficiency was normalized
against pRL-TK activity. Normalized luciferase activity from triplicate
samples is presented relative to that of cells transfected with the
pGL3-basic construct (white bar). *P 0.05; **P 0.01; ***P 0.001.
Nucleic Acids Research, 2011, Vol. 39, No. 21 9355
12. 17. Wang,J., Lu,M., Qiu,C. and Cui,Q. (2010) TransmiR: a
transcription factor-microRNA regulation database.
Nucleic Acids Res., 38, D119–D122.
18. Lee,Y., Kim,M., Han,J., Yeom,K.H., Lee,S., Baek,S.H. and
Kim,V.N. (2004) MicroRNA genes are transcribed by RNA
polymerase II. EMBO J., 23, 4051–4060.
19. Cai,X., Hagedorn,C.H. and Cullen,B.R. (2004) Human
microRNAs are processed from capped, polyadenylated
transcripts that can also function as mRNAs. RNA, 10,
1957–1966.
20. Borchert,G.M., Lanier,W. and Davidson,B.L. (2006)
RNA polymerase III transcribes human microRNAs.
Nat. Struct. Mol. Biol., 13, 1097–1101.
21. Bortolin-Cavaille,M.L., Dance,M., Weber,M. and Cavaille,J.
(2009) C19MC microRNAs are processed from introns of large
Pol-II, non-protein-coding transcripts. Nucleic Acids Res., 37,
3464–3473.
22. Saini,H.K., Griffiths-Jones,S. and Enright,A.J. (2007)
Genomic analysis of human microRNA transcripts.
Proc. Natl Acad. Sci. USA, 104, 17719–17724.
23. Zhou,X., Ruan,J., Wang,G. and Zhang,W. (2007)
Characterization and identification of microRNA core promoters
in four model species. PLoS Comput. Biol., 3, e37.
24. Saini,H.K., Enright,A.J. and Griffiths-Jones,S. (2008) Annotation
of mammalian primary microRNAs. BMC Genomics, 9, 564.
25. Marson,A., Levine,S.S., Cole,M.F., Frampton,G.M.,
Brambrink,T., Johnstone,S., Guenther,M.G., Johnston,W.K.,
Wernig,M., Newman,J. et al. (2008) Connecting microRNA genes
to the core transcriptional regulatory circuitry of embryonic stem
cells. Cell, 134, 521–533.
26. Corcoran,D.L., Pandit,K.V., Gordon,B., Bhattacharjee,A.,
Kaminski,N. and Benos,P.V. (2009) Features of mammalian
microRNA promoters emerge from polymerase II chromatin
immunoprecipitation data. PLoS ONE, 4, e5279.
27. Barski,A., Jothi,R., Cuddapah,S., Cui,K., Roh,T.Y., Schones,D.E.
and Zhao,K. (2009) Chromatin poises miRNA- and
protein-coding genes for expression. Genome Res., 19, 1742–1751.
28. Ozsolak,F., Poling,L.L., Wang,Z., Liu,H., Liu,X.S., Roeder,R.G.,
Zhang,X., Song,J.S. and Fisher,D.E. (2008) Chromatin structure
analyses identify miRNA promoters. Genes Dev., 22, 3172–3183.
29. Griffiths-Jones,S., Saini,H.K., van Dongen,S. and Enright,A.J.
(2008) miRBase: tools for microRNA genomics. Nucleic Acids
Res., 36, D154–D158.
30. Baskerville,S. and Bartel,D.P. (2005) Microarray profiling of
microRNAs reveals frequent coexpression with neighboring
miRNAs and host genes. RNA, 11, 241–247.
31. Flicek,P., Aken,B.L., Ballester,B., Beal,K., Bragin,E., Brent,S.,
Chen,Y., Clapham,P., Coates,G., Fairley,S. et al. (2010)
Ensembl’s 10th year. Nucleic Acids Res., 38, D557–D562.
32. Kawaji,H., Severin,J., Lizio,M., Waterhouse,A., Katayama,S.,
Irvine,K.M., Hume,D.A., Forrest,A.R., Suzuki,H., Carninci,P.
et al. (2009) The FANTOM web resource: from mammalian
transcriptional landscape to its dynamic regulation. Genome Biol.,
10, R40.
33. Yamashita,R., Wakaguri,H., Sugano,S., Suzuki,Y. and Nakai,K.
(2010) DBTSS provides a tissue specific dynamic view of
Transcription Start Sites. Nucleic Acids Res., 38, D98–D104.
34. Barski,A., Cuddapah,S., Cui,K., Roh,T.Y., Schones,D.E.,
Wang,Z., Wei,G., Chepelev,I. and Zhao,K. (2007) High-resolution
profiling of histone methylations in the human genome. Cell, 129,
823–837.
35. Rhead,B., Karolchik,D., Kuhn,R.M., Hinrichs,A.S., Zweig,A.S.,
Fujita,P.A., Diekhans,M., Smith,K.E., Rosenbloom,K.R.,
Raney,B.J. et al. (2010) The UCSC Genome Browser database:
update 2010. Nucleic Acids Res., 38, D613–D619.
36. Chang,C.-C. and Lin,C.-J. (2001) LIBSVM: a library for support
vector machines, http://www.csie.ntu.edu.tw/$cjlin/libsvm (16
April 2011, date last accessed).
37. Liao,Y.L., Sun,Y.M., Chau,G.Y., Chau,Y.P., Lai,T.C.,
Wang,J.L., Horng,J.T., Hsiao,M. and Tsou,A.P. (2008)
Identification of SOX4 target genes using phylogenetic
footprinting-based prediction from expression microarrays
suggests that overexpression of SOX4 potentiates metastasis in
hepatocellular carcinoma. Oncogene, 27, 5578–5589.
38. Tsai,W.C., Hsu,P.W., Lai,T.C., Chau,G.Y., Lin,C.W., Chen,C.M.,
Lin,C.D., Liao,Y.L., Wang,J.L., Chau,Y.P. et al. (2009)
MicroRNA-122, a tumor suppressor microRNA that regulates
intrahepatic metastasis of hepatocellular carcinoma. Hepatology,
49, 1571–1582.
39. Shiraki,T., Kondo,S., Katayama,S., Waki,K., Kasukawa,T.,
Kawaji,H., Kodzius,R., Watahiki,A., Nakamura,M., Arakawa,T.
et al. (2003) Cap analysis gene expression for high-throughput
analysis of transcriptional starting point and identification
of promoter usage. Proc. Natl Acad. Sci. USA, 100,
15776–15781.
40. Carninci,P., Sandelin,A., Lenhard,B., Katayama,S.,
Shimokawa,K., Ponjavic,J., Semple,C.A., Taylor,M.S.,
Engstrom,P.G., Frith,M.C. et al. (2006) Genome-wide analysis of
mammalian promoter architecture and evolution. Nat. Genet., 38,
626–635.
41. Rodriguez,A., Griffiths-Jones,S., Ashurst,J.L. and Bradley,A.
(2004) Identification of mammalian microRNA host genes and
transcription units. Genome Res., 14, 1902–1910.
42. Wang,D., Lu,M., Miao,J., Li,T., Wang,E. and Cui,Q. (2009)
Cepred: predicting the co-expression patterns of the
human intronic microRNAs with their host genes. PLoS ONE, 4,
e4421.
43. Vapnik,V.N. (1995) The Nature of Statistical Learning Theory.
Springer-Verlag New York, Inc., 175 Fifth Avenue, New York,
NY 10010, USA.
44. Burges,C.J.C. (1998) A tutorial on support vector
machines for pattern recognition. Data Mining Knowl. Discov., 2,
121–127.
45. Monteys,A.M., Spengler,R.M., Wan,J., Tecedor,L., Lennox,K.A.,
Xing,Y. and Davidson,B.L. (2010) Structure and activity of
putative intronic miRNA promoters. RNA, 16, 495–505.
46. Suzuki,Y., Ishihara,D., Sasaki,M., Nakagawa,H., Hata,H.,
Tsunoda,T., Watanabe,M., Komatsu,T., Ota,T., Isogai,T. et al.
(2000) Statistical analysis of the 5’ untranslated region of human
mRNA using Oligo-Capped cDNA libraries. Genomics, 64,
286–297.
47. Taganov,K.D., Boldin,M.P., Chang,K.J. and Baltimore,D. (2006)
NF-kappaB-dependent induction of microRNA miR-146, an
inhibitor targeted to signaling proteins of innate immune
responses. Proc. Natl Acad. Sci. USA, 103, 12481–12486.
48. Fujita,S., Ito,T., Mizutani,T., Minoguchi,S., Yamamichi,N.,
Sakurai,K. and Iba,H. (2008) miR-21 Gene expression triggered
by AP-1 is sustained through a double-negative feedback
mechanism. J. Mol. Biol., 378, 492–504.
49. Bryne,J.C., Valen,E., Tang,M.H., Marstrand,T., Winther,O., da
Piedade,I., Krogh,A., Lenhard,B. and Sandelin,A. (2008)
JASPAR, the open access database of transcription factor-
binding profiles: new content and tools in the 2008 update.
Nucleic Acids Res., 36, D102–106.
9356 Nucleic Acids Research, 2011, Vol. 39, No. 21