Download to read offline


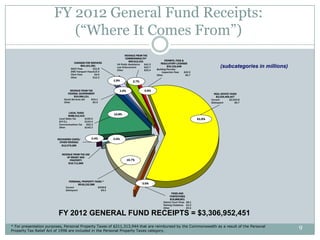

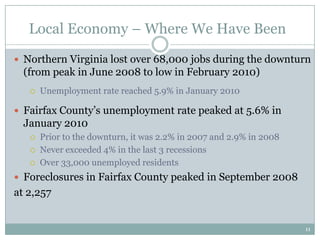
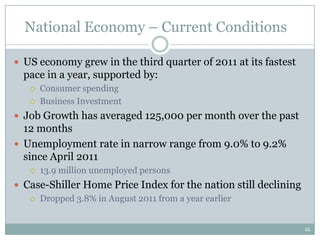
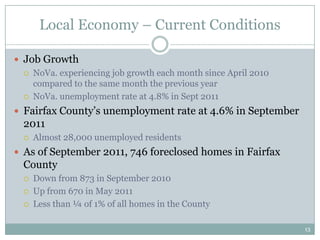
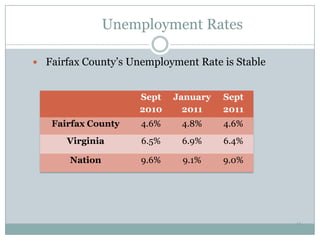

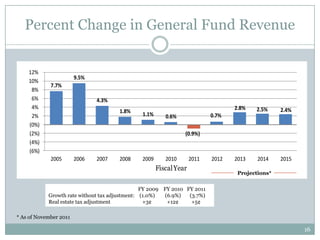
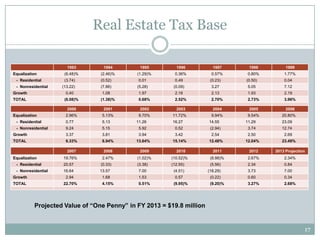


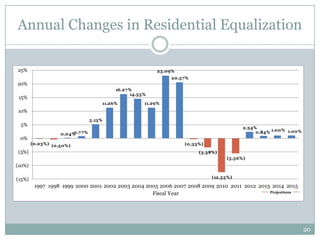
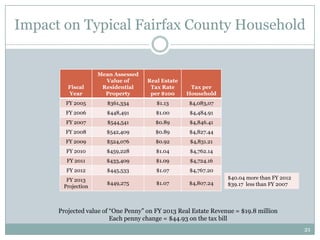

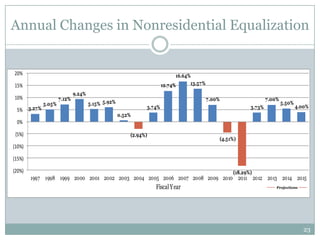
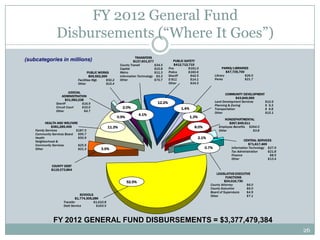
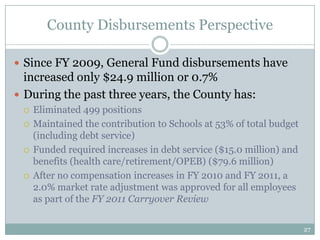

The document outlines the Fairfax County budget for fiscal year 2012, which totals $6.1 billion, with 61.6% of revenue derived from real estate taxes and significant funding allocated to public schools. It discusses the county's financial management strategies, including spending reductions and community input in budget decisions, while also reflecting on local and national economic conditions and future projections. Additionally, it provides data on real estate trends, unemployment rates, and expected impacts on households within the county.


