


![Dialogic innovatie ● interactie22
Although the increasing uniformization of dynamic behaviour (that is, the W3C language-
independent convention of representing and interacting with objects in [X]XHTML and XML
documents – the so-called Document Object Model or DOM) has facilitated the handling of
such dynamic behaviour by automated agents, it is still unreasonable to expect generic
web robots (such as generalized web search engines) to be able to access the often
complex underlying database structures.13
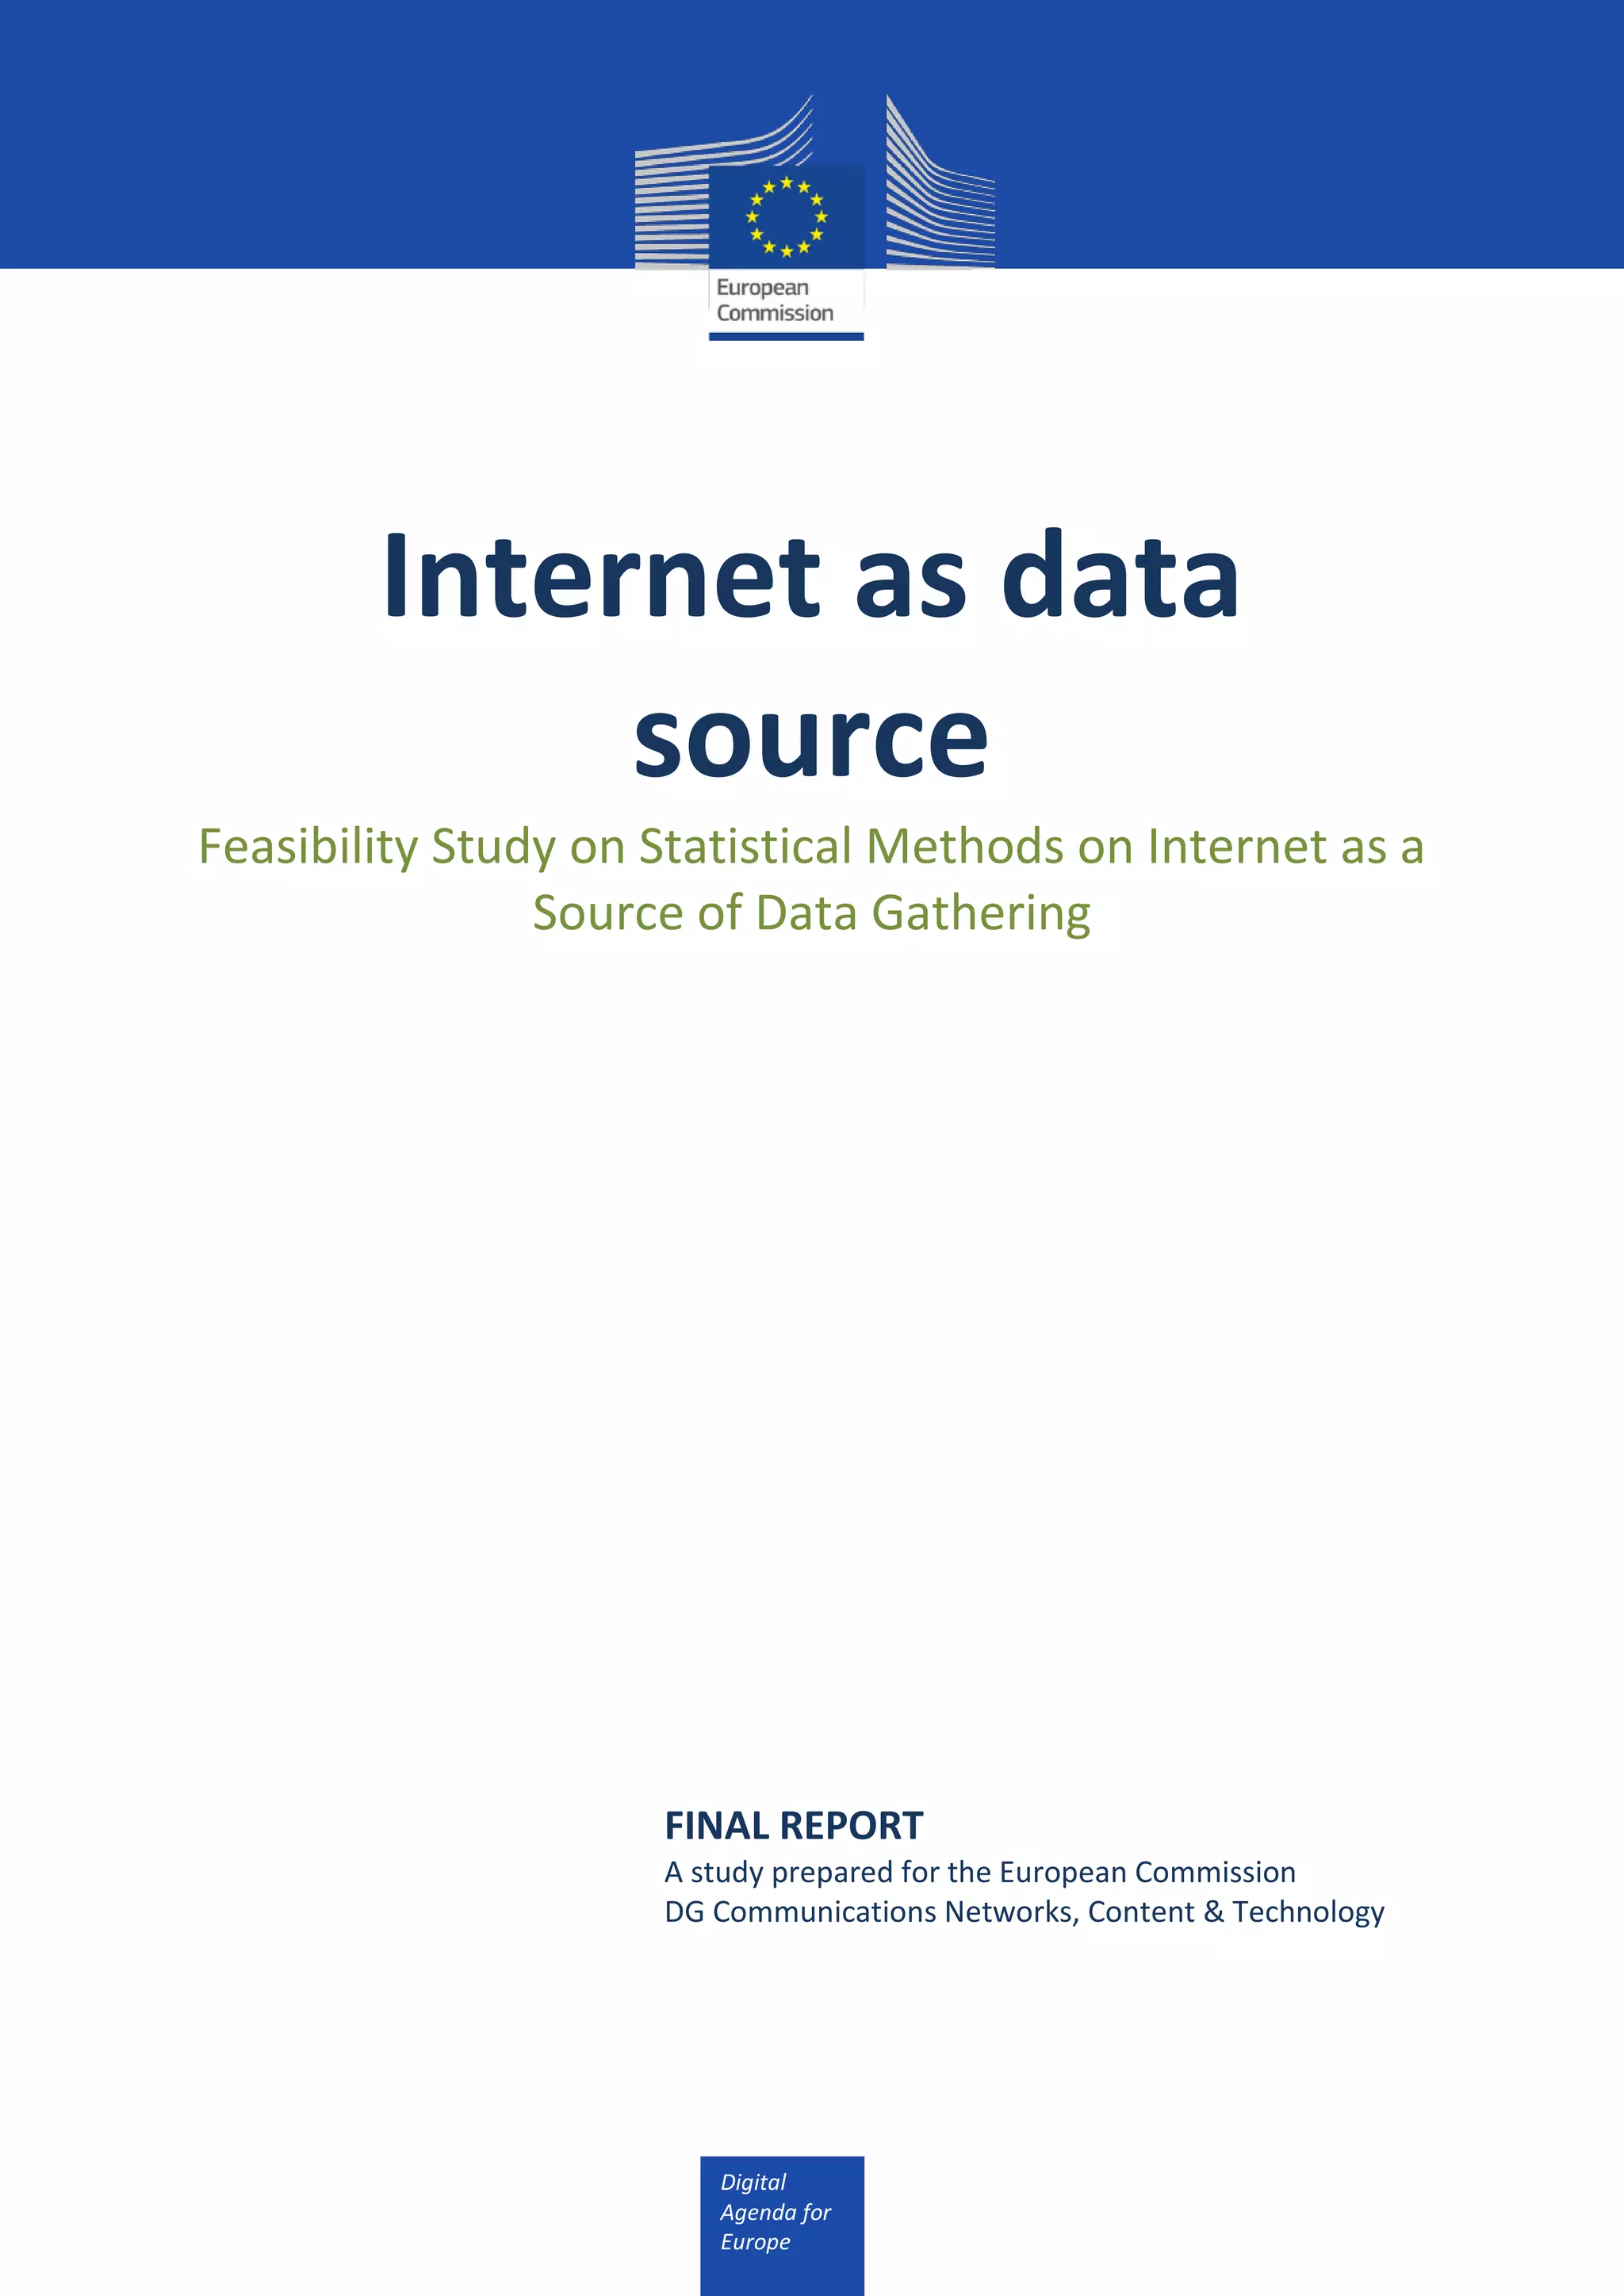
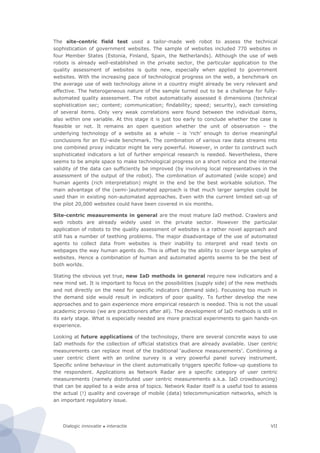
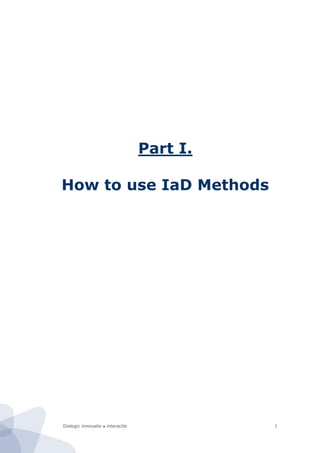
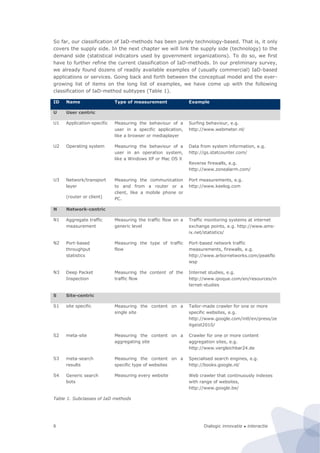
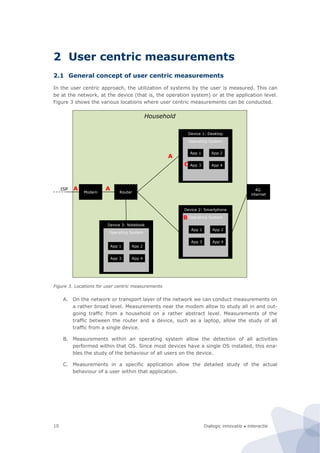
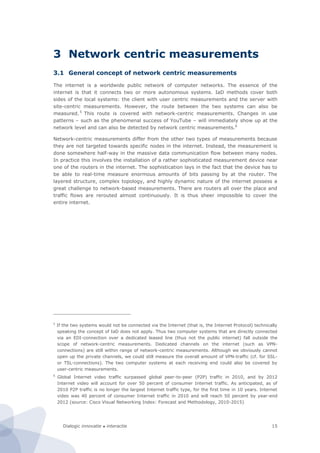
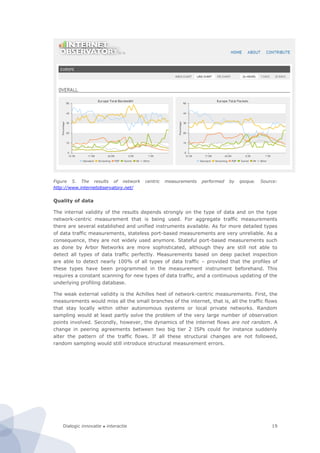
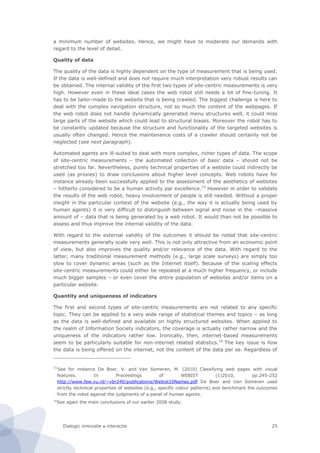
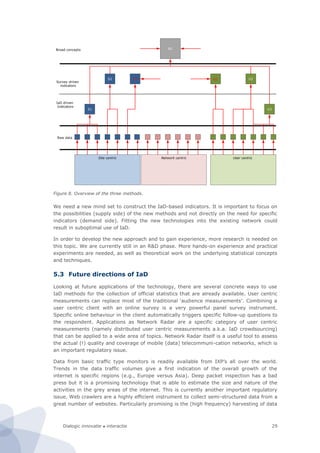
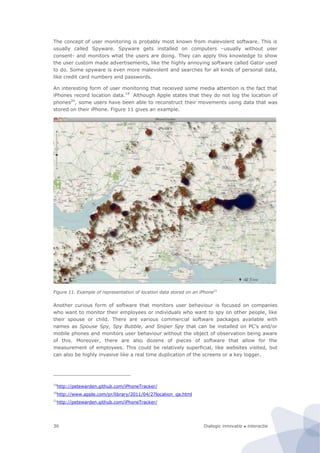
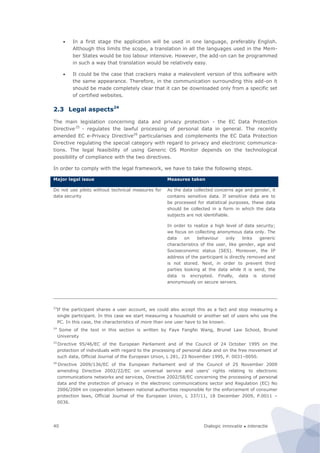
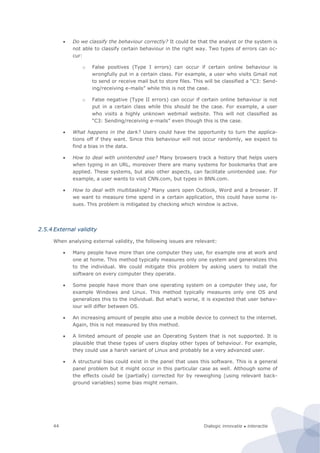
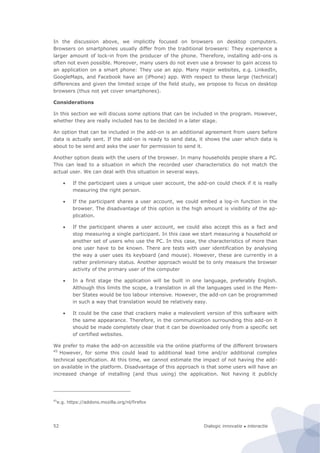
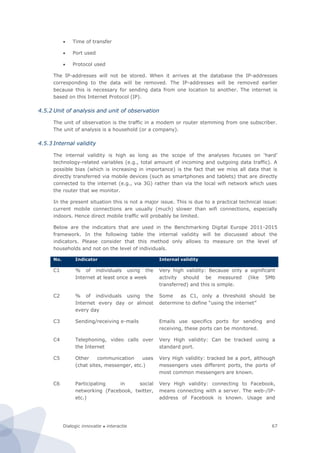
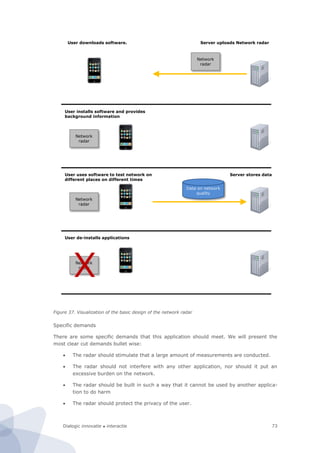
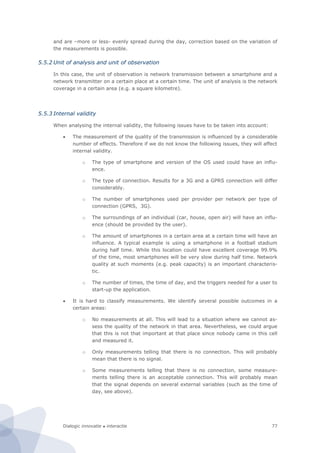
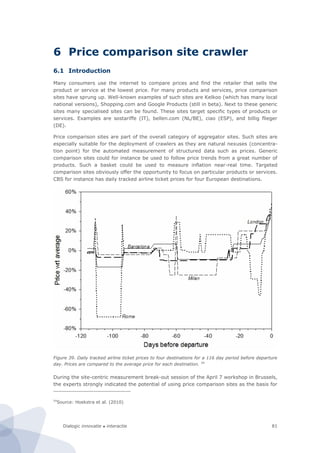
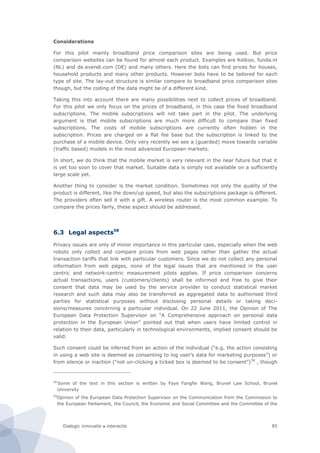
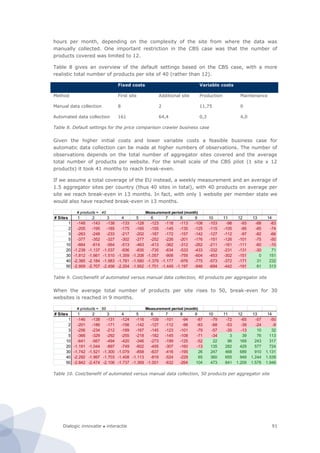
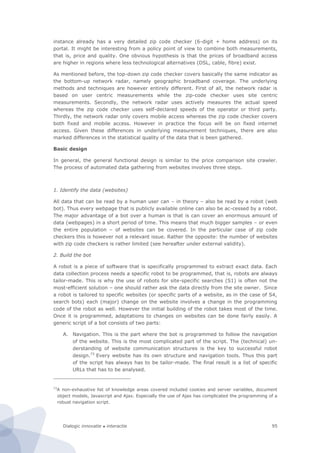
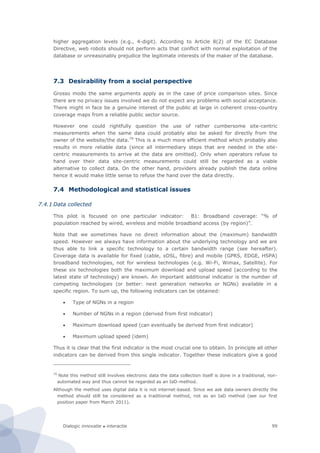
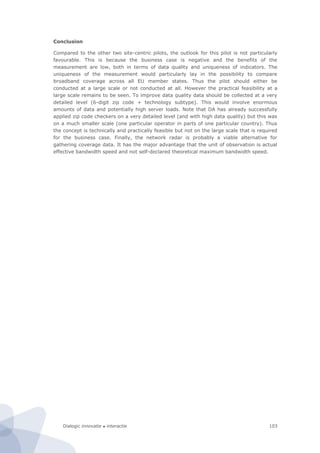
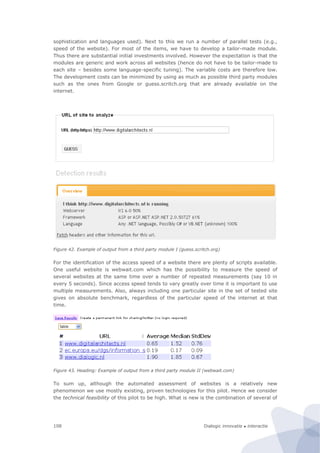
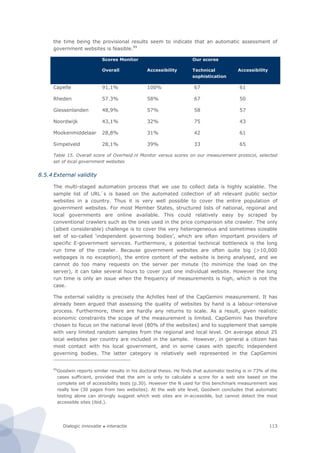
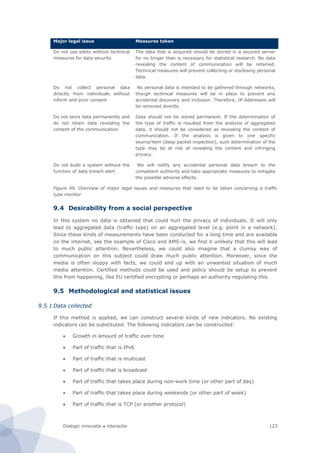
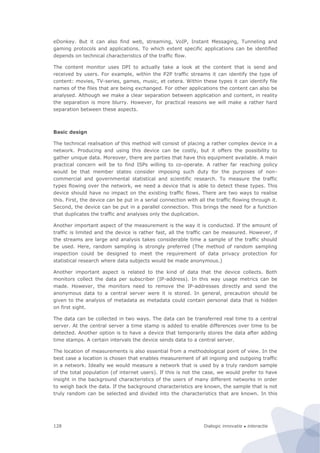
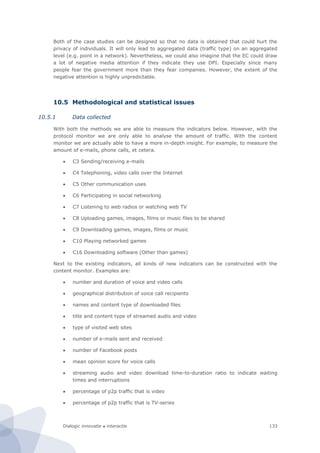
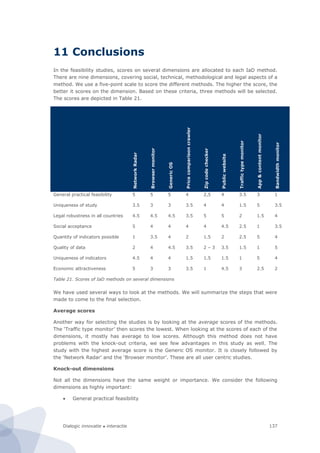
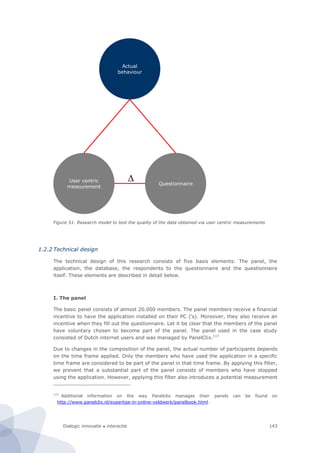
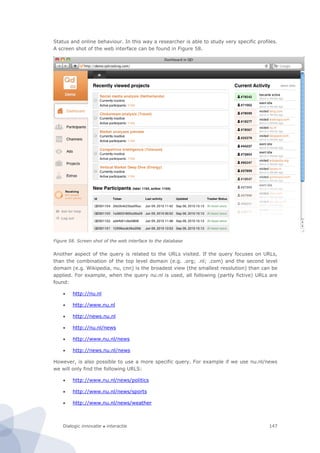
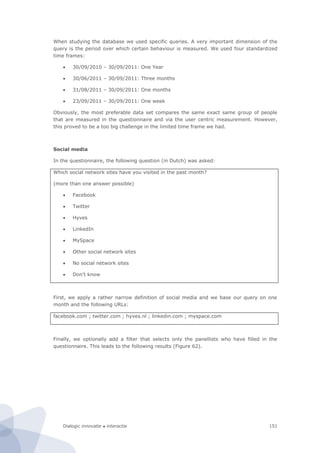
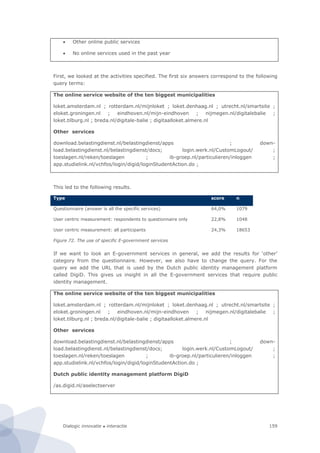
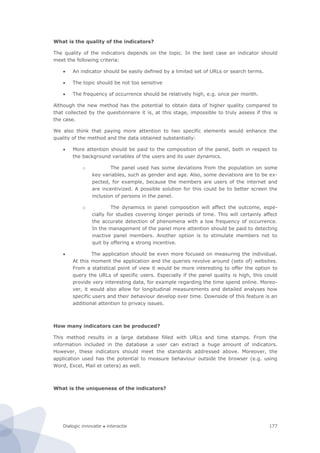
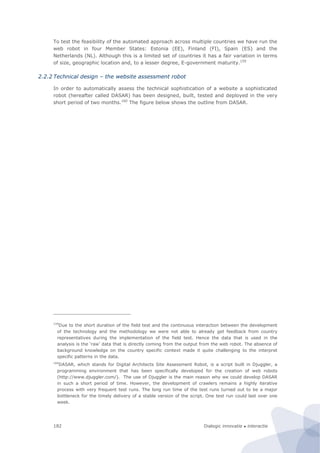
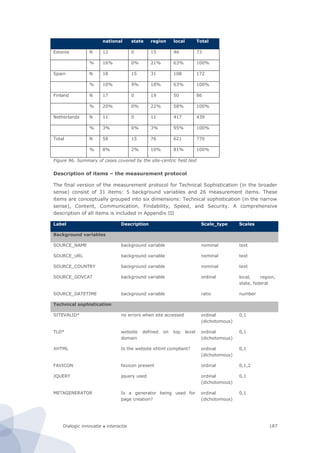
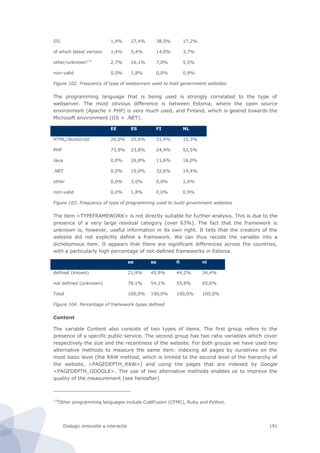
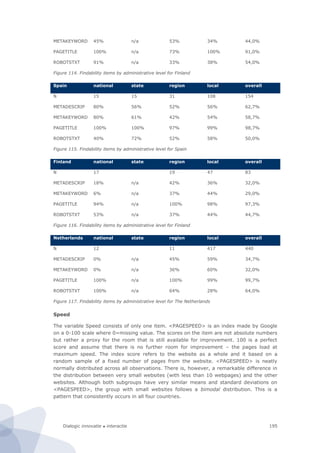
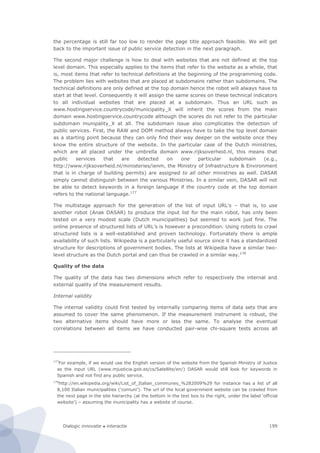
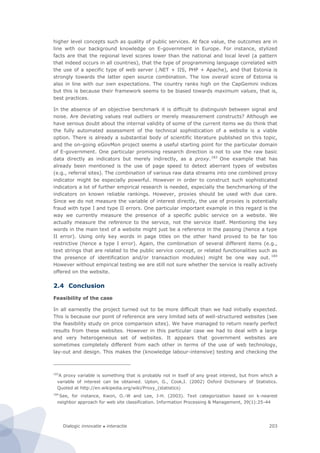
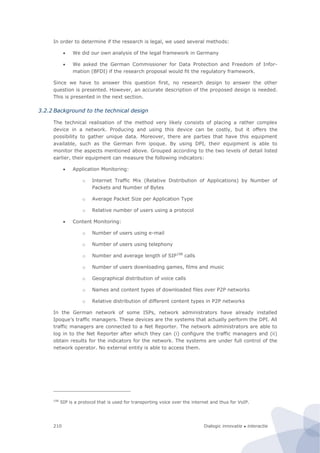
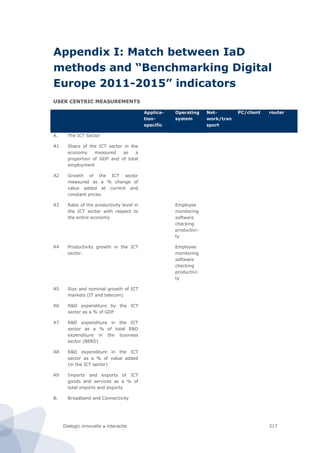
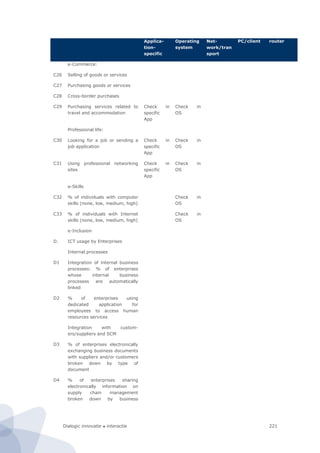
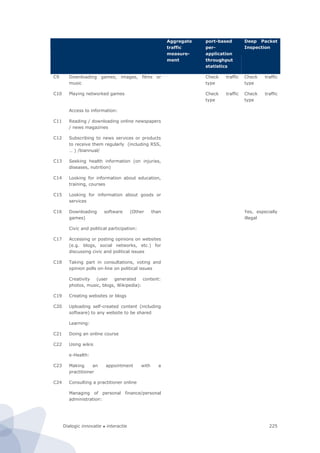
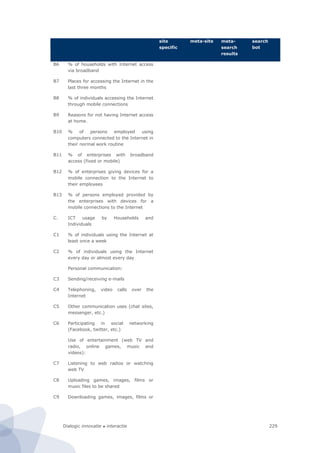
Figure 6. Basic architecture of site-centric measurements
During this project we have conducted three feasibility studies on site-centric measure-
ments, involving respectively a…
1. Price comparison site crawler
2. Broadband zip code checker
3. Public sector website assessment robot
The first two types of measurements are typical examples of queries on well-defined data
on highly-structured websites. The first robot crawls price lists of a great variety of
products. The second robot uses a web form (zip code checker) as front end access to the
underlying database. It repeatedly fills in another zip code in the crawler until it has
stepwise covered the entire set of (6 digit) postal codes. Both measurements are tailor-
made for one or two targeted websites. The third type of measurement is distinctively
different from the first two types of measurements (that could also be very well combined
in one measurement campaign). First, it is faced with much richer, ill-defined data. This
evokes many issues with regard to the emulation of a human agent. Secondly, it covers a
much larger, rather heterogeneous, set (over 700) of websites. In short, the automated
13
Konia, B.S. Make Your Dynamic Web site Search Engine Friendly.
http://www.hypergurl.com/articles/dynamic.html (accessed November 5 2011). Quoted on
http://en.wikipedia.org/wiki/Dynamic_web_page)](https://image.slidesharecdn.com/2010-080-1226-130612144004-phpapp02/85/2010-080-1226-36-320.jpg)
![Dialogic innovatie ● interactie 23
agent is simultaneously challenged on two dimensions: it has to ‘read’ more complicated
data on a much larger number of websites.
4.2 Major merits and challenges of site centric measurements
Legal perspective
The most important legal challenges with regard to site centric measurements are
intellectual property right issues, much less so issues concerning the automated data
collection itself. Of particular importance are the sui generic database rights in European
Union Law. An owner has the right to object to the copying of substantial parts of their
database, even if data is extracted and reconstructed piecemeal.14
The crucial phrase is
‘substantial parts’. Extracting an entire database (with the help of a web robot) would be in
violation of the database rights. However in case of smaller incidental queries it is even
technically impossible to distinguish between a human agent and an automated agent.
Nevertheless, some site owners have defined certain restrictions to automated agents who
visit their website (in the robot.txt file) or sometimes forbid the use of automated agents
on their website altogether.
Although the text of the robot.txt file has no legal binding it is good practice to respect as
much as possible the restrictions that have been defined by the website owner, provided
that they are reasonable (e.g., forbidden the crawling of prices on a – public – price
comparison website is not reasonable). The most important issue to take into account is
not to put too much burden on the web server. High frequency repeated queries by an
automated agent would results in a slowing down of the performance of the web server
which would also negatively affect the user experience of the other human visitors and
eventually crowd them out altogether. In the most radical case, the server could do down
altogether (which basically boils down to a denial-of-service [DoS] attack). The automated
agent should therefore be programmed in such a way that the frequency of requests is low
(say at the most once every three seconds). Also, many website owners have explicitly
specified the maximum number of requests that can be done in a certain period (e.g.,
Google allows a maximum of 150 requests in its API).
Social perspective
The major issues with regard to the broader social acceptance of the use of IaD methods
revolve around privacy issues, especially the re-use of personal data by website owners.
This especially refers to the aforementioned site-based user centric measurements (e.g.,
tagging visitors with persistent cookies). Social websites such as Facebook and LinkedIn
have direct access to their databases with user information but are also said to actively
trace the behaviour of visitors to the personal pages of their users. None of the three
feasibility studies involves the collection of any kind of personal data thus the privacy issue
is of no great concern here. At most in the third feasibility study personal data could be
coincidently retrieved due to the sloppy security design of some websites. This ‘bycatch’
(which actually occurs quite often) should immediately be removed from the output of the
robot.
Again, although the site-centric feasibility studies do not involve any personal data the
increasing public concern about the careless handling of personal data (either wilfully by
private firms or unintended by public sector bodies) might also give a negative image to
any IaD method.
14
http://en.wikipedia.org/wiki/Database_right](https://image.slidesharecdn.com/2010-080-1226-130612144004-phpapp02/85/2010-080-1226-37-320.jpg)


![Dialogic innovatie ● interactie62
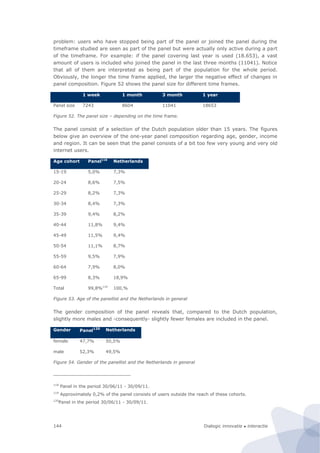
This configurations neglects the internal network data flow. These flows are however
probably not relevant for this study.
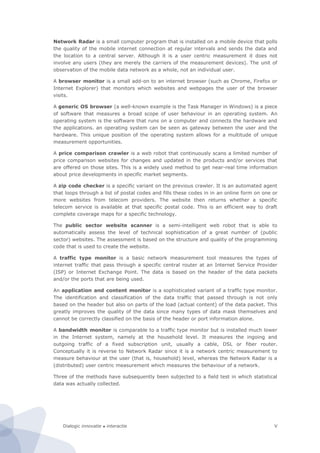
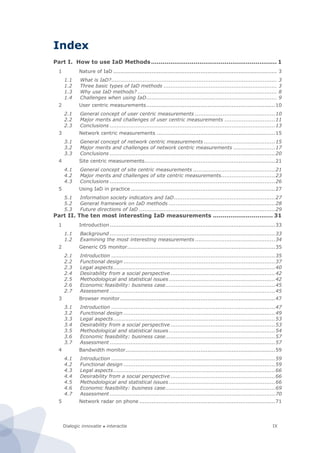
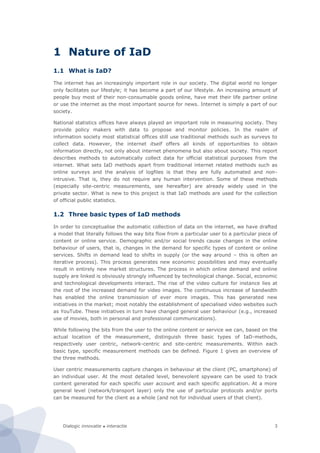
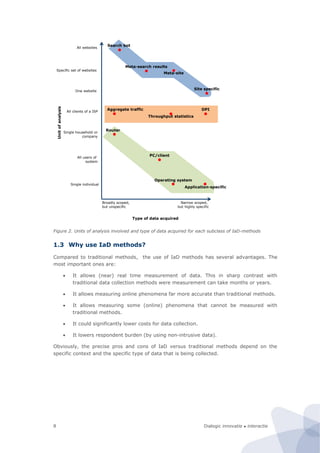
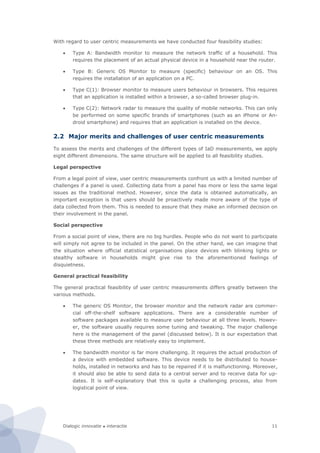
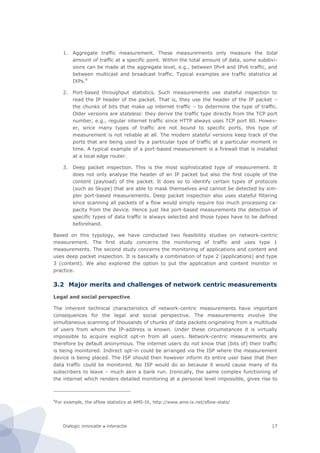
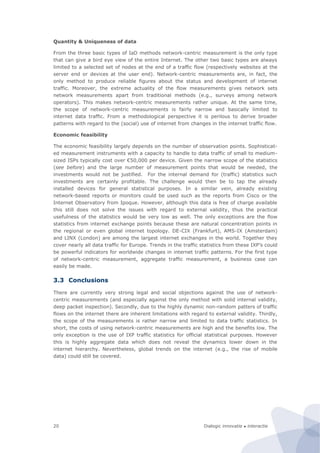
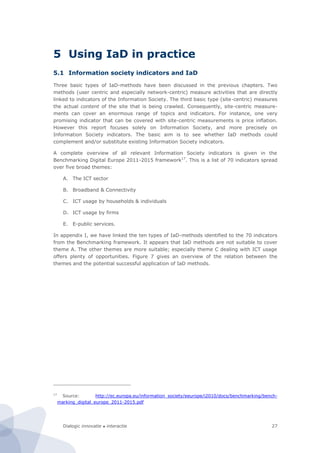
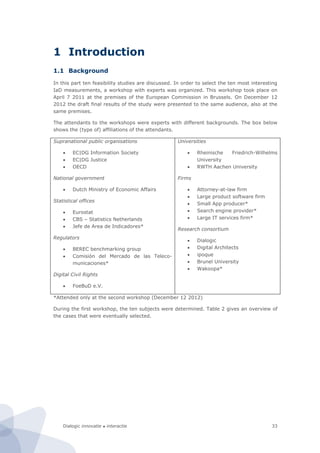
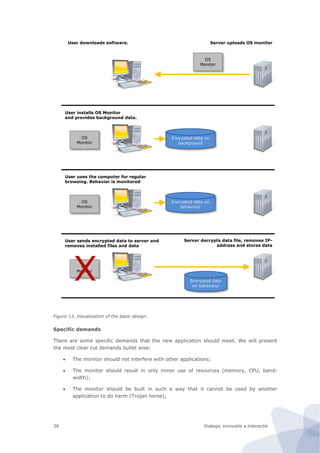
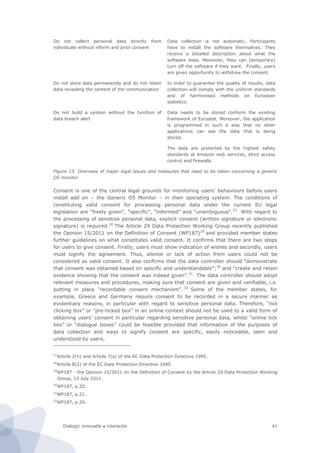
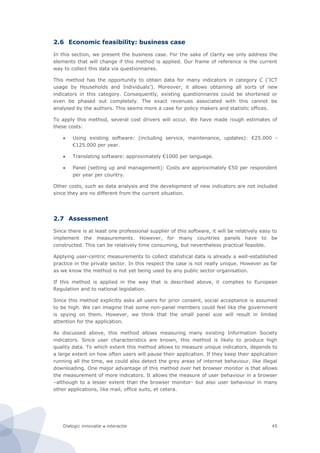
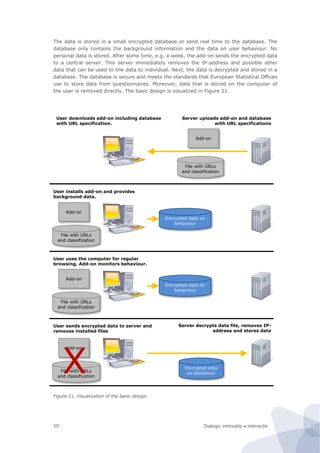
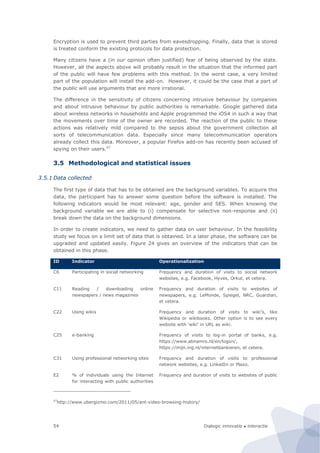
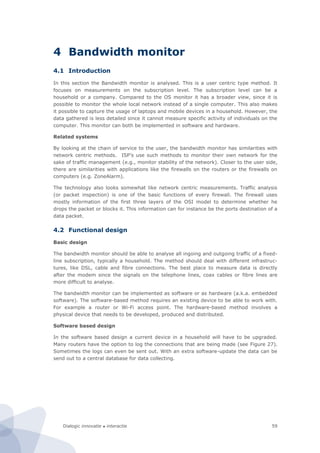
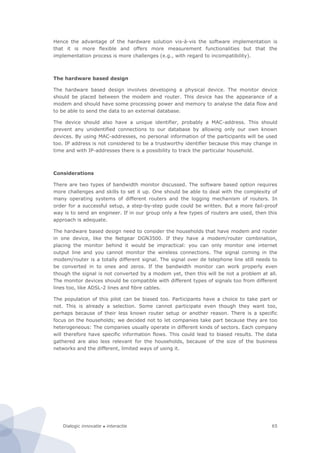
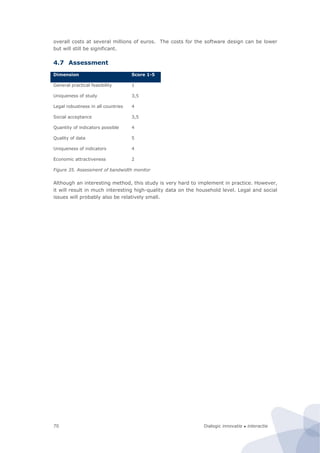
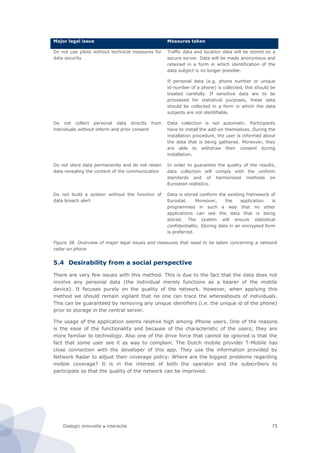
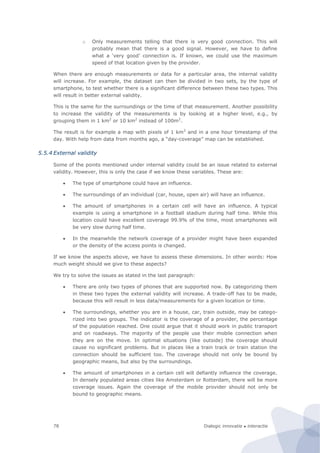
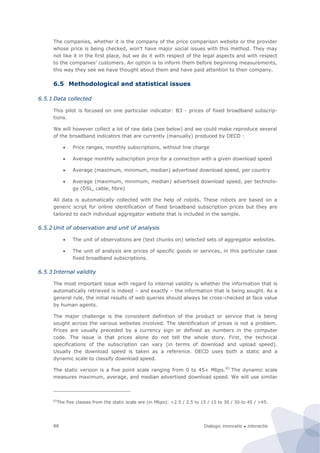
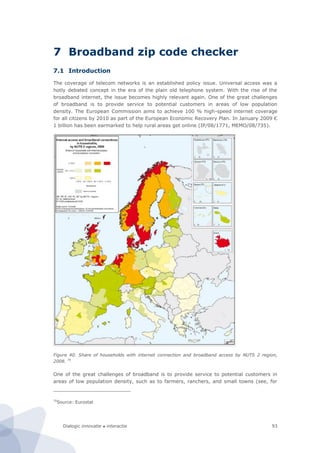
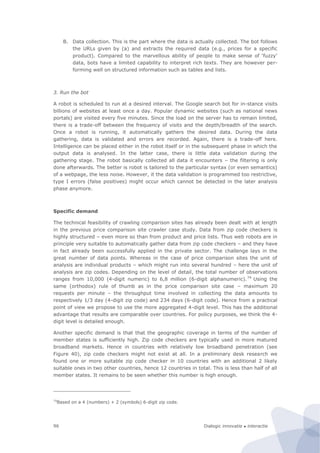
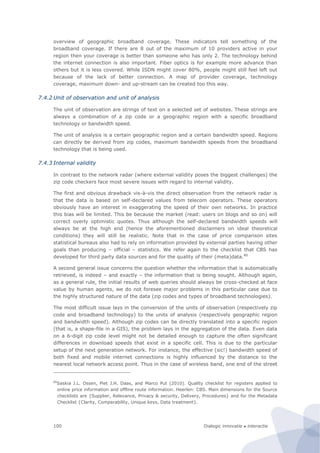
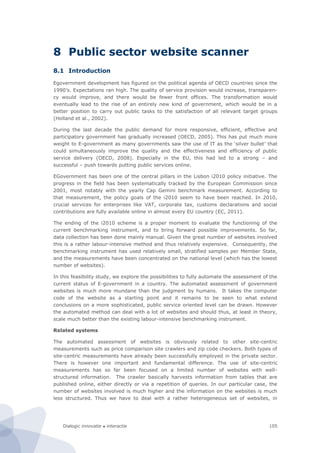
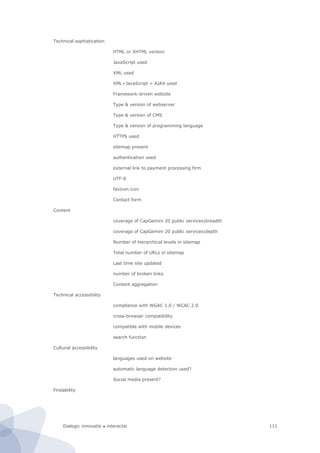
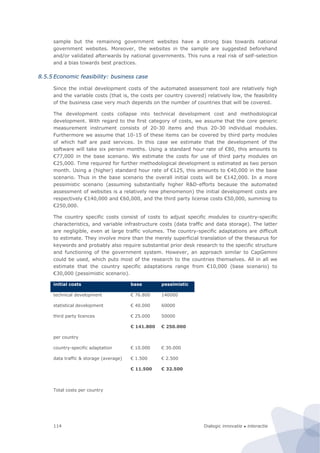
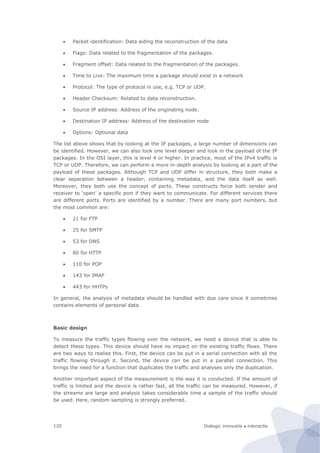
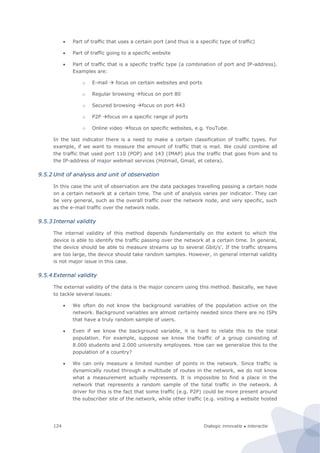
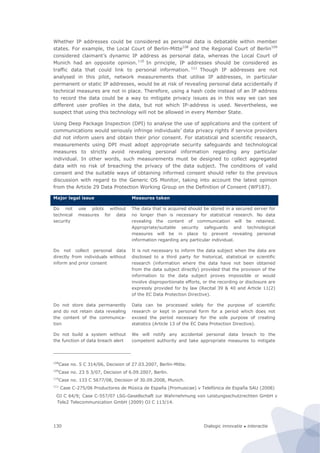
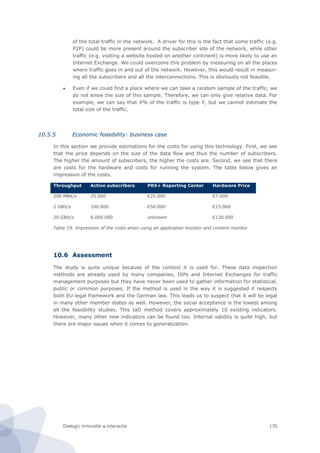
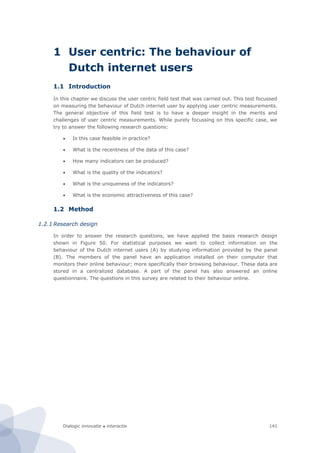
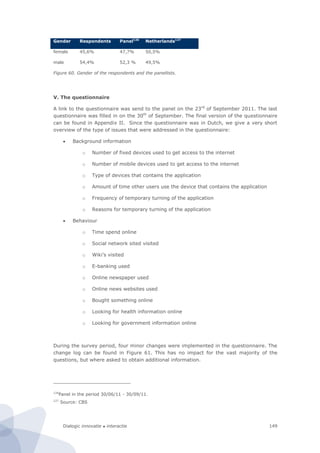
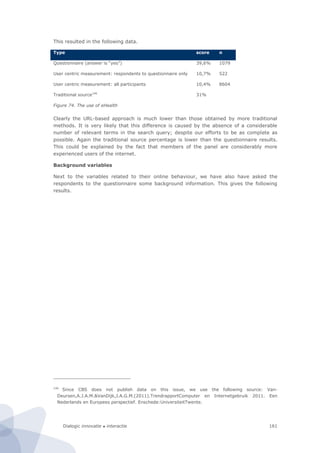
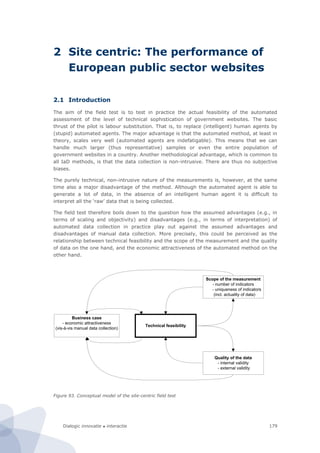
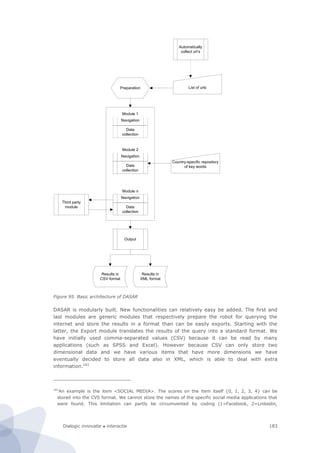
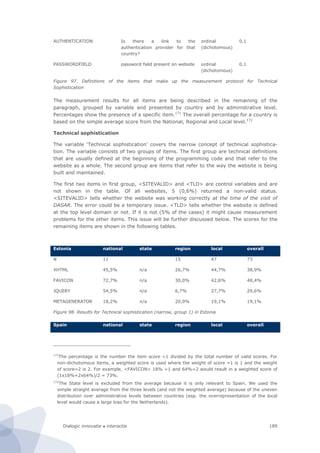
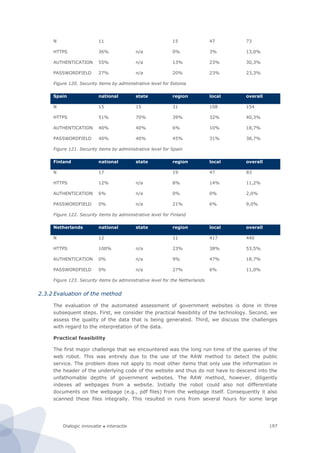
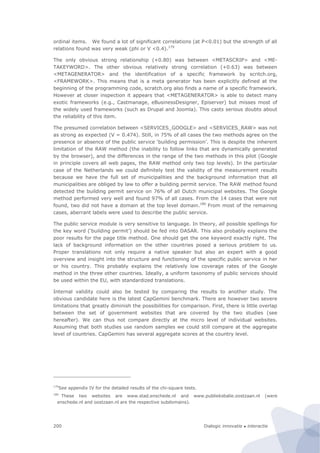
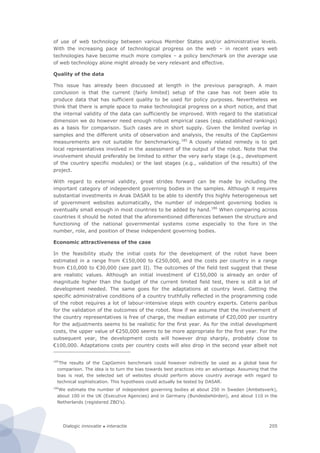
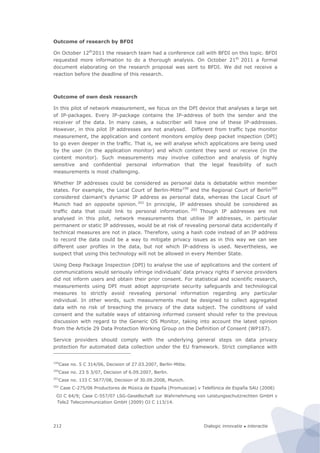
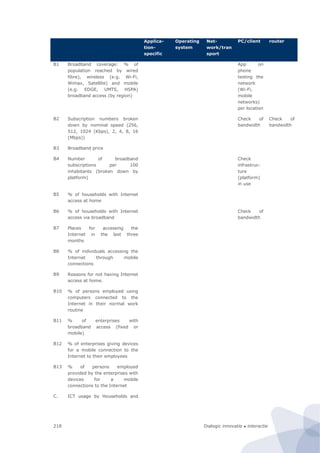
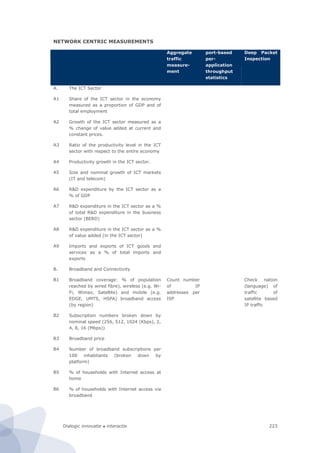
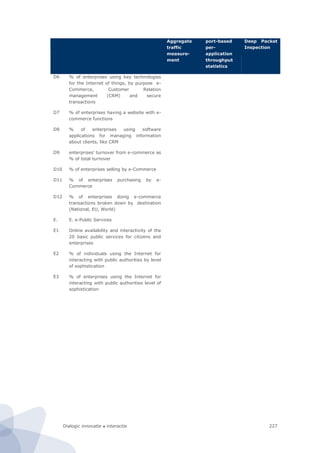
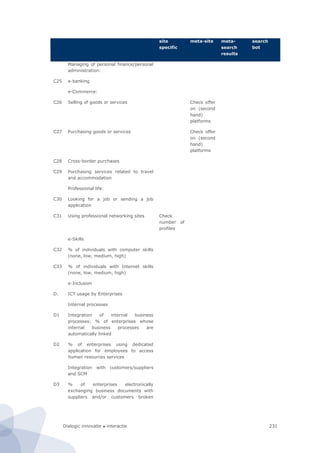
The bandwidth monitor, whether software or hardware based, can be used for measuring
different types of digital usage (internet, telephone, television). The figures below describe
indicators which can possibly be interesting to monitor.
Indicator Function Unit
Amount of data usage Amount of downloading, uploading [Mb/month]
Time of the day of data usage To indicate peak usage [Mb/hour]
Number of unique IP-addresses
used in network
To indicate how many electronic devices with
an internet connection are present in a
household
[ip-address]
Downtime To determine the total time when the
household is not connected to the internet as a
cause of e.g. technical failure. This may be
unusable since some households have timers
to switch electronics off in the night.
[minute/year]
Average internet speed To indicate the average speed at which people
can use internet (how much lower is it than
ISP say it is?)
[Mb/s]
Maximum internet speed To indicate the maximum speed at which
people use internet
[Mb/s]
Use of P2P downloading and
uploading
To determine the amount of usage of file
sharing programs like Torrent based
applications.
[Mb/month]
Use of newsgroups To determine the amount newsgroup usage for
file sharing
[Mb/month]
Child protection To determine if households use child protection
pre-installed on the modem
[number]
Type of internet connection To determine whether the household is using a
fibre, cable or a broadband connection
[type]
Net neutrality Determine if the ISP use technologies to block
or shape certain kinds of traffic.
[-]
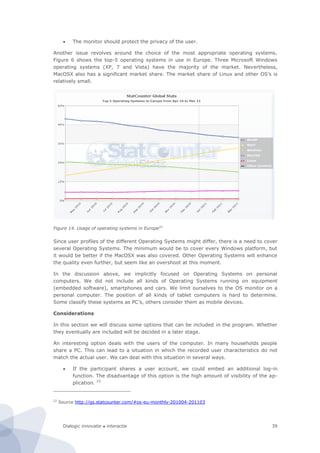
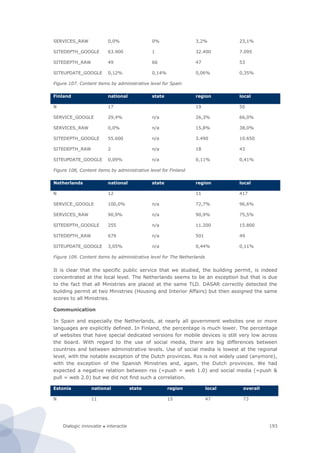
Figure 31. Indicators which can be interesting to monitor considering internet usage](https://image.slidesharecdn.com/2010-080-1226-130612144004-phpapp02/85/2010-080-1226-76-320.jpg)
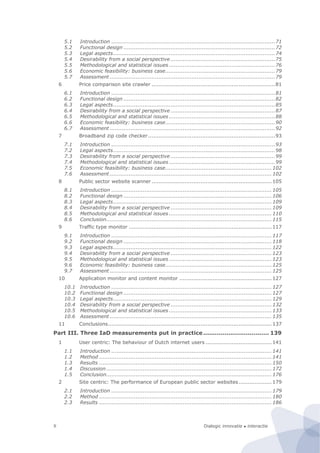
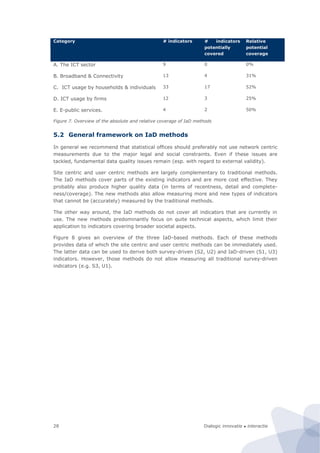
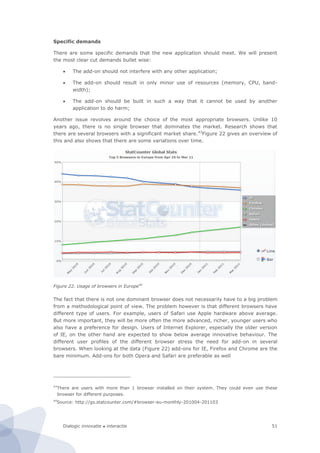
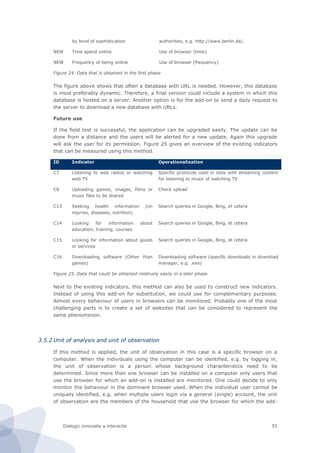
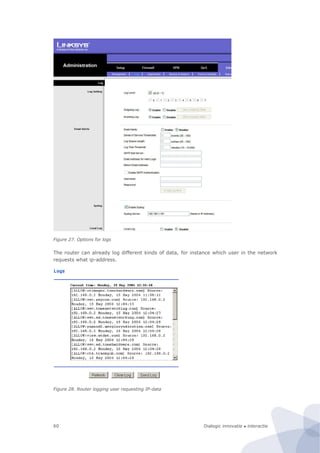
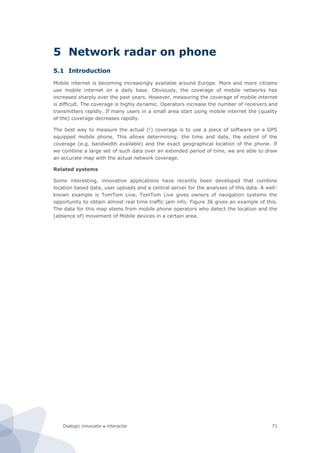
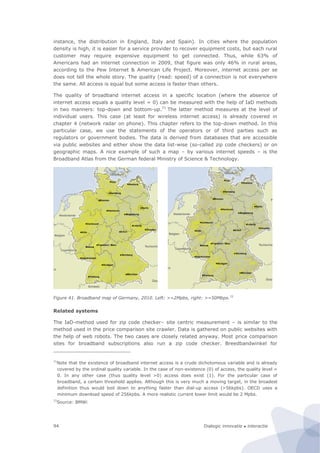
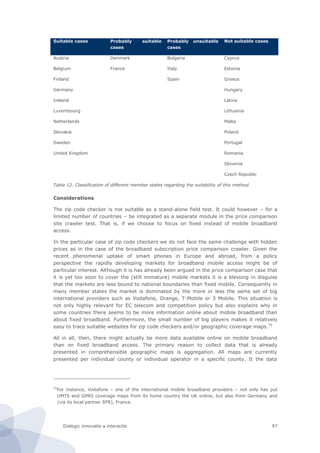
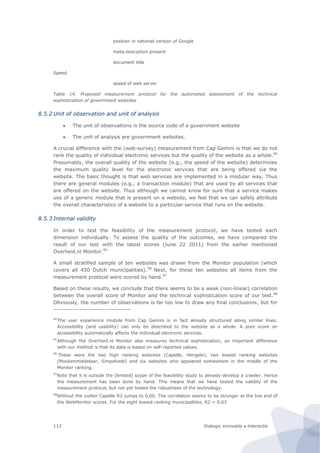
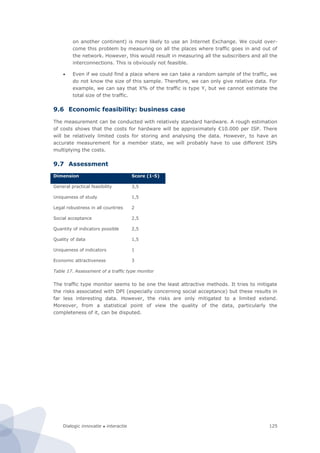
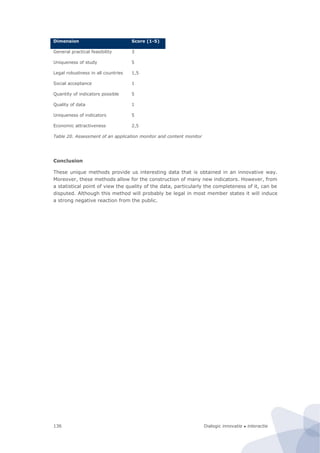
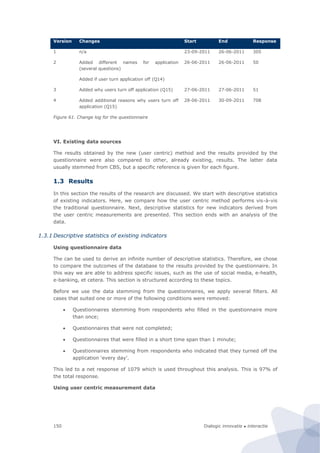
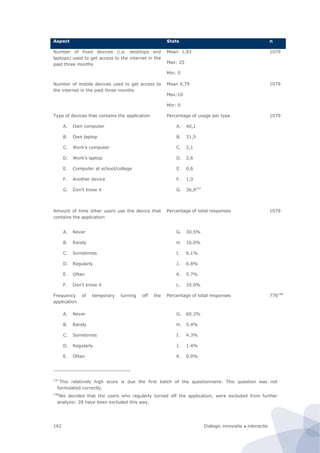
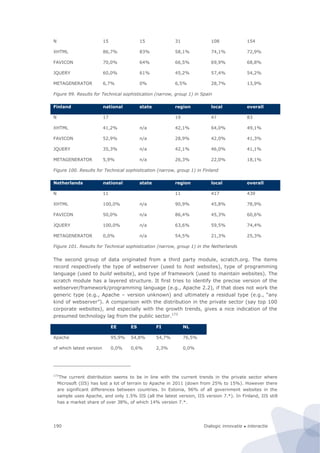
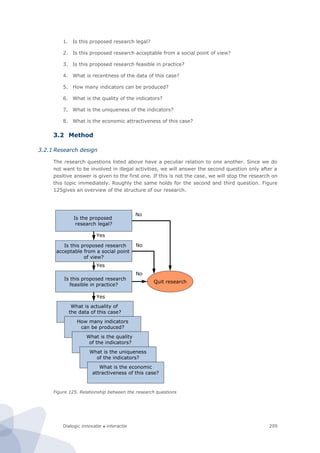
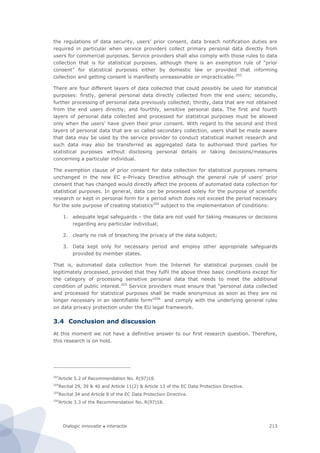
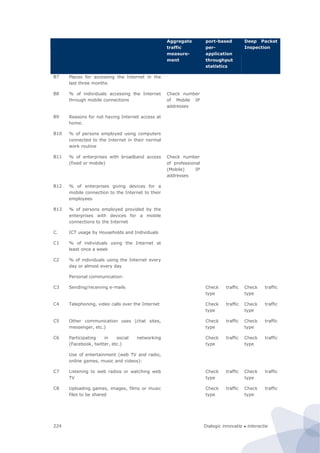
![Dialogic innovatie ● interactie 63
Indicator Function Unit
Amount of total calls To determine the total amount of telephone
calls made
[call/month]
Amount of domestic calls To determine the amount of domestic calls [call/month]
Amount of international calls To determine the amount of calls made to
countries abroad
[call/month]
Average duration of a telephone
call
To determine the average duration of a
telephone call
[minute/call]
Downtime To determine the total time when the
household is not able to make or receive a call
due to e.g. a technical failure
[minute/year]
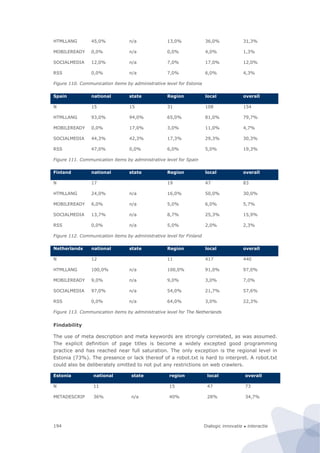
Figure 32. Indicators which can be interesting to monitor considering telephone usage
Indicator Function Unit
Quality of received signal To determine whether the household is
receiving a digital (High-Definition or SD)
signal, or analogue signal.
[kB/s]
Amount of television watched To determine how much time a households
spends on watching television
[min/week]
Downtime To determine the total time when the
household is not able to receive a signal due to
e.g. a technical failure
[minute/year]
Television channel To determine which channels people are using
most frequently
[minute/
(channel*
month)]
Figure 33. Indicators which can be interesting to monitor considering digital television usage
These data can be collected by determining the following properties of the data:
Packet/byte count
Start/end time of packet
Port usage
The type of protocol used
Gathering data about the traffic of a household can tell a lot about the surfing behaviour of
a household. If background information about the household is known, the results can be
generalized to the population at large. Relevant background variables include:
Number of people in the household
Type of household, ex. Family of 4 or 3, or singles
Ages
Gender
Socio-economic status (e.g. income, education)](https://image.slidesharecdn.com/2010-080-1226-130612144004-phpapp02/85/2010-080-1226-77-320.jpg)


![Dialogic innovatie ● interactie86
the latest Opinion from the Article 29 Data Protection Working Group explicitly suggested
that consent based on an individual's inaction or silence (i.e. “pre-ticked box”) would
normally not constitute valid consent, especially in an on-line context.60
Instead, much more relevant in this particular case are the sui generis rights of the owner
of the website, or better, of the database on which the price comparison site is built.
According to the EC Database Directive, the holder of database rights may not place
restrictions of the purpose to which the insubstantial parts are used (Article 8(1)). Since
we are extracting large amounts of data from the price comparison websites, Article 8.1
does not apply.
Although statistical research from database for non-commercial use is allowed according to
the EC Database Directive, member states may have exceptional rule or specific legal
measures to this provision. This applies especially to the substantial use of data. Dutch law
for instance recommenced for the company to sign a release form to have permission to
data collection. In practise, there are very little restrictions towards the substantial
automatic collection of data, not even for commercial, non-statistical purposes. One of the
few cases is Funda v.Jaap, the competing house pricing comparison sites.61
Jaap copied
the entire database of his competitor Funda. Jaap did lose the case, but the extraction of
data was not forbidden, only restricted to certain technical limitations. In practise, these
limitations were so minor that Jaap could continue running its bots.
What matters much more – also in Funda v Jaap – is not the extraction of the data but the
subsequent re-use of the data for commercial reasons. That is, even in the case of
insubstantial use, the repeated and systematic extraction of data should not conflict with
the normal exploitation of that database or unreasonably prejudice legitimate interests of
the producer of the database (Art.2.1.b of Dutch Database Law) or violate the copyright or
other rights to the database or works, data or other materials included in the database
(Art.2.2 of the Dutch Database Law). Clearly, Jaap infringed the rights of Funda.
Furthermore, the publicity and substantial investment of Internet database should be taken
into account for the determination of the level of protection. Internet database could be
public or private. More strict protection applies to a systematic or methodical design that
requires “substantial investments” and is not public available (often it is a hidden system
that collects and analyses data). With regard to database that is publicly available, the
substantiality of investments is crucial for the database rights examination. In the case of
Funda v. Jaap, “[…] websites of real estate agents do not constitute a database, because
no substantial investments were made in such a database”.62
In the ECJ case of the British
Horseracing Board Ltd and Others v. William Hill Organization Ltd, the ECJ diminished the
factor of publicity that “[the] fact that the contents of a database were made accessible to
the public by its maker or with his consent does not affect the right of the maker to
prevent acts of extraction and/or re-utilisation of the whole or a substantial part of the
contents of a database”.63
Therefore, only the collection of information from the Internet
Regions — ‘A comprehensive approach on personal data protection in the European Union’ (2011/C
181/01), O.J, C181, 22 June 2011, p10-11.
60
WP187, p.24, 32 and 35.
61
Real Estate Search Engine Jaap.nl Looses Preliminary Relief Proceedings. Discussion of the Judgment
of the Court of Alkmaar in Preliminary Relief Proceedings dated 7 August 2007, LJN BB1207.
http://www.kvdl.nl/PdfCreator.aspx?guid={2B2AF038-DBEC-4A17-BA30-2DA5A38D8DCA
62
Ibid. Funda vs. Jaap, Amsterdam Court, 2007.
63
Case C-203/02, The British Horseracing Board Ltd and Others v. William Hill Organization Ltd, ECJ 9
November 2004.](https://image.slidesharecdn.com/2010-080-1226-130612144004-phpapp02/85/2010-080-1226-100-320.jpg)
![Dialogic innovatie ● interactie 87
database that is resulted from a substantial investment may be more likely to challenge
the “sui generis” rights. In other words, economic value is the focal point to the
assessment.
The collection/consultation of information gathered from public web pages (a list of price
rather than specific data that is used to create databases) should not be prohibited, taking
into account that it is not concerning a substantial part of the content, though the use of
substantial part of the content shall be allowed for scientific research (Recital (44) and
Article 9 of the EC Database Directive).
Coming back to the earlier phase of data extraction, the ECJ ruled that “[the] transfer of
material from a protected database to another database following an on-screen
consultation of the first database and an individual assessment of the material contained in
that first database is capable of constituting an ‘extraction’, to the extent that – which it is
for the referring court to ascertain – that operation amounts to the transfer of a substantial
part, evaluated qualitatively or quantitatively, of the contents of the protected database, or
to transfers of insubstantial parts which, by their repeated or systematic nature, would
have resulted in the reconstruction of a substantial part of those contents”.64
In theory, the
robot search for data from billions of websites at least once a day for a substantial part of
content (price lists) should constitute an ‘extraction’. However, in practice, robots have
been commonly used for commercial purposes taking three necessary precautions to avoid
significant negative impacts:
The robot should not have any significant negative impact on the functioning of the
website. This means that the server load should remain limited (e.g., remain below
3,000 requests per minute). Maximum allowed load is often also explicitly stated
by the website owner in ROBOT.TXT. As a rule of thumb, Digital Architects does
<20 requests per minute.
One should take the claims in ROBOT.TXT into account but the claims should be
reasonable. A website owner of a price comparison site cannot forbid the extraction
of prices (:DISALLOW PRICES). In practice, courts will look at the common practice
in which the legal status of ROBOT.TXT is void. It is merely a matter of courtesy
and good business practice to follow the recommendations in ROBOT.TXT.
Websites should not be hacked. This may state the obvious but sensitive content
(such as passwords and personal data) is sometimes directly readable from the
source code. Rule of practice (at least among most European bot builders) is not to
extract data that is not public, even if it is out there in cyberspace.
Given the non-commercial (and non-competitive) nature of our pilot, the restrictions with
regard to extraction and/or re-utilisation of data for statistical purposes do not seem to be
relevant.
6.4 Desirability from a social perspective
In contrast to user centric and especially network-centric measurement, we do not foresee
any problems with regard to social acceptance. Rather the opposite, the public at large is
generally in favour of price comparison (strengthens the bargaining power of demand vis-
à-vis supply). Furthermore, the use of price comparison sites is already widely accepted
and it still growing rapidly.
64
Case C-304/07, Directmedia Publishing GmbH v Albert-Ludwigs-Universität Freiburg, ECJ 9 October
2008.](https://image.slidesharecdn.com/2010-080-1226-130612144004-phpapp02/85/2010-080-1226-101-320.jpg)

![Dialogic innovatie ● interactie110
to (some) private sector websites is much higher than to public sector websites.
Consequently these leading websites set the standards for citizens in terms of technical
sophistication and usability.93
Many public sector websites do not meet the expectations of
citizens. It is therefore expected that there they would in general be in favour of a critical
assessment of the technical sophistication of public sector websites. One word of caution
concerns the growing number of privacy leakages on the Internet – many originating from
government organisations (‘privacy by disaster’ rather than ‘privacy by design’). This might
cause people to be wary about the use of automated data gathering methods. On the other
hand, the specific measurement in this pilot does not involve any personal data (only
technical characteristics of the website) and the quality of the privacy and security
protection of public sector websites might actually be one of the items that is being
measured by the automated assessment tool.
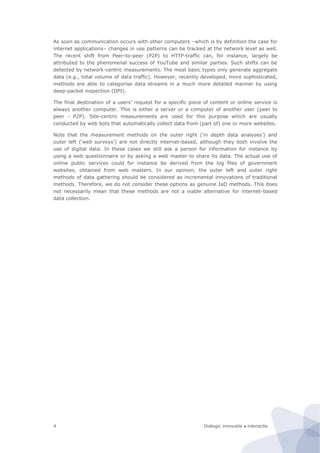
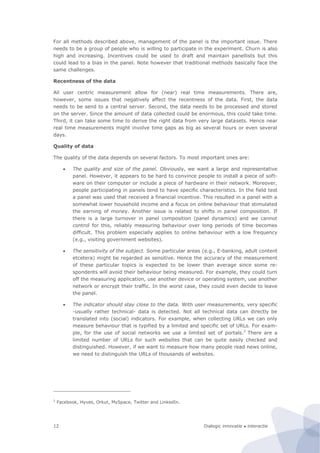
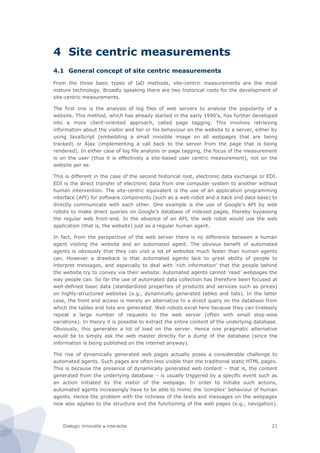
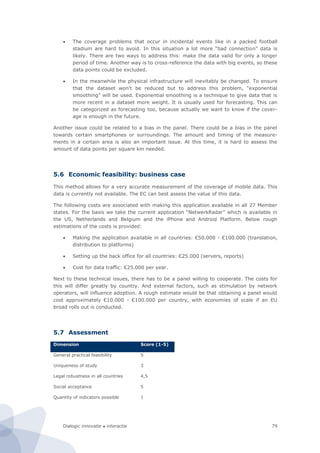
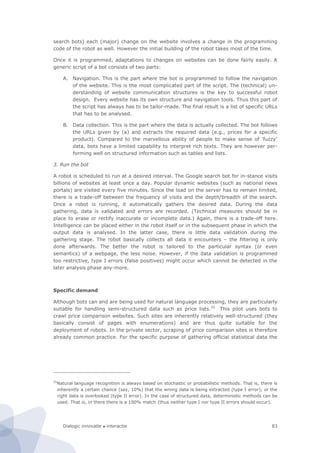
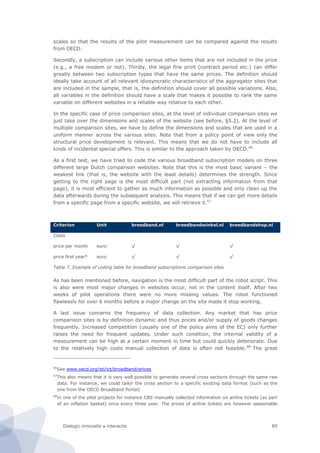
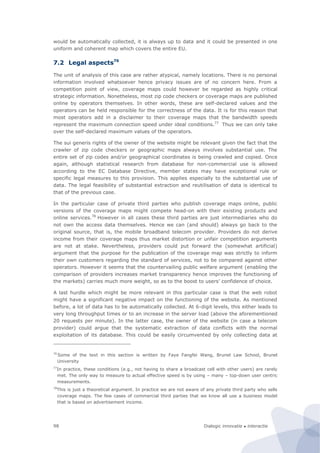
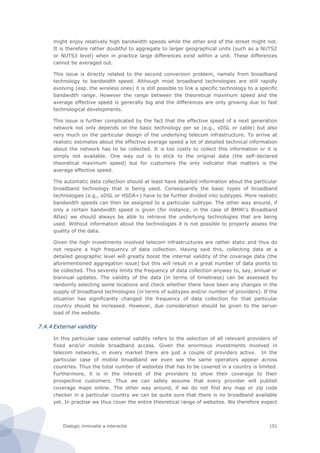
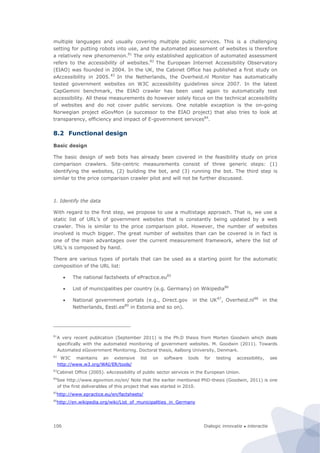
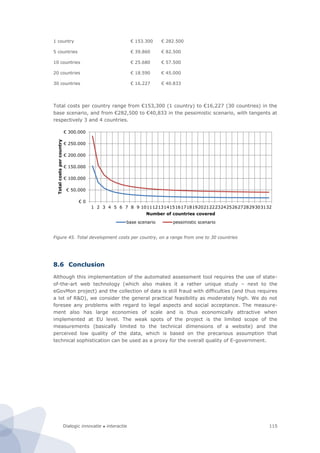
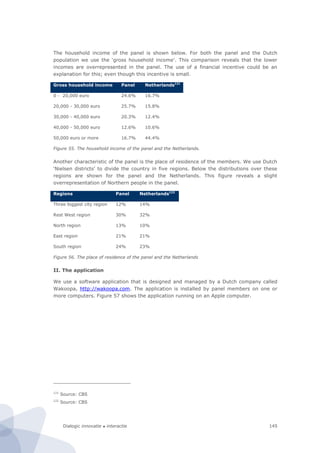
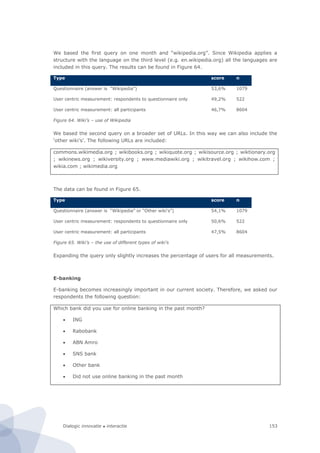
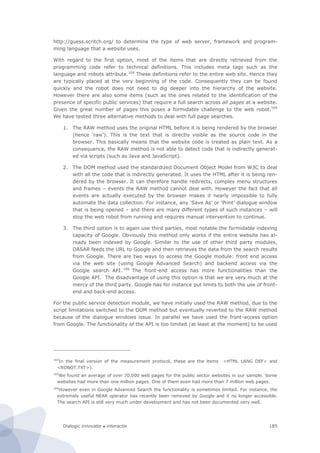
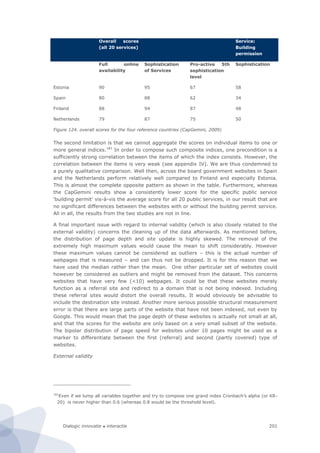
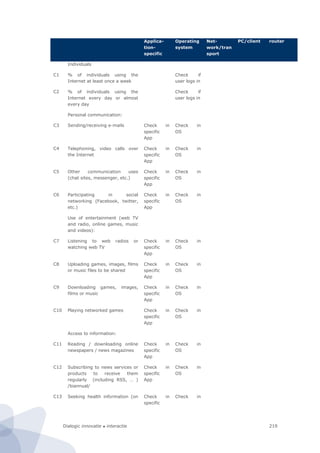
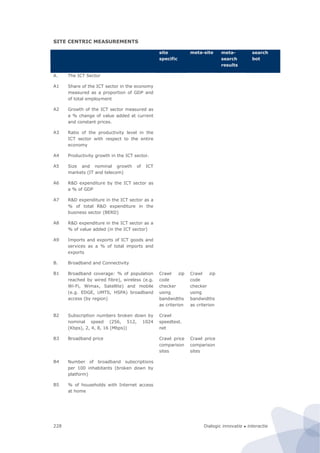
8.5 Methodological and statistical issues
8.5.1 Data collected
This pilot measures the level of technical sophistication of government websites. This is a
notably different concept from online availability of public services, which is the basis for
the CapGemini E-government benchmark framework. Nevertheless, CapGemini also uses
another index, ‘sophistication’, which seemingly looks more or less the same. However, it
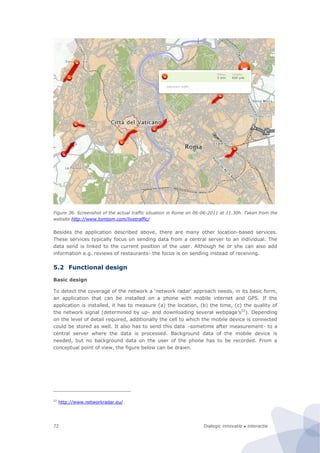
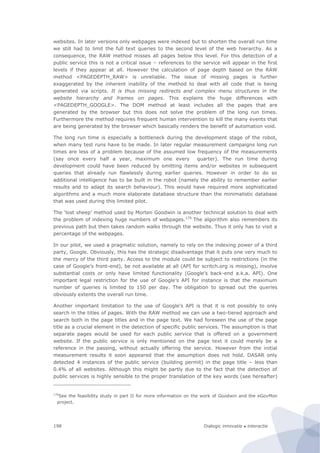
appears that this index correlates very strongly with the ‘full online availability index’,
assuming that it is markedly different from our concept of ‘technical sophistication’.
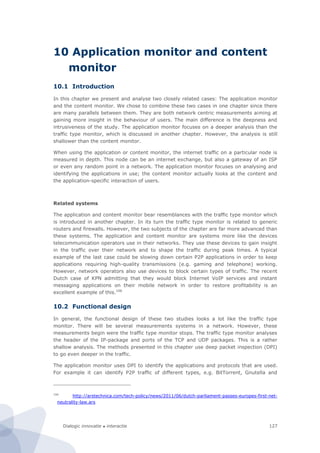
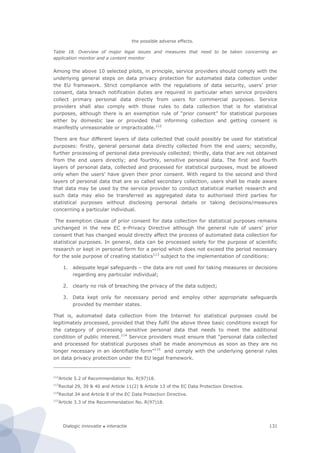
Figure 44. CapGemini’s Sophistication versus Full Online Availability
Our measurement protocol distinguishes six dimensions of technical sophistication. Each of
these dimensions consists of 1 to 15 items. For every individual item we either have to
develop a separate module or use a third party module.
Type Specification
93
R.A. te Velde, G. Ongena, B. van den Berg, J. Verweijen (2008). Begrijpelijke websites. Vuistregels
en beleidsaanbevelingen voor het verhogen van de gebruiksvriendelijkheid van overheidswebsites
[Understandable websites. Rules of thumb and policy recommendations to improve the usability of
government websites]. Utrecht: Dialogic. Commissioned by the Dutch Ministry of Interior Affairs.
http://www.dialogic.nl/documents/2008.073-0914.pdf
R² = ,924
40
50
60
70
80
90
100
20 30 40 50 60 70 80 90 100
Sophistication
Full online availability](https://image.slidesharecdn.com/2010-080-1226-130612144004-phpapp02/85/2010-080-1226-124-320.jpg)

![Dialogic innovatie ● interactie 121
Another important aspect is related to the kind of data that the device collects. In its basic
form, we think that the device should at least collect the following data:
Size of traffic stream [bit/s]
Version of IP traffic [IPv4 vs. IPv6]
Protocol [TCP, UDP, et cetera]
Next to this data, no other data should be collected.
The data can be collected in two ways. The data can be transferred real time to a central
server. At the central server a time stamp is added to enable differences over time to be
detected. Another option is to have a device that temporarily stores the data after adding
time stamps. A certain intervals the device sends data to a central server.
The location of measurements is also essential from a methodological point of view. In the
best case a location is chosen that enables measurement of all ingoing and outgoing traffic
in a network. Ideally we would measure a network that is used by a truly random sample
of the total population (of internet users). If this is not the case, we would prefer to have
insight in the background characteristics of the users of many different networks in order
to weigh back the data. However, in practice both these aspects are not easy to realize.
Specific demand
When this study is conducted, attention should be paid to the unnecessary collection of
personal data. With the IP-address of the sender and receiver known one can easily
determine which subscriber (person, company or household) makes use of what services
(for example which IP-addresses visit specific website on a daily basis). Therefore, we
should prevent storing IP-addresses of data packages.
To keep the validity in mind, a panel that represents a population should be used. Ideally
we should do measurements at one main gateway at a big ISP. This way most the traffic of
the subscribers of the ISP can be measured. Another big challenge is to find an ISP or
Internet Exchange to operate with. This is difficult because of the recent negative media
attention for a more intrusive way of data gathering: Deep Packet Inspection.
Considerations
There are several ways in which this application could be enhanced:
• Analysing which ports is used. This allows identifying the different services.
• Studying the IP-addresses visited. With a table containing all the IP-addresses of
specific internet services (e.g. www.google.com or www.europa.eu) one is able to see
which services are used.
• Combining the IP-address data of services and port could lead to an even more
accurate and detailed analysis of actual serviced being used.
An even more radical approach would allow for even more in-depth measurements on the
behaviour of subscribers. This could be realized by analysing the traffic sent and received
per IP-address and thus per subscriber. To some extent we could mitigate privacy issues of
this approach by using a (unique) hash code instead of an IP-address while recording the](https://image.slidesharecdn.com/2010-080-1226-130612144004-phpapp02/85/2010-080-1226-135-320.jpg)

![Dialogic innovatie ● interactie132
10.4 Desirability from a social perspective
In order to illustrate the sensitivity of the public, we present a small case study of DPI in
the Netherlands.
At the end of April 2011, the value of the shares of KPN, the Dutch telecommunication
incumbent, decreased sharply. The extreme speed of adoption of applications like
WhatsApp was to a large extent to blame for this. On May 10th 2011, KPN presented its
strategy towards 2015. Although this company is based in the Netherlands and focuses on
the Dutch market, this meeting took place in the financial district of London. For an
audience of bright financial analysts and financial journalists they elaborated on how they
will remain profitable in a highly dynamic and challenging market. In the Q&A round after
the presentation a senior manager of KPN, gave the following reaction on a question
regarding the pressure on their sharply declining revenues in the mobile telephony sector.
“Within the capabilities of the network that is being developed as well, we are able to
identify [with] deep packet inspection what is the destination of specific data packages
that go along. [...] We are the first operator in the world who has actually built that
capability to actually identify where [WhatsApp] streams are going to.”116
Although this unplanned fifteen second statement in a four hour meeting seemed
insignificant, it resulted in an avalanche of reactions of many parties. This was mainly
triggered by the word DPI. It resulted in:
The issue in a major item in the national TV news.
The major Dutch papers bring the news with headings like: “KPN stalks its
customers online”
A Dutch digital civil right organization places a manual online for KPN customers
on how-to-report-KPN-to-the-police.
This led to questions from the parliament that forced the minister to react. Before the end
of June 2011 (!) the Dutch Parliament adopted a law stating that telecommunication
providers were not allowed to treat types of traffic in different ways. Although the
discussion started with DPI, it ended revolving around net neutrality.
The case of KPN is probably the best example of a vigorous public reaction on DPI.
Although many (some even say: almost all) commercial internet providers use DPI, KPN
was the first one to be so open about this issue. This has had a severe impact on them.
Even after Vodafone admitted that they also used DPI, the focus stayed on KPN.
It is rather curious that public is so focussed on DPI. They think that DPI will hurt their
privacy to a very large extent. However, in reality many more basic technology applied by
an operator could hurt their privacy even more. Having insights in which websites a person
visits is probably a more severe violation of privacy. Especially if someone has a table
linking IP-addresses with subscriber data; and this is something that almost every ISP will
have. This data is very easy to acquire by every ISP without applying DPI. DPI only allows
that an ISP will also have insight in some of the content of some applications. Therefore,
for an ISP it is very easy to hurt the privacy of a subscriber to a very large extent. By
applying relatively complex DPI technology they can hurt the privacy even more.
116
https://www.bof.nl/2011/05/12/zo-doen-kpn-abonnees-aangifte-tegen-afluisteren-mobiel-internet/](https://image.slidesharecdn.com/2010-080-1226-130612144004-phpapp02/85/2010-080-1226-146-320.jpg)


![Dialogic innovatie ● interactie164
Concept Definition
Total visitors per channel Number of unique users that have record in the
database referring to a URL defined in the channel
within the selected time frame.
Total pageviews Number of records151
in the database referring to a
URL defined in the channel within the selected time
frame.
Total visits Total number of visits referring to a domain defined in
the channel within the selected time frame. A visit is
defined as: “a visit is a series of pageviews from one
user within one domain152
with a maximum length of
30 minutes between pageviews”
Total time on site Combined time of all visits.
Figure 76. Concepts that are needed to define new indicators and their definition
These concepts allow us to create new indicators. Although there are many indicators
possible, in this stage we focus on the most interesting indicators.
Indicator Concept Definition
Duration per user The time an average active user of a certain
type of sites (e.g. social networking) spends
using these types of sites.
[Total time on site] / [Total
visitors of channel]
User action intensity The number of page views an average user of
a certain type of sites (e.g. social networking)
has using these types of sites.
[Total pageviews] / [Total
visitors of channel]
User visit intensity The number of visits an average active user of
a certain type of sites (e.g. social networking)
has using these type of sites.
[Total visits] / [Total visitors
of channel]
Channel intensity The average number of pageviews a channel
has, per time spent on this site.
[Total pageviews] / [Total
time on site]
Duration per session The average length of a visit. [Total time on site] / [Total
visits]
Activity per session The average number of pageviews per visit [Total pageviews] / [Total
visits]
Figure 77. New indicators that can be constructed using the new concepts
Social media
In this context we limit ourselves to the narrow definition of social media (see above). The
data used covers a time frame of one month.
151
Note that, as discussed earlier in this document, each time a URL in a browser changes, a new
record in the database is created.
152
A domain equals a top level domain (e.g. .com or. nl) plus a second level domain (e.g. facebook or
hyves. Therefore a domain can be facebook.com or hyves.nl.](https://image.slidesharecdn.com/2010-080-1226-130612144004-phpapp02/85/2010-080-1226-178-320.jpg)
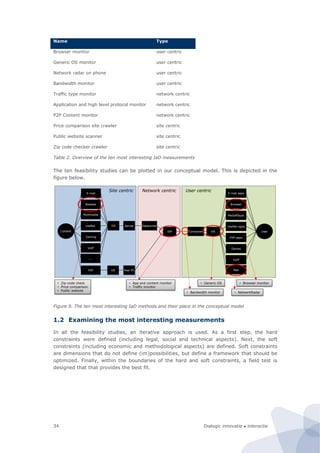
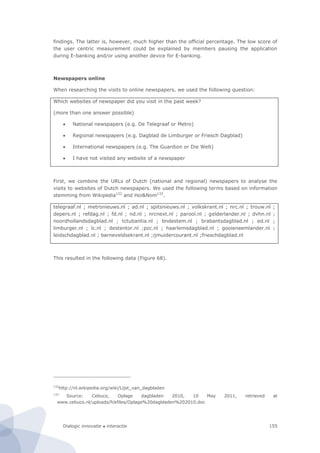
![Dialogic innovatie ● interactie 165
Indicator Score unit
Total visitors of channel 6993 [visitors]
Total visits 260716 [visits]
Total pageviews 6615227 [pageviews]
Time on site 2962,75 [days]
Duration per user 10,17 [hours] / [visitor]
User action intensity 945,98 [pageviews] / [visitor]
User visit intensity 37,28 [visits] / [visitor]
Channel intensity 93,03 [pageviews] / [hour]
Duration per session 16,4 [minutes] / [visit]
Activity per session 25,4 [pageviews] / [visit]
Figure 78. User centric indicators for social media
Wiki’s
In this context we limit ourselves to the narrow definition of wiki’s (see above). The data
used covers a time frame of one month.
Indicator Score unit
Total visitors of channel 4021 [visitors]
Total visits 18346 [visits]
Total pageviews 93757 [pageviews]
Time on site 34,88 [days]
Duration per user 0,21 [hours] / [visitor]
User action intensity 23,32 [pageviews] / [visitor]
User visit intensity 4,56 [visits] / [visitor]
Channel intensity 112,02 [pageviews] / [hour]
Duration per session 2,7 [minutes] / [visit]
Activity per session 5,1 [pageviews] / [visit]
Figure 79. User centric indicators for wiki’s
E-banking
In this context we limit ourselves to the narrow definition of E-banking (see above). The
data used covers a time frame of one month.](https://image.slidesharecdn.com/2010-080-1226-130612144004-phpapp02/85/2010-080-1226-179-320.jpg)
![Dialogic innovatie ● interactie166
Indicator Score unit
Total visitors of channel 6172 [visitors]
Total visits 82530 [visits]
Total pageviews 262559 [pageviews]
Time on site 100,92 [days]
Duration per user 0,39 [hours] / [visitor]
User action intensity 42,54 [pageviews] / [visitor]
User visit intensity 13,37 [visits] / [visitor]
Channel intensity 108,41 [pageviews] / [hour]
Duration per session 1,8 [minutes] / [visit]
Activity per session 3,2 [pageviews] / [visit]
Figure 80. User centric indicators for E-banking
Newspapers
In this context we limit ourselves to the narrow definition of Newspapers (see above). The
data used covers a time frame of one week.
Indicator Score unit
Total visitors of channel 3046 [visitors]
Total visits 21355 [visits]
Total pageviews 129020 [pageviews]
Time on site 66,88 [days]
Duration per user 0,53 [hours] / [visitor]
User action intensity 42,36 [pageviews] / [visitor]
User visit intensity 7,01 [visits] / [visitor]
Channel intensity 80,39 [pageviews] / [hour]
Duration per session 4,5 [minutes] / [visit]
Activity per session 6,0 [pageviews] / [visit]
Figure 81. User centric indicators for Newspapers
News sites
In this context we limit ourselves to the narrow definition of News sites (see above). The
data used covers a time frame of one week.](https://image.slidesharecdn.com/2010-080-1226-130612144004-phpapp02/85/2010-080-1226-180-320.jpg)
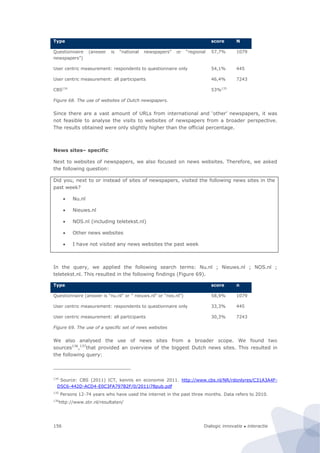
![Dialogic innovatie ● interactie 167
Indicator Score unit
Total visitors of channel 2059 [visitors]
Total visits 14762 [visits]
Total pageviews 62656 [pageviews]
Time on site 26,75 [days]
Duration per user 0,31 [hours] / [visitor]
User action intensity 30,43 [pageviews] / [visitor]
User visit intensity 7,17 [visits] / [visitor]
Channel intensity 97,60 [pageviews] / [hour]
Duration per session 2,6 [minutes] / [visit]
Activity per session 4,2 [pageviews] / [visit]
Figure 82. User centric indicators for News sites
E-commerce
In this context we limit ourselves to the narrow definition of E-commerce (see above). The
data used covers a time frame of three months.
Indicator Score unit
Total visitors of channel 6449 [visitors]
Total visits 28335 [visits]
Total pageviews 77120 [pageviews]
Time on site 19,04 [days]
Duration per user 0,07 [hours] / [visitor]
User action intensity 11,96 [pageviews] / [visitor]
User visit intensity 4,39 [visits] / [visitor]
Channel intensity 168,75 [pageviews] / [hour]
Duration per session 1,0 [minutes] / [visit]
Activity per session 2,7 [pageviews] / [visit]
Figure 83. User centric indicators for E-commerce
E-government
In this context we limit ourselves to the narrow definition of E-government (see above).
The data used covers a time frame of three months.](https://image.slidesharecdn.com/2010-080-1226-130612144004-phpapp02/85/2010-080-1226-181-320.jpg)
![Dialogic innovatie ● interactie168
Indicator Score unit
Total visitors of channel 569 [visitors]
Total visits 827 [visits]
Total pageviews 2613 [pageviews]
Time on site 1,67 [days]
Duration per user 0,07 [hours] / [visitor]
User action intensity 4,59 [pageviews] / [visitor]
User visit intensity 1,45 [visits] / [visitor]
Channel intensity 65,33 [pageviews] / [hour]
Duration per session 2,9 [minutes] / [visit]
Activity per session 3,2 [pageviews] / [visit]
Figure 84. User centric indicators for E-government
eHealth
In this context we limit ourselves to the definition of eHealth that is described above. The
data used covers a time frame of one year.
Indicator Score unit
Total visitors of channel 896 [visitors]
Total visits 2127 [visits]
Total pageviews 4980 [pageviews]
Time on site 0,96 [days]
Duration per user 0,03 [hours] / [visitor]
User action intensity 5,56 [pageviews] / [visitor]
User visit intensity 2,37 [visits] / [visitor]
Channel intensity 216,52 [pageviews] / [hour]
Duration per session 0,6 [minutes] / [visit]
Activity per session 2,3 [pageviews] / [visit]
Figure 85. User centric indicators for eHealth
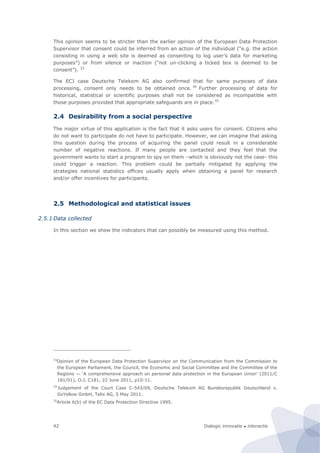
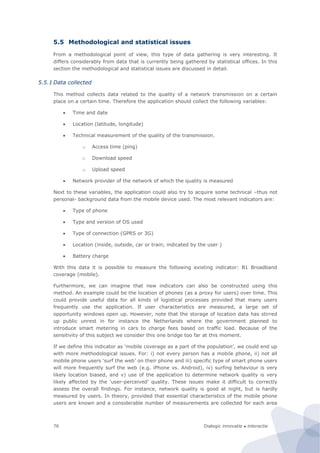
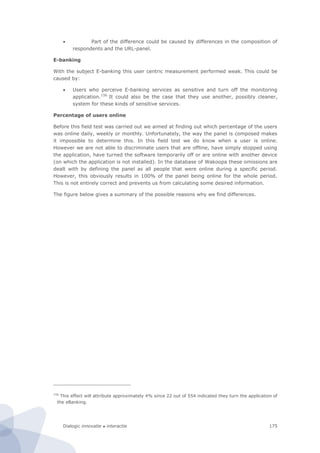
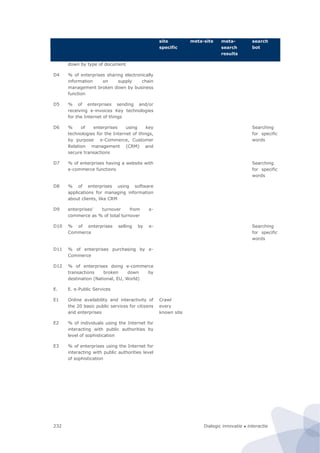
1.3.3 Analysis
All the data collected via the questionnaire was linked with information obtained by the
user centric measurements. This allowed us to compare the quality of the results obtained
in both modes. Figure 86 gives an overview of the results.](https://image.slidesharecdn.com/2010-080-1226-130612144004-phpapp02/85/2010-080-1226-182-320.jpg)
![Dialogic innovatie ● interactie170
o For the use of social media, wiki’s and newspapers this user centric ap-
proach provides very similar results.
o For the use of news sites, E-government, E-commerce and E-banking the
results obtained by this user centric approach are dissimilar. Some of these
uses are, very likely, negatively affected by the pause-option of the appli-
cation
The width of the definition of a concept (broad, light green or narrow, dark green)
does not seem to have any impact.
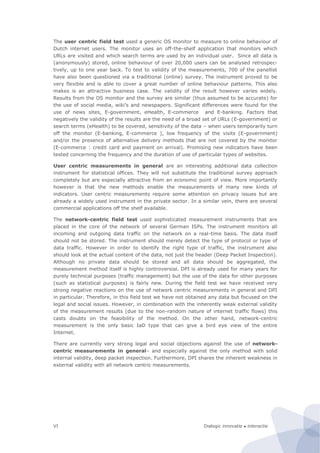
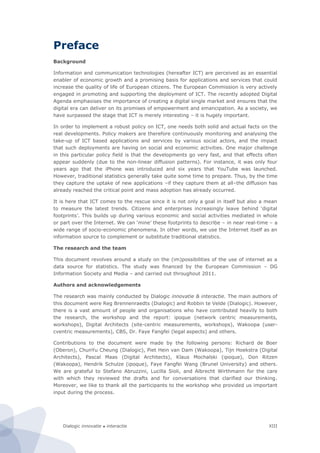
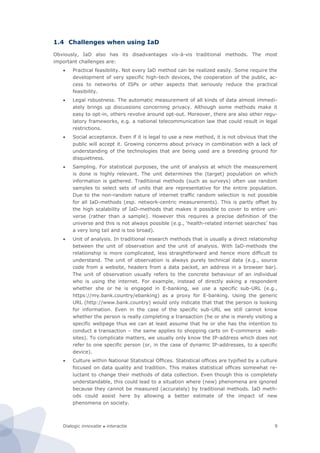
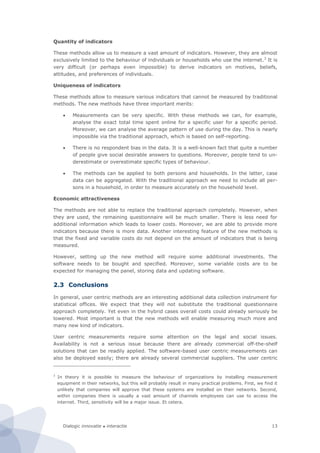
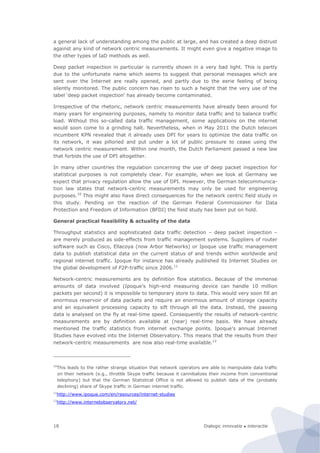
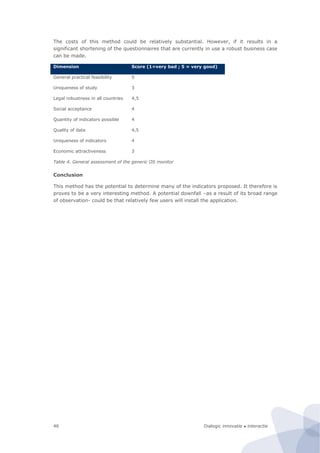
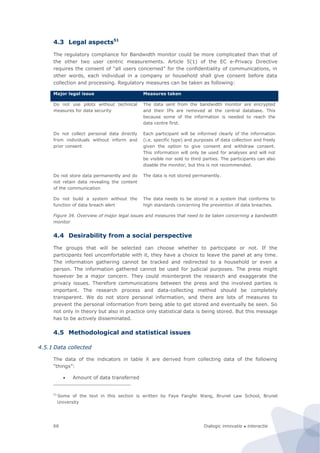
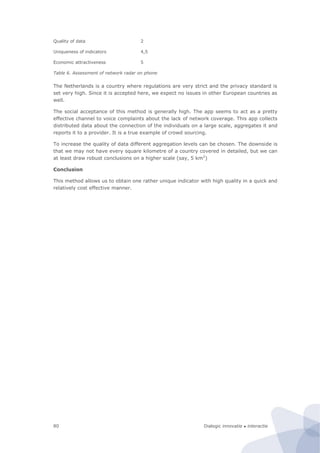
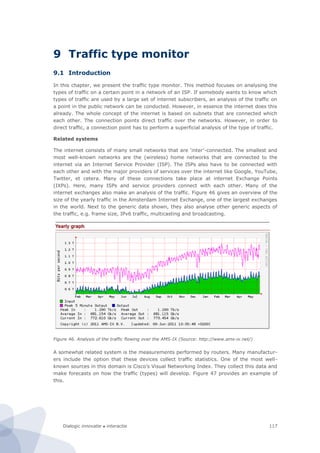
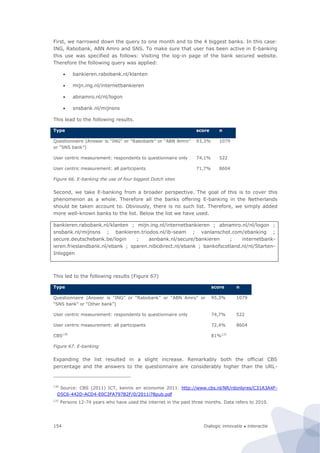
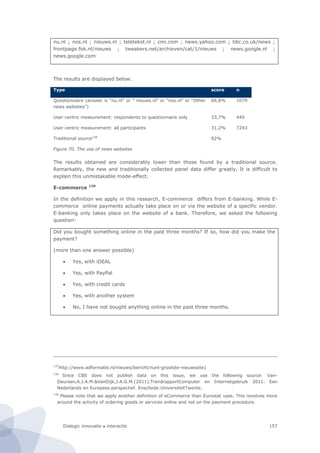
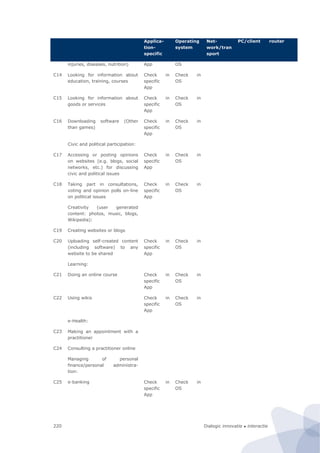
Next to comparing the traditional and new method, we also analysed the results provided
by the new indicators. We particularly looked at how the scores on the subjects differ from
each other. It is important that we first standardize the time frame covered for the
indicators. The following indicators are recalculated with a time frame of a week:
Duration per user [minutes per week]
User action intensity [pageviews per visitor per week]
User visit intensity [visits per visitor per week]
After this recalculation, we obtain scores for every subject over the same time period.
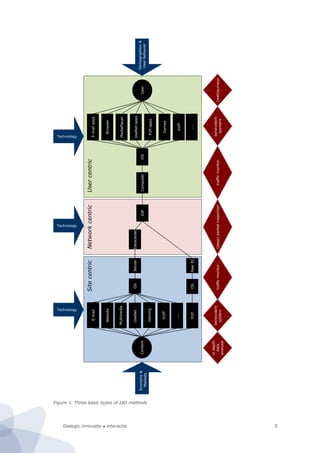
Figure 87 shows the average scores for the subjects on the indicators.
Social
media
Wiki E-
banking
eHealth News
papers
News
sites
E-
com-
merce
eGov
Duration per user
[minutes per week]
140,8 2,9 5,4 0,4 31,6 18,7 0,3 0,1
User action intensity
[pageviews per
visitor per week]
218,3 5,4 9,8 1,3 42,4 30,4 0,9 0,1
User visit intensity
[visits per visitor per
week]
8,6 1,1 3,1 0,6 7,0 7,2 0,3 0,0
Channel intensity
[pageviews per hour
spend online]
93,0 112,0 108,4 216,5 80,4 97,6 168,8 65,3
Duration per session
[minutes per visit]
16,4 2,7 1,8 0,6 4,5 2,6 1,0 2,9
Activity per session
[pageviews per visit]
25,4 5,1 3,2 2,3 6,0 4,2 2,7 3,2
Figure 87. Scores of all the subjects on all the indicators. For practical purposes are some indicators
for some subjects recalculated towards a time frame of one week.
Based on the micro data other statistics, such as histograms, standard deviations, et
cetera, can be generated. The web interface of Wakoopa also offers very specific indicators
used for E-commerce , such as the bounce rate.153
The data can also be used to analyse the
usage of certain channels over time. Figure 88 shows the amount of unique visitors per day
153
The bounce rate is the percentage of the visits with an activity onepageview.](https://image.slidesharecdn.com/2010-080-1226-130612144004-phpapp02/85/2010-080-1226-184-320.jpg)
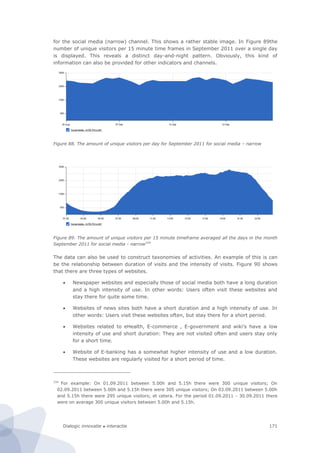
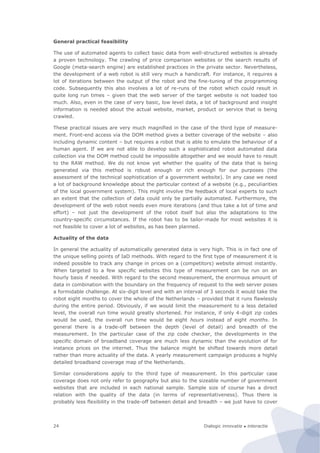
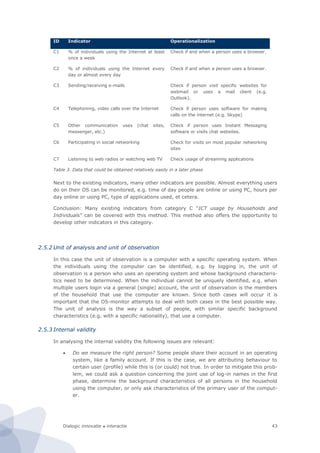
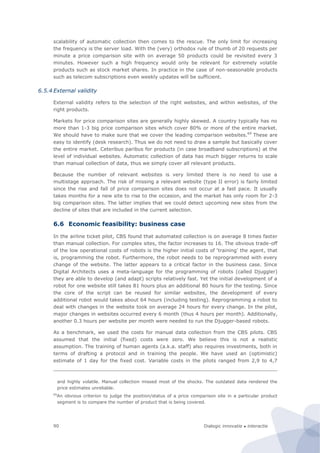
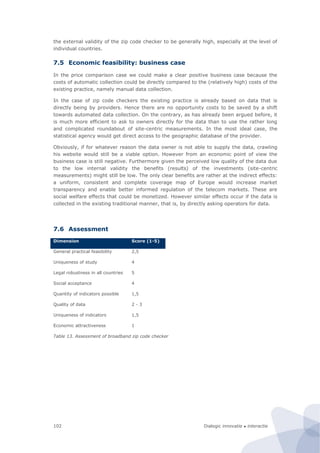
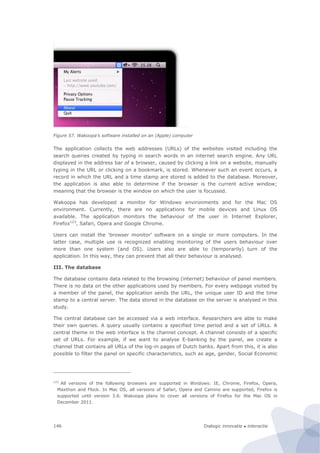
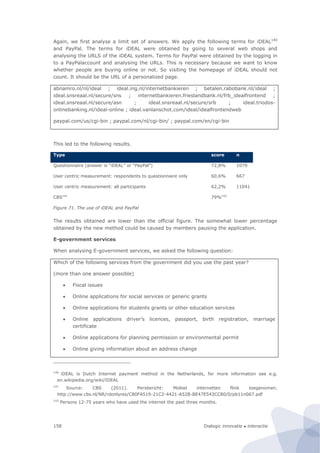
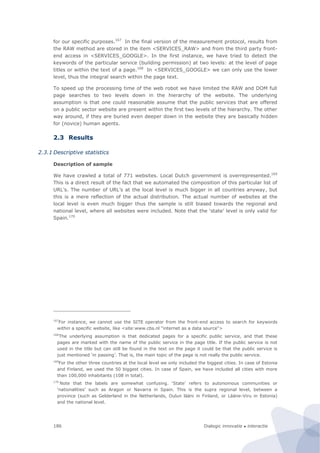
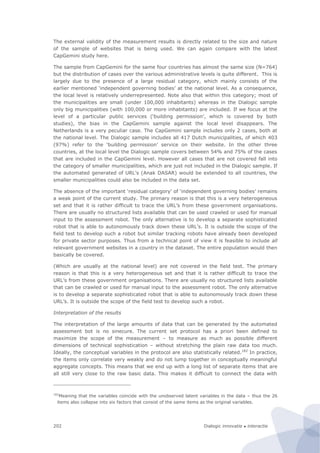
![Dialogic innovatie ● interactie 181
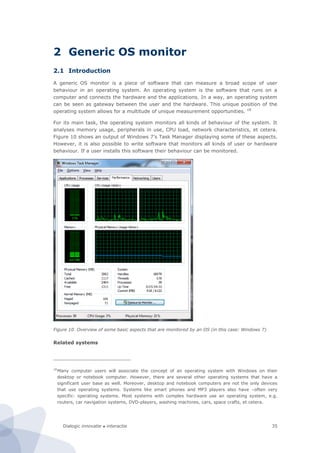
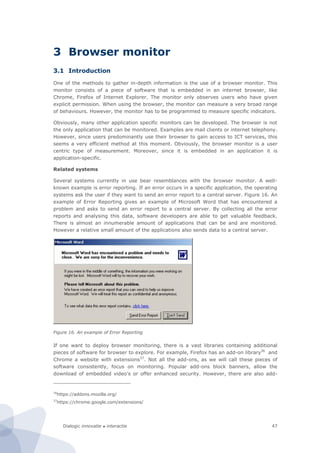
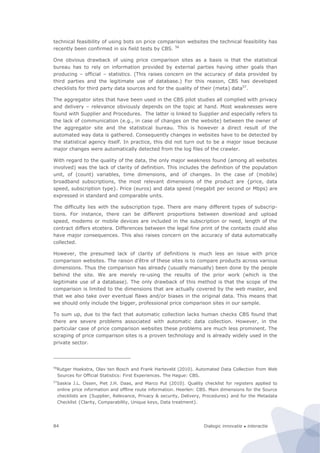
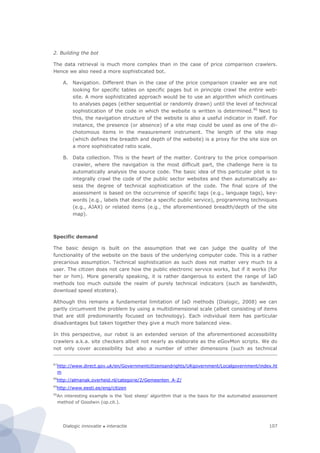
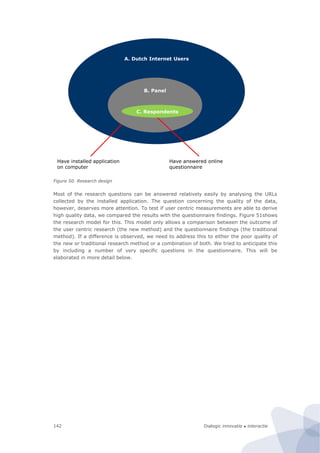
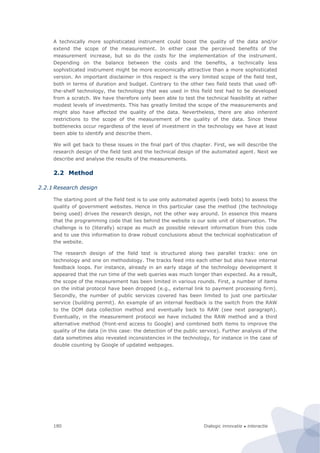
Figure 94. Research design of the site-centric field test
In our design the unit of observation is (the underlying code of) an individual website of a
public sector body. This is also our primary unit of analysis. The basic idea is that the
website is the infrastructure on which various services run. This is based on the
information architecture principle to design services as much as possible in a modular way.
This means that they share a common functionality (e.g., an authentication module) from
the underlying website. Thus although there can be marked differences between various
services (if only because they are geared towards different groups of users) they are
strongly affected by the overall design and performance of the website. In any case, from a
technological point a service and underlying website cannot be considered as separate
entities. For instance, a breach in the authentication module (as recently occurred in
several national and local government websites in the Netherlands) would affect all
services that run on the website. Hence given the fact that one website could have multiple
services, if one takes the individual service as a unit of observation that is a real threat of
double counting. This is the main methodological argument to choose the individual
website as a unit of analysis instead.
Furthermore, the same website will not be put under different categories. This ensures that
the classification is strictly exclusive. Instead of a classification along the lines of services –
where the same website can appear under several different categories – we use a
classification along the traditional administrative hierarchy (local, regional, and
national/federal government websites).158
To ensure that the results from the field test can eventually still be compared with the
results from the CapGemini benchmark we have still included the level of services but as a
derivative of the website. We merely assess whether a service is mentioned on a website,
and if so, and then attribute the characteristics of the website as a whole to the individual
service. In the field test, we have tested the feasibility of this approach on one of the
services that is covered by the ’20 service method’ from the CapGemini framework, namely
building permission. The reason to choose this particular service is that it is relevant in all
countries, and that it is concentrated at the local level.
158
Note that ‘independent governing bodies’ (which are usually at the national level) are not covered in
the field test. Examples of this type of bodies are Ambetsverk in Sweden, Bundesbehörden in
Germany, Executive Agencies in the UK, and Zelfstandige bestuursorganen (ZBO’s) in the
Netherlands. For a further classification see for instance: Manning, N. and Shepherd, G. (2009) GET
Brief: Arms Length Bodies. Washington DC: WorldBank (Global Expert Team on Public Sector
Performance).
Adjust Technology
Adjust Measument protocol
Analyse raw data
(face value & sanity check)
Further analyse data
(internal [in]consistency)
TECHNOLOGY
METHODOLOGY](https://image.slidesharecdn.com/2010-080-1226-130612144004-phpapp02/85/2010-080-1226-195-320.jpg)


![Dialogic innovatie ● interactie 207
3 Network centric: Traffic on Ger-
man broadband networks
3.1 Introduction
In this chapter we present and analyse field research aimed at studying the traffic on
German broadband networks. We try to measure this traffic by applying network centric
measurements. By using existing DPI188
devices in networks of a selected number of ISPs,
we aim at measuring both the type of applications used and the type of content travelling
over the networks.
The DPI devices installed in the networks of ISPs, are used by ISP-engineers for all kinds of
traffic management. Moreover, it allows them to gain insight into the traffic over their
network and to adjust the traffic during peak periods. A typical example of the last case is
slowing down certain P2P-applications in order to keep applications requiring high-quality
transmissions (e.g. gaming and telephone) working. However, network operators could
also use these devices to block certain types of traffic. The recent Dutch case of KPN
admitting that they had serious plans to block Internet VoIP services and instant
messaging applications on their mobile network in order to restore profitability is an
illustrative example of this.
DPI is highly related to network neutrality. Wikipedia defines this concept as: “[…] a
principle that advocates no restrictions by Internet service providers or governments on
consumers' access to networks that participate in the Internet”.189
Many violations of net
neutrality spark hardly or no public unrest, for example blocking websites that display
content that is illegal, unethical and/or hindering. Other examples are malware, spam and
websites containing child pornography. Most of this content can be blocked without using
DPI. However, IPSs could use DPI to protect their vertically integrated business model. For
example, they could block or hinder Skype in order to force customers to use their own,
more expensive traditional telephony service. Other examples are WhatsApp and Ping
versus SMS or all kinds of new versus old TV services.
Even though few ISPs admit they use DPI, research shows that a vast majority of the ISPs
in the Netherlands, Germany and the USA (temporarily) slow down BitTorrent traffic. 190
In
order to slow down this traffic, BitTorrent traffic has to be identified which is almost
certainly done using DPI equipment. Moreover, some market research firms estimate that
global sales of DPI equipment is currently well over $100 million and could rise to $1.6
billion in 2015.191
KPN –the Dutch incumbent telecommunication operator- was (one of) the first major ISPs
in the Western world that openly admitted they used DPI. For an audience of financial
analysts and financial journalists they elaborated on how they will remain profitable in a
market were the most profitable services (sms, phone calls) were quickly replaced by new
technologies (WhatsApp, Skype): “Within the capabilities of the network that is being
188
Deep packet inspection
189
http://en.wikipedia.org/wiki/Network_neutrality
190
http://dpi.ischool.syr.edu/MLab-Data.html
191
http://www.infonetics.com/pr/2011/1H11-DPI-Deep-Packet-Inspection-Market-Highlights.asp](https://image.slidesharecdn.com/2010-080-1226-130612144004-phpapp02/85/2010-080-1226-221-320.jpg)
![Dialogic innovatie ● interactie208
developed as well, we are able to identify [with] deep packet inspection what is the
destination of specific data packages that go along. [...] We are the first operator in the
world who has actually built that capability to actually identify where [WhatsApp] streams
are going to.” 192
Although this unplanned fifteen second statement in a four hour meeting
seemed insignificant, it resulted in an avalanche of reactions of many parties. This was
mainly triggered by the word DPI. Some of the reactions were:
KPNs DPI became a major item in the national TV news.
The most important Dutch newspapers listed the item with headings like: “KPN
stalks its customers online”
A Dutch digital civil rights organization (Bits of Freedom) placed a manual online
for KPN customers on how-to-report-KPN-to-the-police.
The case of KPN shows the sensitive nature of DPI. It certainly shows that there are major
doubts if applying DPI is socially acceptable.
Next to the desirability from a social perspective, there are very likely all kinds of legal
issues. At the time of writing, however, there is few to no jurisprudence concerning this
issue. Moreover, according to the different regulatory frameworks that could be used it is
arguable if applying DPI is legal or illegal. After the KPN case occurred, several
organisations researched this issue:
OPTA (The Dutch telecommunications regulatory authority) found that all four
Dutch mobile telecommunication operators used DPI but –when looking at the tele-
communication law- there are no ground for actions from their organisation.193
The Public Prosecution Service concluded that there were no reasons to prosecute
KPN. As they did not violate Article 139c of the Penal Code – focused on the inter-
ception of data. 194
Moreover, there is an exemption to this law if the activities are
conducted in order to enhance the quality of the network.195
Bits of Freedom had another interpretation of Article 139c and stated that KPN did
violate the law.196
The Dutch Data Protection Authority (CPB) is currently researching this topic.197
To make the legal issue even more complex, we must recognize that fact that regulatory
frameworks are not static. When looking back to the case of KPN we saw the following
pattern: Within approximately two months after this incident were KPN stated they used
DPI, the Dutch Parliament adopted a law stating that telecommunication providers were
not allowed to treat types of traffic in different ways. Although the discussion started with
DPI, it ended revolving around net neutrality.
With respect to this issues addressed above, research questions are:
192
See the following webstream after approximately three and a half hours:
http://pulse.companywebcast.nl/playerv1_0/default.aspx?id=12193&bb=true&swf=true
193
http://www.opta.nl/nl/actueel/alle-publicaties/publicatie/?id=3439
194
https://www.bof.nl/live/wp-content/uploads/briefOMoverDPI.pdf
195
Ibid.
196
https://www.bof.nl/2011/08/11/kpn-tapt-af-voor-marketing-ongewenst-maar-toegelaten-met-de-
brief/
197
http://www.telecompaper.com/news/opta-passes-dpi-investigation-onto-cbp](https://image.slidesharecdn.com/2010-080-1226-130612144004-phpapp02/85/2010-080-1226-222-320.jpg)


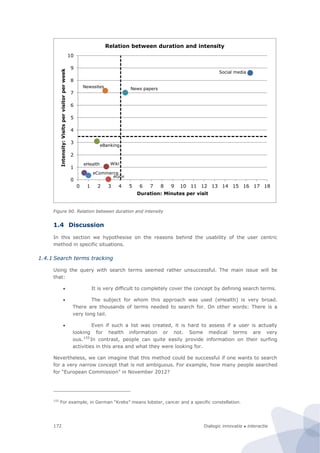
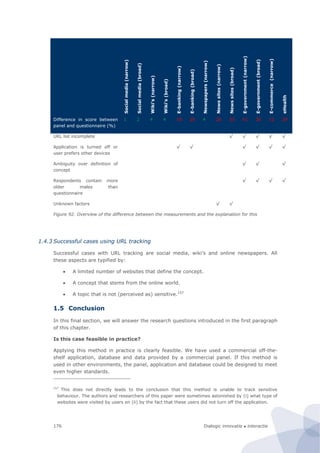
![Dialogic innovatie ● interactie 237
15 U hebt aangegeven dat u wel eens de applicatie/software uitzet of pauzeert. Onder
welke omstandigheden hebt u dat gedaan in de afgelopen drie maanden? We vragen dit
om de vragen beter te interpreteren.
(Meerdere antwoorden mogelijk, niet verplicht)
Als ik gebruik maak van e−mail
Als ik gebruik maak van e−banking
Als ik erotische websites bezoek
Als ik dating websites bezoek
Als ik webwinkels bezoek
Als ik medische informatie opzoek
Als ik met werken bezig ben
Als ik een andere gebruiker (bv een familielid) het
systeem laat gebruiken
Iets anders, namelijk
Dit is privé
16 Bedankt voor uw tijd! Heeft u nog opmerking of suggesties? Wij horen dit graag.
[OPEN VRAAG]](https://image.slidesharecdn.com/2010-080-1226-130612144004-phpapp02/85/2010-080-1226-251-320.jpg)


Digital Agenda for Europe Feasibility Study on Statistical Methods on Internet as a Source of Data Gathering [1] The study evaluates the feasibility of using Internet as a Data (IaD) source to complement traditional statistical sources for measuring socio-economic phenomena. [2] Nine IaD methods are assessed across three categories: user centric, network centric, and site centric. [3] Field tests of three methods found that user centric measurements using a generic OS monitor is promising but needs improvement, while network centric and site centric methods have challenges around validity, social acceptance, and legal issues that require further development and testing.


