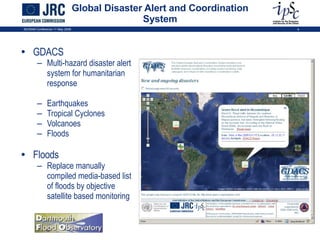
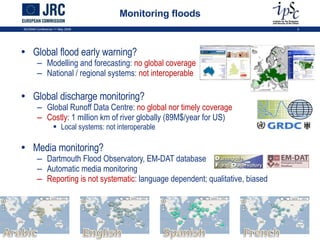
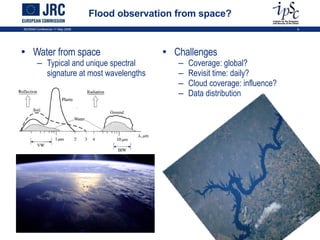
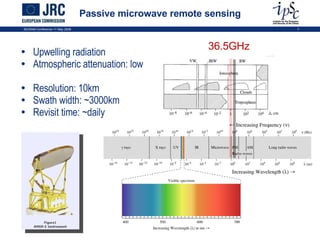
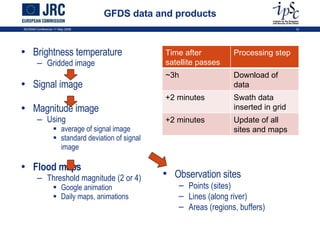
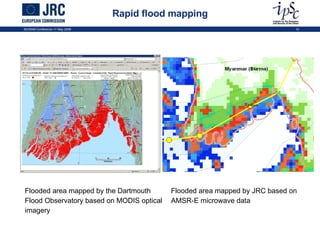
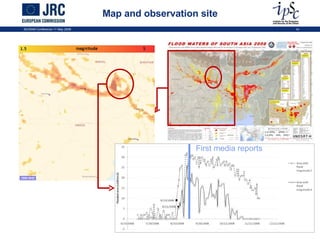
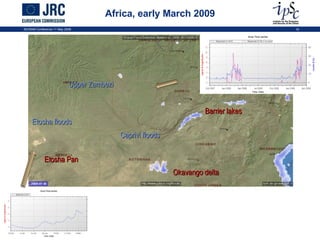
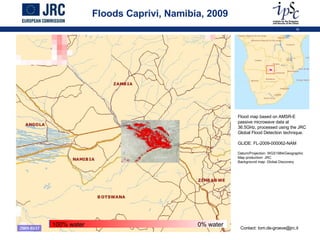
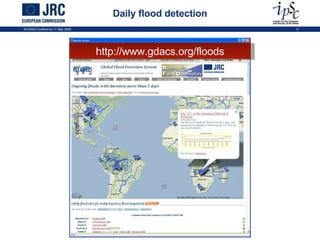
ISCRAM 2009 Conference Early flood detection and mapping for humanitarian response JRC Global Flood Detection System Joint Research Center Institute for the Protection and the Security of the Citizen GlobeSec – Global Security and Crisis Management Critech Tom De Groeve, Ph. D.
Floods –  underestimated natural disasters Floods cause major human suffering 78% of all population affected by disasters Floods affect 0.5 billion people / year 2 billion / year by 2050 46% of disasters are floods International aid for floods 1/3 of all humanitarian aid DG ECHO: €36 million 2002-2007 Figures from EM-DAT, OCHA, ECHO ISCRAM Conference 11 May 2009
Floods –  frequent, recurring natural disasters Top 10 floods in last 10 years Floods  kill  few people but  affect  a lot (EM-DAT CRED) Latest flood disasters  (ReliefWeb) Southern Africa, Mar-Apr 2009 Bolivia, Feb 2009 Guyana, Dec 2008 Malaysia, Dec 2008 Brazil, Nov 2008... Affecting the poor more ISCRAM Conference 11 May 2009 Country Date Killed Haiti 23 May 2004 2665 India 24 Jul 2005 1200 Bangladesh 21 Jul 2007 1110 India 3 Jul 2007 1103 India (Flash Flood) 11 Jun 2008 1063 Algeria 10 Nov 2001 921 India 20 Jun 2004 900 India 30 Aug 2008 900 India 18 Sep 2000 884 India 2 Aug 2000 867 Country Date Total Affected China 23 Jun 2003 150 million China 15 Jun 2007 105 million China (Flash flood) 8 Jun 2002 80 million India 21 Jun 2002 42 million Bangladesh 20 Jun 2004 36 million China 15 Jul 2004 33 million India 20 Jun 2004 33 million India 18 Sep 2000 24 million India 2 Aug 2000 22 million India 24 Jul 2005 20 million
Global Disaster Alert and Coordination System GDACS Multi-hazard disaster alert system for humanitarian response Earthquakes Tropical Cyclones Volcanoes Floods Floods Replace manually compiled media-based list of floods by objective satellite based monitoring ISCRAM Conference 11 May 2009
Monitoring floods Global flood early warning? Modelling and forecasting:  no global coverage National / regional systems:  not interoperable Global discharge monitoring? Global Runoff Data Centre:  no global nor timely coverage Costly : 1 million km of river globally (89M$/year for US) Local systems: not interoperable Media monitoring? Dartmouth Flood Observatory, EM-DAT database Automatic media monitoring Reporting is not systematic : language dependent; qualitative, biased ISCRAM Conference 11 May 2009
Flood observation from space? Water from space Typical and unique spectral signature at most wavelengths Challenges Coverage: global? Revisit time: daily? Cloud coverage: influence? Data distribution ISCRAM Conference 11 May 2009
Passive microwave remote sensing Upwelling radiation Atmospheric attenuation: low Resolution: 10km Swath width: ~3000km Revisit time: ~daily ISCRAM Conference 11 May 2009 36.5GHz
Passive microwave information Brightness temperature Grey Body and Black Body Influences Physical temperature  T Roughness of surface Material: dielectric constant In particular: H 2 O content Atmospheric attenuation and emission Emissivity at 36.5GHz * ISCRAM Conference 11 May 2009 * Rees, 1990. Physical Principles of Remote Sensing. ** Sharkov, 2003. Passive Microwave Remote Sensing of the Earth T T T b ε ** Material ε Water 0.3 - 0.5 Minerals 0.75 – 0.95 Sea Ice 0.75 – 0.95 T
Novel normalization methodology: Water signal T b  dry wet T b dry wet Dry pixel Wet pixel Influence of clouds is eliminated by comparing dry and wet signal Water has a lower brightness temperature than land 1 2 3 1 2 3 1 2 3 ISCRAM Conference 11 May 2009 flood signal
Calibration site Manual selection Must be dry Must be close to observation site for similar atmospheric effects Automatic selection Choose ‘hottest’ pixel nearby ISCRAM Conference 11 May 2009 Optimization of calibration window size and percentile. M w  > 0 C w  = 0
Anomaly detection Magnitude: relative importance  of peaks in time series ISCRAM Conference 11 May 2009 avg ( s ) sd ( s ) =  σ 3 σ 2 σ σ m  = 3 m  = 2 m  = 1
GFDS data and products Brightness temperature Gridded image Signal image Magnitude image Using  average of signal image standard deviation of signal image Flood maps Threshold magnitude (2 or 4) Google animation Daily maps, animations ISCRAM Conference 11 May 2009 Observation sites Points (sites) Lines (along river) Areas (regions, buffers) Time after satellite passes Processing step ~3h Download of data +2 minutes Swath data inserted in grid +2 minutes Update of all sites and maps
Rapid flood mapping ISCRAM Conference 11 May 2009 Flooded area mapped by the Dartmouth Flood Observatory based on MODIS optical imagery Flooded area mapped by JRC based on AMSR-E microwave data
Map and observation site ISCRAM Conference 11 May 2009 First media reports
Africa, early March 2009 ISCRAM Conference 11 May 2009 Okavango delta Barrier lakes Etosha Pan Caprivi floods Etosha floods Upper Zambezi
Floods Caprivi, Namibia, 2009 Flood map based on AMSR-E passive microwave data at 36.5GHz, processed using the JRC Global Flood Detection technique. GLIDE: FL-2009-000062-NAM Datum/Projection: WGS1984/Geographic Map production: JRC Background map: Global Discovery Contact: tom.de-groeve@jrc.it 100% water 0% water
Daily flood detection ISCRAM Conference 11 May 2009 http://www.gdacs.org/floods
Conclusions Near real time flood monitoring and mapping Turning Remote Sensing data into Flood Events, useful for early alert Integration with multi-hazard system +  international response community through GDACS Further work Coupling with other systems rainfall, weather based (e.g. TRMM flood potential) Examining potential for other applications Measuring impact on agriculture, population Tasking satellite acquisitions for high resolution mapping Improving technique Additional satellite sensors Reducing noise ISCRAM Conference 11 May 2009

2009 De Groeve Iscram Conference

  • 1.
    ISCRAM 2009 ConferenceEarly flood detection and mapping for humanitarian response JRC Global Flood Detection System Joint Research Center Institute for the Protection and the Security of the Citizen GlobeSec – Global Security and Crisis Management Critech Tom De Groeve, Ph. D.
  • 2.
    Floods – underestimated natural disasters Floods cause major human suffering 78% of all population affected by disasters Floods affect 0.5 billion people / year 2 billion / year by 2050 46% of disasters are floods International aid for floods 1/3 of all humanitarian aid DG ECHO: €36 million 2002-2007 Figures from EM-DAT, OCHA, ECHO ISCRAM Conference 11 May 2009
  • 3.
    Floods – frequent, recurring natural disasters Top 10 floods in last 10 years Floods kill few people but affect a lot (EM-DAT CRED) Latest flood disasters (ReliefWeb) Southern Africa, Mar-Apr 2009 Bolivia, Feb 2009 Guyana, Dec 2008 Malaysia, Dec 2008 Brazil, Nov 2008... Affecting the poor more ISCRAM Conference 11 May 2009 Country Date Killed Haiti 23 May 2004 2665 India 24 Jul 2005 1200 Bangladesh 21 Jul 2007 1110 India 3 Jul 2007 1103 India (Flash Flood) 11 Jun 2008 1063 Algeria 10 Nov 2001 921 India 20 Jun 2004 900 India 30 Aug 2008 900 India 18 Sep 2000 884 India 2 Aug 2000 867 Country Date Total Affected China 23 Jun 2003 150 million China 15 Jun 2007 105 million China (Flash flood) 8 Jun 2002 80 million India 21 Jun 2002 42 million Bangladesh 20 Jun 2004 36 million China 15 Jul 2004 33 million India 20 Jun 2004 33 million India 18 Sep 2000 24 million India 2 Aug 2000 22 million India 24 Jul 2005 20 million
  • 4.
    Global Disaster Alertand Coordination System GDACS Multi-hazard disaster alert system for humanitarian response Earthquakes Tropical Cyclones Volcanoes Floods Floods Replace manually compiled media-based list of floods by objective satellite based monitoring ISCRAM Conference 11 May 2009
  • 5.
    Monitoring floods Globalflood early warning? Modelling and forecasting: no global coverage National / regional systems: not interoperable Global discharge monitoring? Global Runoff Data Centre: no global nor timely coverage Costly : 1 million km of river globally (89M$/year for US) Local systems: not interoperable Media monitoring? Dartmouth Flood Observatory, EM-DAT database Automatic media monitoring Reporting is not systematic : language dependent; qualitative, biased ISCRAM Conference 11 May 2009
  • 6.
    Flood observation fromspace? Water from space Typical and unique spectral signature at most wavelengths Challenges Coverage: global? Revisit time: daily? Cloud coverage: influence? Data distribution ISCRAM Conference 11 May 2009
  • 7.
    Passive microwave remotesensing Upwelling radiation Atmospheric attenuation: low Resolution: 10km Swath width: ~3000km Revisit time: ~daily ISCRAM Conference 11 May 2009 36.5GHz
  • 8.
    Passive microwave informationBrightness temperature Grey Body and Black Body Influences Physical temperature T Roughness of surface Material: dielectric constant In particular: H 2 O content Atmospheric attenuation and emission Emissivity at 36.5GHz * ISCRAM Conference 11 May 2009 * Rees, 1990. Physical Principles of Remote Sensing. ** Sharkov, 2003. Passive Microwave Remote Sensing of the Earth T T T b ε ** Material ε Water 0.3 - 0.5 Minerals 0.75 – 0.95 Sea Ice 0.75 – 0.95 T
  • 9.
    Novel normalization methodology:Water signal T b dry wet T b dry wet Dry pixel Wet pixel Influence of clouds is eliminated by comparing dry and wet signal Water has a lower brightness temperature than land 1 2 3 1 2 3 1 2 3 ISCRAM Conference 11 May 2009 flood signal
  • 10.
    Calibration site Manualselection Must be dry Must be close to observation site for similar atmospheric effects Automatic selection Choose ‘hottest’ pixel nearby ISCRAM Conference 11 May 2009 Optimization of calibration window size and percentile. M w > 0 C w = 0
  • 11.
    Anomaly detection Magnitude:relative importance of peaks in time series ISCRAM Conference 11 May 2009 avg ( s ) sd ( s ) = σ 3 σ 2 σ σ m = 3 m = 2 m = 1
  • 12.
    GFDS data andproducts Brightness temperature Gridded image Signal image Magnitude image Using average of signal image standard deviation of signal image Flood maps Threshold magnitude (2 or 4) Google animation Daily maps, animations ISCRAM Conference 11 May 2009 Observation sites Points (sites) Lines (along river) Areas (regions, buffers) Time after satellite passes Processing step ~3h Download of data +2 minutes Swath data inserted in grid +2 minutes Update of all sites and maps
  • 13.
    Rapid flood mappingISCRAM Conference 11 May 2009 Flooded area mapped by the Dartmouth Flood Observatory based on MODIS optical imagery Flooded area mapped by JRC based on AMSR-E microwave data
  • 14.
    Map and observationsite ISCRAM Conference 11 May 2009 First media reports
  • 15.
    Africa, early March2009 ISCRAM Conference 11 May 2009 Okavango delta Barrier lakes Etosha Pan Caprivi floods Etosha floods Upper Zambezi
  • 16.
    Floods Caprivi, Namibia,2009 Flood map based on AMSR-E passive microwave data at 36.5GHz, processed using the JRC Global Flood Detection technique. GLIDE: FL-2009-000062-NAM Datum/Projection: WGS1984/Geographic Map production: JRC Background map: Global Discovery Contact: tom.de-groeve@jrc.it 100% water 0% water
  • 17.
    Daily flood detectionISCRAM Conference 11 May 2009 http://www.gdacs.org/floods
  • 18.
    Conclusions Near realtime flood monitoring and mapping Turning Remote Sensing data into Flood Events, useful for early alert Integration with multi-hazard system + international response community through GDACS Further work Coupling with other systems rainfall, weather based (e.g. TRMM flood potential) Examining potential for other applications Measuring impact on agriculture, population Tasking satellite acquisitions for high resolution mapping Improving technique Additional satellite sensors Reducing noise ISCRAM Conference 11 May 2009