This is my scorecard, what I infer from my simplified worksheet (...)
•
0 likes•227 views

(...) crossing balance sheet, income and cash flow statements. We are checking the health of SAM - The Boston Beer Company, Inc. ° A really high Altman's Z-score and a very robust history of positive and growing operating income; ° No debt - interest expenses; ° Piotroski score is very robust; ° A recent (relatively) high fcfy due to lower market cap; ° Slowing sales growth (now negative) and pressure in assets turnover and gross margin (high competition in the growing craft beer category); ° Roic, has been particularly subdued recently, BUT never under low 20s ° Tangible book value per share growth has been outstanding.

Recommended
More Related Content
What's hot
Similar to This is my scorecard, what I infer from my simplified worksheet (...)
Similar to This is my scorecard, what I infer from my simplified worksheet (...) (20)
More from Giuseppe Piazzolla
More from Giuseppe Piazzolla (19)
Recently uploaded
Recently uploaded (20)
This is my scorecard, what I infer from my simplified worksheet (...)
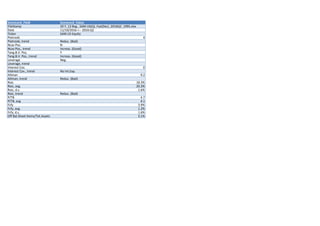
- 1. Scorecard_Field Scorecard_Value FileStamp 20 Y_13 Bvg._SAM US(Q)_Fye(Dec)_2016Q2_1995.xlsx Date 11/10/2016 <-- 2016:Q2 Ticker SAM US Equity Piotroski 4 Piotroski, trend Reduc. (Bad) Ncav Pos. N Ncav Pos., trend Increas. (Good) Tang.B.V. Pos. Y Tang.B.V. Pos., trend Increas. (Good) Leverage Neg. Leverage, trend Interest Cov. 0 Interest Cov., trend No Int.Exp. Altman 9.2 Altman, trend Reduc. (Bad) Roic 18.3% Roic, avg. 20.3% Roic, d.s. 1.6% Roic, trend Reduc. (Bad) P/TB 4.7 P/TB, avg 4.1 Fcfy 3.9% Fcfy, avg. 1.2% Fcfy, d.s. 1.6% Off Bal.Sheet Items/Tot.Assets 3.1%
- 2. Altman & Co. 12/2015 EQY Calc.: Calc.: 1.2 * RR879 RR150 BS065 RR803 Copy Copy RR800 RA12 RA12 RA12 RR208 Calc.: RX206 BS180 RR208 RR264 SAM US USD Tr.E/Tr. ND/Ebi Altman' Tang.Ass. Work.Cap. Ret.Earnings T12M_Oi(L) Hist.Market Tot.Liab. Tr.12M Net S&P S&P S&P Net Debt ND/Ebi Ebitdar Curr.Rent Net Debt EBIT/Int.E 2005 Q2 2005 115.50 -64.69 2005 Q3 2005 117.45 -61.65 2005 Q4 2005 117.68 -63.94 2006 Q1 2006 119.65 63.63 15.35 19.68 246.48 -59.17 2006 Q2 2006 10.0 130.59 67.87 19.93 24.13 407.54 37.34 264.18 -65.12 2006 Q3 2006 9.5 146.32 74.53 25.81 26.11 460.18 44.88 276.84 -75.53 2006 Q4 2006 10.0 153.10 79.69 28.29 27.95 507.31 45.89 285.43 -82.37 2007 Q1 2007 Neg. 10.4 158.91 88.42 34.06 34.10 477.13 41.72 300.99 -81.47 2007 Q2 2007 Neg. 10.4 174.49 95.58 40.85 35.78 564.03 49.04 314.53 -92.79 2007 Q3 2007 Neg. 11.8 180.17 91.06 44.03 31.19 699.63 49.45 322.80 -91.01 2007 Q4 2007 Neg. 8.2 196.58 77.74 44.69 40.33 534.43 64.37 341.65 -95.49 2008 Q1 2008 Neg. 9.0 185.15 59.26 25.63 30.38 669.13 66.88 345.32 -71.16 2008 Q2 2008 Neg. 7.1 204.53 8.46 34.16 31.31 561.40 74.31 369.83 -19.39 2008 Q3 2008 Neg. 8.7 201.60 -2.25 33.86 28.24 685.03 66.89 386.81 -10.57 2008 Q4 2008 Neg. 5.3 218.38 1.80 37.23 21.86 379.35 79.73 398.40 -9.07 2009 Q1 2009 Neg. 5.1 215.31 3.78 38.60 26.08 317.24 74.09 403.35 -4.15 2009 Q2 2009 Neg. 5.5 237.07 13.62 47.67 32.57 425.30 85.18 404.05 -28.59 2009 Q3 2009 Neg. 6.5 250.18 28.01 56.81 49.23 532.87 86.26 411.64 -44.80 2009 Q4 2009 Neg. 7.2 261.56 39.24 61.35 54.27 667.04 89.78 415.05 -55.48 2010 Q1 2010 Neg. 8.1 252.88 37.61 54.08 61.78 732.64 86.14 428.01 -38.66 2010 Q2 2010 Neg. 9.2 264.72 44.07 53.66 67.01 974.46 93.54 439.50 -53.68 2010 Q3 2010 Neg. 8.7 265.54 38.52 47.42 75.19 930.15 99.21 455.25 -53.19 2010 Q4 2010 20.5 Neg. 11.7 257.15 39.81 43.44 81.18 1,311.54 92.94 463.80 -48.97 -6.78 20.49 2011 Q1 2011 38.1 Neg. 11.2 261.39 48.78 45.87 77.46 1,206.00 90.58 471.94 -45.32 -5.80 38.14 2011 Q2 2011 37.7 Neg. 10.1 283.88 59.62 52.79 95.75 1,171.77 103.26 476.34 -66.32 95 -34.66 37.68 2011 Q3 2011 55.7 Neg. 8.9 273.43 45.61 40.85 96.80 952.21 102.70 486.68 -48.12 96 -39.11 55.75 2011 Q4 2011 16.6 Neg. 13.2 271.11 58.67 46.28 103.66 1,391.99 87.74 513.00 -49.45 97 -25.80 16.58 2012 Q1 2012 23.1 Neg. 13.8 274.99 58.68 50.04 108.91 1,377.40 81.96 524.10 -38.16 98 -43.91 23.07 2012 Q2 2012 114.0 Neg. 13.0 303.04 61.11 60.54 87.43 1,549.63 95.02 537.64 -40.52 99 -1.6 23.74 0.96 -44.35 114.02 2012 Q3 2012 Neg. 11.4 333.45 67.05 76.31 94.33 1,434.69 105.57 569.28 -62.21 00 -1.2 23.56 1.00 -35.11 2012 Q4 2012 1000.0 Neg. 12.0 356.95 73.45 87.66 95.58 1,703.61 114.39 580.22 -73.84 01 -2.1 19.13 0.99 -47.87 1,043.91 2013 Q1 2013 Neg. 15.5 342.79 57.48 79.87 93.43 2,046.41 99.73 602.88 -31.50 02 -2.3 19.12 1.30 -52.61 2013 Q2 2013 Neg. 13.6 374.23 40.96 84.70 102.03 2,173.23 123.23 636.71 -24.06 03 -1.4 24.28 1.30 -42.89 2013 Q3 2013 Neg. 15.3 428.75 48.23 110.39 110.96 3,116.10 151.01 686.68 -43.09 04 -2.0 25.81 1.30 -59.79 2013 Q4 2013 Neg. 16.1 440.39 59.90 128.93 113.09 3,086.22 141.99 739.05 -48.89 05 -1.9 29.14 1.30 -63.94 2014 Q1 2014 Neg. 17.0 475.68 58.27 137.25 116.80 3,142.73 135.26 786.97 -27.39 06 -2.1 34.34 1.40 -82.37 2014 Q2 2014 Neg. 13.6 530.19 49.60 162.68 125.24 2,882.86 162.14 837.25 -30.70 07 -1.9 47.78 0.80 -95.49 2014 Q3 2014 Neg. 13.8 568.61 65.28 200.60 143.65 2,858.08 159.91 890.57 -56.60 08 0.0 29.80 1.30 -9.07 2014 Q4 2014 1000.0 Neg. 16.7 601.48 97.29 211.10 146.57 3,865.24 169.02 903.01 -75.82 09 -0.6 72.59 1.40 -55.48 2015 Q1 2015 1000.0 Neg. 16.3 651.94 148.35 215.36 155.31 3,565.00 160.51 918.67 -121.63 10 -0.4 99.91 1.30 -48.97 2015 Q2 2015 Neg. 13.5 688.83 162.89 232.00 161.64 3,148.64 177.83 939.26 -146.51 11 -0.3 123.85 1.40 -49.45 2015 Q3 2015 Neg. 11.5 687.23 139.48 209.60 161.87 2,823.32 196.12 962.62 -134.14 12 -0.5 117.79 2.00 -73.84 2015 Q4 2015 Neg. 11.4 641.72 112.44 171.00 156.18 2,620.16 184.18 959.93 -93.66 13 -0.2 141.70 2.70 -48.89 2016 Q1 2016 Neg. 10.9 604.15 80.97 117.25 145.27 2,334.05 172.48 949.26 -50.66 14 -0.3 184.91 3.20 -75.82 2016 Q2 2016 Neg. 9.3 586.89 57.18 79.89 140.24 1,949.35 178.34 941.87 #N/A #N/A #N/A -27.11 15 -0.3 202.46 3.40 -93.66 0.0 5.0 10.0 15.0 20.0 2005 Q2 2007 Q4 2010 Q2 2012 Q4 2015 Q2 Altman's Z-Score 0 100 200 2007 Q1 2009 Q1 2011 Q1 2013 Q1 2015 Q1 'Ocf-Int.Exp.' 0 500 1,000 1,500 0.0 0.2 0.4 0.6 0.8 1.0 2007 Q2 2010 Q2 2013 Q2 2016 Q2 Ebit/I.E. NetD./Ebit Leverage & Coverage Ratio (based on Ebit) ND/Ebit Tr.E/Tr.Ie 4 Perc. Media Mobile (ND/Ebit) -2.5 -2.0 -1.5 -1.0 -0.5 0.0 0.5 05 06 07 08 09 10 11 12 13 14 15 Adj.N.D/Ebitdar Adj. Lev. Ratio --> based on adj. net d. [net d.+ (Rent.Exp. x 7) and Ebitdar (before or plus rental costs)
- 3. Piotr&Co 12/2015 EQY IS040 CF015 BS035 Time … E/Cf r. BS051 RR053BS081 I RI I C SAM US USD Inc(L.)_bef_ Cfo Tot.Ass. ROA CFO F_ROA F_CFO Roa Cfr t_R Acc Long Term Cur.R.Shares t_L t_Li t_S S GPCDt_A t_G Piot 2005 Q2 2005 5.14 9.72 116.87 3.3 14.2 2005 Q3 2005 4.19 7.31 118.83 2.8 13.9 2005 Q4 2005 2.27 7.24 119.05 3.1 13.9 2006 Q1 2006 1.82 18.07 121.03 3.3 13.9 2006 Q2 2006 7.99 -8.85 131.96 13.7% 20.0% 13.7% 6.3% 1 1 1 1 3.1 13.91 1 1 6 2006 Q3 2006 5.91 14.20 147.70 15.0% 25.5% 1.3% 10.6% 1 1 1 1 2.9 14.01 1 5 2006 Q4 2006 2.48 5.55 154.48 14.4% 22.9% -0.6% 8.5% 1 1 1 2.9 13.92 1 1 1 6 2007 Q1 2007 5.77 -2.13 160.29 15.8% 6.3% 1.5% -9.6% 1 1 1 3.4 14.31 1 1 1 6 2007 Q2 2007 6.79 15.52 175.87 13.9% 21.9% -2.0% 8.1% 1 1 1 3.2 14.33 1 4 2007 Q3 2007 3.18 10.34 181.55 11.6% 18.6% -2.3% 7.0% 1 1 1 3.0 14.38 1 4 2007 Q4 2007 6.76 30.07 197.96 13.4% 32.0% 1.8% 18.6% 1 1 1 1 2.3 14.20 1 1 6 2008 Q1 2008 -3.74 10.02 186.53 7.3% 36.9% -6.1% 29.6% 1 1 1 1.9 13.97 1 1 5 2008 Q2 2008 8.53 10.96 205.90 8.0% 33.4% 0.7% 25.4% 1 1 1 1 1.1 14.04 1 5 2008 Q3 2008 -0.30 6.20 202.98 5.8% 29.8% -2.1% 23.9% 1 1 1 1.0 14.16 1 4 2008 Q4 2008 3.60 12.67 219.76 4.0% 19.9% -1.8% 15.8% 1 1 1 1.0 14.18 1 4 2009 Q1 2009 1.37 0.12 216.69 6.5% 14.6% 2.4% 8.2% 1 1 1 1 1.1 14.26 1 1 1 7 2009 Q2 2009 11.92 31.59 238.44 7.8% 23.9% 1.4% 16.1% 1 1 1 1 1.2 14.19 1 1 1 7 2009 Q3 2009 10.37 16.83 251.56 12.5% 28.1% 4.6% 15.6% 1 1 1 1 1.4 14.25 1 1 6 2009 Q4 2009 7.46 17.02 262.94 13.6% 28.6% 1.1% 15.0% 1 1 1 1 1.5 14.25 1 1 1 1 8 2010 Q1 2010 6.26 -3.01 254.26 14.7% 25.5% 1.1% 10.8% 1 1 1 1 1.5 14.07 1 1 1 1 8 2010 Q2 2010 16.27 30.72 266.09 16.0% 24.3% 1.3% 8.4% 1 1 1 1 1.6 13.90 1 1 1 1 8 2010 Q3 2010 15.45 26.36 266.92 17.6% 27.5% 1.6% 9.9% 1 1 1 1 1.5 13.60 1 1 1 7 2010 Q4 2010 12.17 14.31 258.53 19.0% 25.9% 1.4% 6.9% 1 1 1 1 1.6 13.40 1 1 1 1 8 2011 Q1 2011 3.96 -2.31 262.77 18.2% 26.3% -0.7% 8.1% 1 1 1 1.7 13.43 1 1 1 1 7 2011 Q2 2011 28.02 44.75 285.26 22.5% 31.4% 4.3% 8.9% 1 1 1 1 1.7 13.20 1 1 1 1 1 9 2011 Q3 2011 16.30 15.49 274.81 22.8% 27.3% 0.3% 4.5% 1 1 1 1 1.6 12.87 1 1 1 1 8 2011 Q4 2011 17.79 14.84 272.49 24.6% 27.1% 1.8% 2.5% 1 1 1 1 1.9 12.82 1 1 1 1 1 9 2012 Q1 2012 7.49 1.75 277.53 25.4% 28.1% 0.9% 2.6% 1 1 1 1 2.0 12.90 1 1 1 1 8 2012 Q2 2012 14.35 21.54 305.58 20.3% 19.4% -5.2% -0.8% 1 1 0.57 1.8 12.81 1 1 4 2012 Q3 2012 20.75 41.50 335.99 21.9% 28.8% 1.6% 7.0% 1 1 1 1 0.57 1.8 12.81 1 5 2012 Q4 2012 16.87 30.54 359.48 20.4% 32.7% -1.5% 12.3% 1 1 1 0.57 1.8 12.81 1 1 1 6 2013 Q1 2013 6.91 -12.83 345.33 18.4% 25.2% -2.0% 6.8% 1 1 1 0.74 1.8 12.82 3 2013 Q2 2013 19.72 30.82 376.77 18.9% 26.4% 0.5% 7.6% 1 1 1 1 0.77 1.4 12.74 1 5 2013 Q3 2013 25.69 48.89 432.43 19.6% 27.6% 0.8% 8.0% 1 1 1 1 0.58 1.4 12.74 1 5 2013 Q4 2013 18.08 33.10 444.08 19.1% 27.2% -0.5% 8.0% 1 1 1 0.58 1.6 12.75 1 1 1 6 2014 Q1 2014 8.32 -8.81 479.36 17.7% 25.7% -1.4% 8.0% 1 1 1 0.53 1.6 12.97 1 1 1 6 2014 Q2 2014 25.43 47.13 533.87 17.7% 27.5% -0.1% 9.8% 1 1 1 0.53 1.4 12.97 1 1 5 2014 Q3 2014 37.93 64.24 572.30 19.4% 29.4% 1.8% 9.9% 1 1 1 1 0.53 1.5 12.98 1 1 6 2014 Q4 2014 19.07 38.65 605.16 17.9% 27.9% -1.5% 10.0% 1 1 1 0.53 1.9 13.07 1 1 5 2015 Q1 2015 13.74 21.23 655.62 17.4% 31.0% -0.5% 13.6% 1 1 1 0.47 2.5 13.30 1 1 5 2015 Q2 2015 29.93 57.13 692.51 17.1% 30.8% -0.3% 13.7% 1 1 1 0.47 2.4 13.25 1 1 1 1 7 2015 Q3 2015 38.62 64.12 690.92 16.1% 28.7% -1.0% 12.7% 1 1 1 0.47 2.1 12.98 1 1 1 6 2015 Q4 2015 16.12 26.21 645.40 14.6% 25.1% -1.5% 10.4% 1 1 1 0.47 2.0 12.76 1 1 5 2016 Q1 2016 7.03 6.27 607.83 13.6% 22.8% -1.0% 9.2% 1 1 1 0.41 1.8 12.661 1 1 1 6 2016 Q2 2016 26.62 42.05 590.57 13.2% 20.8% -0.4% 7.5% 1 1 1 0.41 1.5 12.377 1 4 Profitability Sign. Funding Sign. Effic. 42% 44% 46% 48% 50% 52% 54% 56% 58% 0.0 0.5 1.0 1.5 2.0 2.5 3.0 2007 Q2 2009 Q1 2010 Q4 2012 Q3 2014 Q2 2016 Q1 MarginsA.Turnover A.Turn. Gm 4 4 6 5 5 4 4 7 7 6 8 8 8 7 8 7 9 8 9 8 4 5 6 3 5 5 6 6 5 6 5 5 7 6 5 6 4 0 2 4 6 8 -10% -5% 0% 5% 10% 2007 Q2 2009 Q1 2010 Q4 2012 Q3 2014 Q2 2016 Q1 PiotroskiScore Fcfy-Rev.Growth Historical Piotroski score, fcfy & revenue growth Piotr. Fcfy Tr.S.Gr.
- 4. Invested Capital & Roic 12/2015 EQY FUND YEARCalc.: Book Value+Total Liab.-Current Liab.-CashRR008 Calc.: FCF - Special Non Cash items (like Deferred Taxes, One time items)RX215 Calc.: Cfo Calc.: CapEx Calc.: Acq.Intang.AssetsVM013 VM014 RX564 RR710 SAM US EquityUSD Inv.Cap. Fcf Owner E. Inv.Cap. Check I.C. T12Cfo T12CapEx T12Acq.I.A. W.Roic Roic/W Croic Op.Roic RoicRe-b. RoicYoY N.Gr. Fcfy Ch. Nopat 2005 Q2 2005 86.25 5.21 88.28 88.28 18.3% 1.9 28.4% 17.5% 4.81 2005 Q3 2005 83.98 3.34 86.46 86.46 19.8% 2.2 30.1% 18.5% 3.82 2005 Q4 2005 85.98 4.22 87.70 87.70 16.5% 1.8 27.6% 16.9% 1.91 2006 Q1 2006 89.20 17.17 29.93 91.79 91.79 42.34 -12.42 13.4% 1.5 32.6% 22.1% 13.5% 1.43 2006 Q2 2006 53.80 -10.67 14.05 97.22 97.22 23.77 -9.72 15.3% 1.8 14.5% 26.0% 15.8% 15.8% -7.8% 3.4% 7.45 2006 Q3 2006 51.58 9.23 19.94 105.42 105.42 30.67 -10.73 15.4% 2.0 18.9% 27.2% 16.7% 16.7% -4.7% 4.3% 5.18 2006 Q4 2006 50.46 4.20 19.92 110.53 110.53 28.98 -9.06 13.6% 1.6 18.0% 28.2% 16.2% 16.2% 4.1% 3.9% 2.02 2007 Q1 2007 62.03 -4.67 -1.92 120.55 120.55 8.77 -10.69 15.6% 1.8 -1.6% 32.1% 18.6% 18.6% 65.0% -0.4% 5.09 2007 Q2 2007 59.60 9.51 18.26 128.72 128.72 33.14 -14.88 15.0% 1.7 14.2% 31.7% 18.0% 18.0% 39.3% 3.2% 8.06 2007 Q3 2007 65.22 0.27 9.31 133.86 133.86 29.28 -19.97 12.4% 1.5 7.0% 26.1% 14.6% 14.6% 9.5% 1.3% 2.32 2007 Q4 2007 58.51 23.08 28.19 135.05 135.05 53.79 -25.61 14.4% 1.3 20.9% 32.8% 17.7% 17.7% 35.2% 5.3% 6.29 2008 Q1 2008 52.55 3.75 36.60 121.22 121.22 65.94 -29.34 10.8% 0.9 30.2% 25.1% 12.8% 12.8% -23.2% 5.5% -1.50 2008 Q2 2008 116.18 -9.33 17.76 133.09 133.09 61.39 -43.62 10.1% 0.9 13.3% 23.9% 12.0% 12.0% -24.6% 3.2% 8.23 2008 Q3 2008 129.39 -12.58 4.91 137.54 137.54 57.24 -52.33 7.6% 0.7 3.6% 20.8% 9.7% 9.7% -26.9% 0.7% -0.24 2008 Q4 2008 143.63 -1.53 -19.70 147.17 147.17 39.84 -59.54 12.8% 1.4 -13.4% 15.5% 8.0% 8.0% -49.4% -5.2% 4.52 2009 Q1 2009 150.96 -5.05 -28.50 142.88 149.77 29.95 -58.45 15.0% 1.5 -18.9% 19.7% 10.5% 10.2% -8.4% -9.0% 1.37 2009 Q2 2009 137.06 26.56 7.39 153.64 160.52 50.58 -43.19 16.3% 1.7 4.8% 22.7% 12.2% 11.9% 14.3% 1.7% 11.89 2009 Q3 2009 132.78 15.14 35.12 165.61 172.49 61.22 -26.10 21.7% 2.3 21.2% 32.5% 18.6% 18.1% 120.1% 6.6% 10.35 2009 Q4 2009 133.67 11.93 48.58 181.03 181.03 65.57 -16.99 17.5% 2.1 26.8% 33.1% 18.9% 18.9% 182.1% 7.3% 7.45 2010 Q1 2010 146.72 -5.09 48.54 168.37 176.05 62.43 -13.89 21.8% 2.6 28.8% 39.7% 23.1% 22.1% 159.0% 6.6% 6.26 2010 Q2 2010 136.02 28.59 50.57 172.77 180.45 61.57 -10.99 23.8% 2.7 29.3% 41.1% 24.7% 23.7% 129.9% 5.2% 16.26 2010 Q3 2010 132.48 20.55 55.98 167.92 175.60 71.10 -15.11 27.6% 3.1 33.3% 45.1% 27.3% 26.1% 61.6% 6.0% 15.49 2010 Q4 2010 137.36 10.72 54.78 176.15 176.15 68.39 -13.61 29.9% 2.8 31.1% 45.5% 28.1% 28.1% 61.6% 4.2% 12.17 2011 Q1 2011 147.40 -4.56 55.30 172.33 182.77 69.08 -13.78 29.4% 2.9 32.1% 45.5% 28.1% 26.7% 33.2% 4.6% 3.95 2011 Q2 2011 136.36 40.97 67.69 182.05 192.49 83.10 -15.42 34.3% 3.1 37.2% 54.0% 33.6% 32.0% 47.8% 5.8% 28.00 2011 Q3 2011 144.13 9.22 56.36 172.17 182.61 72.23 -15.87 36.7% 3.5 32.7% 56.9% 35.5% 33.7% 32.8% 5.9% 16.27 2011 Q4 2011 155.99 7.53 53.16 193.60 193.60 72.76 -19.60 33.2% 3.4 27.5% 56.1% 35.8% 35.8% 31.9% 3.8% 17.95 2012 Q1 2012 178.03 -11.77 45.96 195.67 204.46 76.83 -30.87 34.8% 3.7 23.5% 59.2% 37.9% 36.0% 45.6% 3.3% 7.49 2012 Q2 2012 191.46 3.26 8.24 211.25 220.04 53.62 -45.38 25.8% 2.8 3.9% 44.5% 28.5% 27.2% -5.2% 0.5% 14.36 2012 Q3 2012 189.69 23.78 22.81 231.12 239.91 79.63 -56.82 25.5% 3.0 9.9% 46.8% 30.0% 28.7% 1.0% 1.6% 20.72 2012 Q4 2012 196.13 15.04 30.32 261.85 261.85 95.33 -65.01 24.0% 2.9 11.6% 42.0% 26.1% 26.1% -9.4% 1.8% 16.93 2013 Q1 2013 238.26 -34.01 8.08 246.55 262.56 80.75 -72.67 24.9% 3.3 3.3% 42.3% 26.7% 25.3% -14.5% 0.4% 7.00 2013 Q2 2013 253.86 6.43 11.25 254.51 270.52 90.03 -78.77 26.3% 3.5 4.4% 43.8% 27.7% 26.3% 15.2% 0.5% 19.86 2013 Q3 2013 263.56 21.35 8.82 282.14 298.15 97.42 -88.60 25.5% 3.3 3.1% 43.2% 27.1% 25.8% 14.9% 0.3% 25.70 2013 Q4 2013 290.17 5.55 -0.67 323.37 323.37 99.98 -100.66 24.6% 3.2 -0.2% 38.6% 24.2% 24.2% 19.0% 0.0% 18.19 2014 Q1 2014 353.18 -52.98 -19.65 345.02 365.51 104.00 -123.65 23.5% 2.6 -5.6% 39.5% 24.4% 23.0% 22.1% -0.6% 8.40 2014 Q2 2014 377.77 2.85 -23.23 372.59 393.08 120.31 -143.54 23.3% 2.8 -6.1% 39.9% 24.7% 23.4% 19.7% -0.8% 25.31 2014 Q3 2014 392.73 24.40 -20.18 413.29 433.78 135.67 -155.85 24.0% 2.9 -4.9% 41.3% 25.9% 24.6% 29.3% -0.7% 38.14 2014 Q4 2014 418.59 15.16 -10.57 474.42 474.65 141.21 -151.78 22.8% 2.9 -2.2% 36.7% 22.9% 22.9% 28.9% -0.3% 19.49 2015 Q1 2015 431.41 2.54 44.94 495.75 533.53 171.25 -126.30 -0.10 23.0% 2.8 9.1% 36.9% 23.0% 21.6% 33.9% 1.3% 13.95 2015 Q2 2015 427.16 36.94 79.03 515.18 552.96 181.25 -102.21 -0.20 23.1% 2.4 15.3% 36.4% 22.9% 21.5% 31.0% 2.5% 29.89 2015 Q3 2015 423.51 47.39 102.02 495.36 533.14 181.12 -79.10 -0.30 24.1% 2.6 20.6% 35.6% 22.5% 21.2% 13.9% 3.6% 38.96 2015 Q4 2015 440.05 7.63 94.50 501.50 501.72 168.68 -74.19 -0.40 20.1% 2.3 18.8% 32.0% 20.3% 20.3% 9.2% 3.6% 16.35 2016 Q1 2016 455.18 -6.74 85.22 436.03 475.76 153.73 -68.51 -0.40 21.6% 2.3 18.7% 31.2% 19.8% 18.3% -3.7% 3.7% 7.16 2016 Q2 2016 451.86 29.11 77.39 412.89 452.62 138.65 -61.26 -0.40 22.1% 2.4 17.1% 30.2% 19.2% 17.7% -11.1% 4.0% 26.74 Mdn.: 21.5% 0% 10% 20% 30% 40% -100% 0% 100% 200% 2006 Q2 2008 Q2 2010 Q2 2012 Q2 2014 Q2 2016 Q2 Croic&Roic(%) YoyNopatGr. Croic, Roic & Yoy Nopat Growth YoY N.Gr. Roic 5 Perc. Media Mobile (YoY N.Gr.) 0% 5000% 0.00 100.00 2006 Q2 2008 Q2 2010 Q2 2012 Q2 2014 Q2 2016 Q2 Incr.RoicAvg.Cfo Gr. Incr. Cfo per Incr. CapexAvg.Cfo Gr. Incr.Roic
- 5. Ncav Analysis 12/2015 EQY FUND YEARBS015 BS010 BS011 RR005 BS050 BS047 CF026 IS052 BS081 RR250 SAM US EquityUSD Curr.Assets Cash Mkt.Instr. Tot.Liab. Curr.Liab. Sh.T.Brw. Dvd.Cash Dvd. Sh.Out. Hist.Mcap. DVD.P.Sh.NcavPSh.+DvdDisc_NcavYoY G. %Cash/C.A.Flow_R 2005 Q2 2005 2005 Q3 2005 2005 Q4 2005 2006 Q1 2006 2006 Q2 2006 100.91 45.12 20.00 37.34 33.04 13.9 407.54 4.6 6.4 neg. 44.7% 1.1 2006 Q3 2006 113.76 56.90 18.63 44.88 39.23 14.0 460.18 4.9 6.7 neg. 50.0% 1.0 2006 Q4 2006 120.56 63.15 19.22 45.89 40.87 13.9 507.31 5.4 6.8 neg. 52.4% 0.9 2007 Q1 2007 125.23 61.45 20.03 41.72 36.81 14.3 477.13 5.8 5.7 neg. 49.1% 1.2 2007 Q2 2007 139.81 72.04 20.75 49.04 44.23 14.3 564.03 6.3 6.2 38.6% 51.5% 1.1 2007 Q3 2007 135.81 71.58 19.43 49.45 44.75 14.4 699.63 6.0 8.1 22.2% 52.7% 1.0 2007 Q4 2007 137.89 79.29 16.20 64.37 60.16 14.2 534.43 5.2 7.3 -3.5% 57.5% 0.7 2008 Q1 2008 122.08 71.16 16.20 66.88 62.82 14.0 669.13 4.0 12.1 -32.3% 58.3% 0.6 2008 Q2 2008 78.80 19.39 16.20 74.31 70.34 14.0 561.40 0.3 125.3 -95.0% 24.6% 0.6 2008 Q3 2008 60.77 10.57 16.20 66.89 63.02 14.2 685.03 -0.4 Neg. neg. 17.4% 0.5 2008 Q4 2008 68.85 9.07 16.20 79.73 67.06 14.2 379.35 -0.8 Neg. neg. 13.2% 0.6 2009 Q1 2009 65.36 4.15 16.20 74.09 61.58 14.3 317.24 -0.6 Neg. neg. 6.3% 0.7 2009 Q2 2009 86.41 28.59 16.20 85.18 72.79 14.2 425.30 0.1 346.1 -72.9% 33.1% 0.6 2009 Q3 2009 101.99 44.80 16.20 86.26 73.98 14.3 532.87 1.1 33.9 pos. 43.9% 0.6 2009 Q4 2009 113.03 55.48 16.20 89.78 73.79 14.2 667.04 1.6 28.7 pos. 49.1% 0.6 2010 Q1 2010 106.49 38.66 16.20 86.14 68.88 14.1 732.64 1.4 36.0 pos. 36.3% 0.7 2010 Q2 2010 120.47 53.68 16.20 93.54 76.40 13.9 974.46 1.9 36.2 ###### 44.6% 0.7 2010 Q3 2010 119.77 53.19 16.20 99.21 81.25 13.6 930.15 1.5 45.2 37.0% 44.4% 0.6 2010 Q4 2010 112.00 48.97 16.20 92.94 72.20 13.4 1,311.54 1.4 68.8 -12.8% 43.7% 0.6 2011 Q1 2011 118.82 45.32 16.20 90.58 70.05 13.4 1,206.00 2.1 42.7 45.5% 38.1% 0.8 2011 Q2 2011 142.20 66.32 16.20 103.26 82.58 13.2 1,171.77 3.0 30.1 52.3% 46.6% 0.7 2011 Q3 2011 128.17 48.12 16.20 102.70 82.55 12.9 952.21 2.0 37.4 30.9% 37.5% 0.8 2011 Q4 2011 125.72 49.45 16.20 87.74 67.05 12.8 1,391.99 3.0 36.7 108.1% 39.3% 0.9 2012 Q1 2012 120.02 38.16 16.20 81.96 61.34 12.9 1,377.40 3.0 36.2 40.3% 31.8% 1.1 2012 Q2 2012 134.09 41.14 16.20 95.02 72.98 0.06 12.8 1,549.63 3.1 39.7 3.4% 30.7% 1.1 2012 Q3 2012 150.51 62.84 16.20 105.57 83.46 0.06 12.8 1,434.69 3.5 31.9 77.2% 41.7% 0.9 2012 Q4 2012 162.34 74.46 16.20 114.39 88.89 0.06 12.8 1,703.61 3.7 35.5 26.4% 45.9% 0.8 2013 Q1 2013 132.25 32.29 16.20 99.73 74.77 0.05 12.8 2,046.41 2.5 62.9 -14.0% 24.4% 1.1 2013 Q2 2013 139.00 24.87 16.20 123.23 98.03 0.05 12.7 2,173.23 1.2 137.8 -59.4% 17.9% 1.0 2013 Q3 2013 173.37 43.73 16.20 151.01 125.15 0.05 12.7 3,116.10 1.8 139.3 -49.9% 25.2% 0.9 2013 Q4 2013 164.28 49.52 16.20 141.99 104.38 0.05 12.7 3,086.22 1.7 138.5 -53.3% 30.1% 0.9 2014 Q1 2014 156.47 27.98 16.20 135.26 98.21 0.06 13.0 3,142.73 1.6 148.2 -35.5% 17.9% 1.1 2014 Q2 2014 174.42 31.28 16.20 162.14 124.82 0.06 13.0 2,882.86 0.9 234.7 -23.5% 17.9% 1.0 2014 Q3 2014 187.67 57.18 16.20 159.91 122.39 0.06 13.0 2,858.08 2.1 103.0 21.8% 30.5% 0.9 2014 Q4 2014 207.46 76.40 16.20 169.02 110.17 0.06 13.1 3,865.24 2.9 100.5 68.2% 36.8% 1.0 2015 Q1 2015 250.41 122.16 16.20 160.51 102.06 0.06 13.3 3,565.00 6.8 39.7 313.4% 48.8% 1.1 2015 Q2 2015 281.26 146.98 16.20 177.83 118.37 0.06 13.3 3,148.64 7.8 30.4 724.0% 52.3% 1.0 2015 Q3 2015 272.27 134.61 16.20 196.12 132.79 0.06 13.0 2,823.32 5.9 37.1 174.3% 49.4% 0.9 2015 Q4 2015 223.60 94.19 16.20 184.18 111.16 0.06 12.8 2,620.16 3.1 66.5 5.1% 42.1% 1.0 2016 Q1 2016 182.50 51.13 16.20 172.48 101.52 0.06 12.7 2,334.05 0.8 233.1 -88.3% 28.0% 1.1 2016 Q2 2016 168.32 27.58 16.20 178.34 111.14 0.06 12.4 1,949.35 -0.8 Neg. neg. 16.4% 1.1 Set Year 2016 26Q neg. Set Q/S Q2 22Q neg. Set Stock SAM US Equity 6Q neg. Set Crncy USD 1Q neg. Per 2016:Q2 -500% 0% 500% 1000% 1500% 2000% 2500% 0.0 100.0 200.0 300.0 400.0 2009 Q1 2011 Q1 2013 Q1 2015 Q1 Ncav Gr.(YoY)P/Ncav Disc_Ncav YoY G.
- 6. Long Term Tangible Growth 12/2015 EQY FUND YEARBS138 BS161 RR250 RR010 CF026 IS052 BS081 Calc.: IS180 Calc.: Calc.: SAM US EquityUSD Discl.Int. Goodw. Hist.Market C. Nav (Tce) Dvd.Cash Dvd. Sh.Out. DVD.P.Sh.Int/Nav Tbv/Sh.(2)P/TB T.B.Gr.(YoY)Dvd.C Expected Rate Of Return On Plan Assets (PensionO(U)_Pens Min.Op.L 1987 1988 1989 1990 1991 1992 1993 8.85 1994 6.60 31/12/95 1995 469.09 54.80 19.8 2.8 8.6 31/12/96 1996 205.62 64.83 20.1 3.2 3.2 16.4% 27/12/97 1997 165.66 71.28 20.4 3.5 2.3 8.0% 26/12/98 1998 168.02 82.03 20.5 4.0 2.0 14.8% 25/12/99 1999 131.48 83.45 19.2 4.3 1.6 8.6% -3.06 30/12/00 2000 1.48 1.48 181.24 73.69 16.7 2.0% 4.3 2.5 -0.2% -6.39 29/12/01 2001 1.38 1.38 285.82 78.18 16.3 1.8% 4.7 3.7 8.6% 7.8 -5.67 28/12/02 2002 1.38 1.38 229.77 78.83 15.8 1.7% 4.9 3.0 4.4% 7.8 -0.14 -4.57 27/12/03 2003 1.38 1.38 260.03 62.52 16.9 2.2% 3.6 4.3 -26.5% 7.8 -0.17 -3.60 25/12/04 2004 1.38 1.38 300.25 78.37 14.2 1.8% 5.4 3.9 50.3% 7.8 -0.24 -2.45 31/12/05 2005 1.38 1.38 348.05 85.98 13.9 1.6% 6.1 4.1 12.0% 7.0 -0.27 -1.35 30/12/06 2006 1.38 1.38 507.31 108.59 13.9 1.3% 7.7 4.7 26.7% 7.0 -0.52 -7.13 29/12/07 2007 1.38 1.38 534.43 133.59 14.2 1.0% 9.3 4.0 20.9% 7.0 -0.41 -6.99 27/12/08 2008 1.38 1.38 379.35 140.03 14.2 1.0% 9.8 2.7 5.1% -0.92 -7.52 26/12/09 2009 1.38 1.38 667.04 173.16 14.2 0.8% 12.1 3.9 23.2% -0.89 -6.68 25/12/10 2010 1.38 1.38 1,311.54 165.59 13.4 0.8% 12.3 8.0 1.7% -1.10 -5.75 31/12/11 2011 1.38 1.38 1,391.99 184.75 12.8 0.7% 14.3 7.6 16.7% -1.37 -5.27 29/12/12 2012 2.54 2.54 1,703.61 245.09 12.8 1.0% 18.9 7.0 32.4% -1.62 -9.35 28/12/13 2013 3.68 3.68 3,086.22 302.09 12.7 1.2% 23.4 10.3 23.6% -1.17 -9.40 27/12/14 2014 3.68 3.68 3,865.24 436.14 13.1 0.8% 33.1 8.9 41.4% -2.41 -7.26 26/12/15 2015 3.68 3.68 1,949.35 412.23 12.4 0.9% 33.0 4.8 -0.2% -2.31 -17.52 Years C.a.g.r 20 13.18% 15 Y 14.5% 10 Y 18.4% 5 Y 21.9% 0.0% 2.0% 4.0% 2.7% 2.5% 3.1% 2.4% 1.6% 3.1% Off Bal.Sheet Items/Tot.Assets 0 5 10 15 -50% 0% 50% 100% 1995 1998 2001 2004 2007 2010 2013 p/tang.b.valuepershare Tang.BookV.perSh.Gr. (%) Historical p/tb & tb value per share growth tbvgr ptb
- 7. Ratio Analysis 12/2015 EQY FUND YEARRR029 RR028 RR002 RR037 Calc.: A0082 A0098 Calc.: RR243 RR057 RR900 RR138 RR242 BS032 RR056 RR801 A0003 SAM US EquityUSD ROE ROA EBIT Tax R. Eb.(1-t) cp_ltd ltd Roic Pr.Marg.Gr.Marg.P/E A.Turn.F.A.Turn.PP&E(n) Inv.Turn.Cost of R. Cost of G.S. 1987 Y 1987 1988 Y 1988 1989 Y 1989 1990 Y 1990 1991 Y 1991 1992 Y 1992 1993 Y 1993 4.90 4.90 6.3 54.0 1.86 35.48 1994 Y 1994 117.6 32.5 8.89 8.89 7.9 54.0 4.1 42.5 3.54 9.2 52.85 1995 Y 1995 19.2 10.9 9.42 43.2 5.35 3.9 51.2 2.8 31.2 6.16 8.7 73.85 1996 Y 1996 14.0 9.7 13.16 43.6 7.42 4.4 49.9 25.0 2.2 18.4 14.63 8.6 95.79 1997 Y 1997 11.1 7.5 12.59 43.1 7.16 10.00 4.1 51.0 22.0 1.8 8.5 28.78 6.7 90.00 90.0 1998 Y 1998 10.3 6.9 14.60 44.8 8.06 10.00 4.3 51.3 18.6 1.6 6.4 28.17 6.1 89.39 89.4 1999 Y 1999 13.4 9.4 16.88 42.0 9.79 6.3 55.7 13.1 1.5 6.5 26.09 5.0 78.40 78.4 2000 Y 2000 14.3 10.6 16.12 41.0 9.51 5.9 55.9 14.2 1.8 7.2 27.05 5.4 84.06 84.1 2001 Y 2001 10.3 7.6 11.48 40.7 6.81 4.2 56.3 28.2 1.8 7.3 23.90 6.5 81.69 81.7 2002 Y 2002 10.9 8.0 11.67 39.3 7.08 4.0 59.0 31.5 2.0 9.8 20.20 10.0 88.37 88.4 2003 Y 2003 14.9 10.9 15.87 37.8 9.87 5.1 58.8 26.6 2.1 11.2 17.06 9.4 85.61 85.6 2004 Y 2004 17.7 12.8 19.49 37.7 12.13 5.8 59.5 24.6 2.2 12.7 17.22 7.8 87.97 88.0 2005 Y 2005 18.9 13.7 23.32 39.0 14.22 6.5 59.4 23.4 2.1 10.9 26.53 7.4 96.83 96.8 2006 Y 2006 18.7 13.3 27.95 42.7 16.01 6.4 57.6 28.3 2.1 10.0 30.70 7.9 121.16 121.2 2007 Y 2007 18.6 12.8 40.33 46.0 21.78 6.6 55.4 19.3 1.9 8.9 46.20 8.7 152.29 152.3 2008 Y 2008 5.9 3.9 16.00 48.9 8.17 2.0 46.2 24.8 1.9 4.1 147.92 10.5 214.51 214.5 2009 Y 2009 19.9 12.9 54.27 42.8 31.06 7.5 51.5 21.1 1.7 2.8 147.02 8.3 201.24 201.2 2010 Y 2010 29.6 19.2 81.18 38.2 50.19 10.8 55.3 27.7 1.8 3.2 142.89 8.0 207.47 207.5 2011 Y 2011 37.7 24.9 103.66 36.2 66.16 12.9 55.5 28.0 1.9 3.6 143.59 7.5 228.43 228.4 2012 Y 2012 27.7 18.8 95.58 37.7 59.51 10.2 54.3 30.0 1.8 3.5 189.95 6.8 265.01 265.0 2013 Y 2013 25.7 17.5 113.09 37.5 70.74 9.5 52.1 45.8 1.8 3.2 266.56 7.0 354.13 354.1 2014 Y 2014 24.6 17.3 146.57 37.7 91.35 0.06 0.53 10.0 51.5 43.4 1.7 2.8 381.57 8.1 438.00 438.0 2015 Y 2015 21.9 15.7 156.17 36.5 99.15 0.06 0.47 10.3 52.3 28.2 1.5 2.4 409.93 8.5 458.32 458.3