Download to read offline


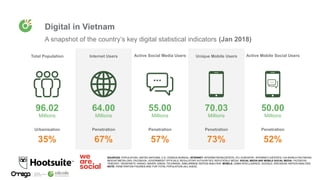
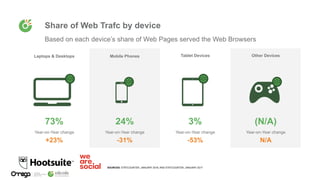
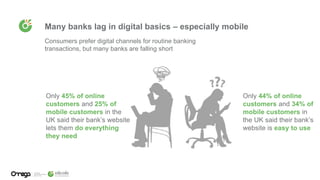
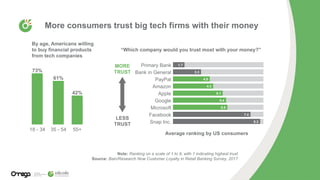
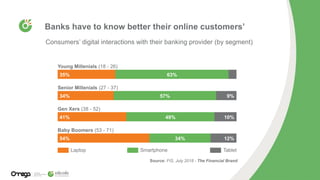
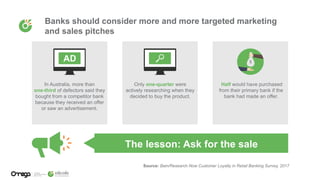

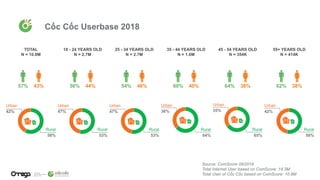
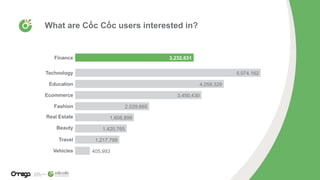
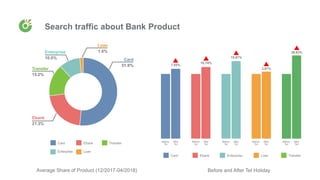
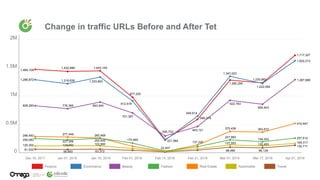
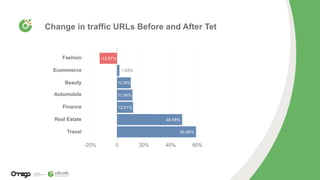
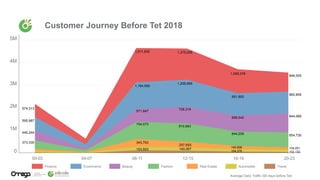
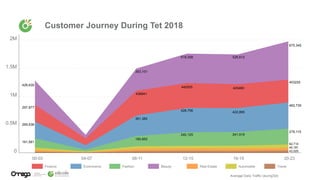
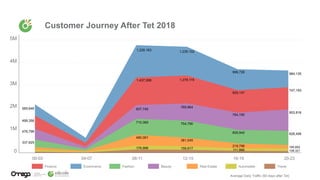
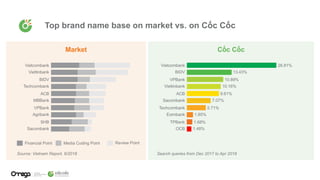

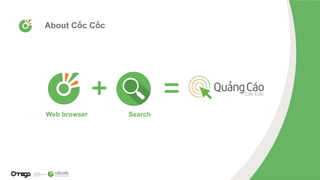


This document discusses understanding customer behavior in the finance industry. It provides an overview of trends in digital disruption in the banking industry, including how banks are lagging in digital offerings and facing competition from new players like tech companies. It also examines customer behavior on an online marketplace in Vietnam, showing data on user demographics and interests. Traffic related to bank products increased around holidays. The document concludes with details about the online marketplace, including ad formats, targeting options, and measures taken to ensure brand safety and viewability.


