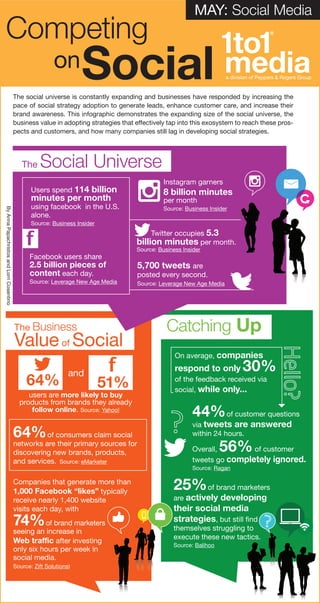
The Business
Valueof Social
Catching Up
The social universe is constantly expanding and businesses have responded by increasing the
pace of social strategy adoption to generate leads, enhance customer care, and increase their
brand awareness. This infographic demonstrates the expanding size of the social universe, the
business value in adopting strategies that effectively tap into this ecosystem to reach these pros-
pects and customers, and how many companies still lag in developing social strategies.
Users spend 114 billion
minutes per month
using facebook in the U.S.
alone.
Source: Business Insider
Facebook users share
2.5 billion pieces of
content each day.
Source: Leverage New Age Media
Instagram garners
8 billion minutes
per month
Source: Business Insider
Companies that generate more than
1,000 Facebook “likes” typically
receive nearly 1,400 website
visits each day, with
74%of brand marketers
seeing an increase in
Web traffic after investing
only six hours per week in
social media.
Source: Zift Solutions)
5,700 tweets are
posted every second.
Source: Leverage New Age Media
Twitter occupies 5.3
billion minutes per month.
Source: Business Insider
and
users are more likely to buy
products from brands they already
follow online. Source: Yahoo!
f
51%64%
64%of consumers claim social
networks are their primary sources for
discovering new brands, products,
and services. Source: eMarketer
44%of customer questions
via tweets are answered
within 24 hours.
Overall, 56%of customer
tweets go completely ignored.
Source: Ragan
25%of brand marketers
are actively developing
their social media
strategies, but still find
themselves struggling to
execute these new tactics.
Source: Balihoo
f
The Social Universe
MAY: Social Media
On average, companies
respond to only 30%
of the feedback received via
social, while only...
ByAnnaPapachristosandLorriCosentino

Infographic: Competing on Social

  • 1.
    The Business Valueof Social CatchingUp The social universe is constantly expanding and businesses have responded by increasing the pace of social strategy adoption to generate leads, enhance customer care, and increase their brand awareness. This infographic demonstrates the expanding size of the social universe, the business value in adopting strategies that effectively tap into this ecosystem to reach these pros- pects and customers, and how many companies still lag in developing social strategies. Users spend 114 billion minutes per month using facebook in the U.S. alone. Source: Business Insider Facebook users share 2.5 billion pieces of content each day. Source: Leverage New Age Media Instagram garners 8 billion minutes per month Source: Business Insider Companies that generate more than 1,000 Facebook “likes” typically receive nearly 1,400 website visits each day, with 74%of brand marketers seeing an increase in Web traffic after investing only six hours per week in social media. Source: Zift Solutions) 5,700 tweets are posted every second. Source: Leverage New Age Media Twitter occupies 5.3 billion minutes per month. Source: Business Insider and users are more likely to buy products from brands they already follow online. Source: Yahoo! f 51%64% 64%of consumers claim social networks are their primary sources for discovering new brands, products, and services. Source: eMarketer 44%of customer questions via tweets are answered within 24 hours. Overall, 56%of customer tweets go completely ignored. Source: Ragan 25%of brand marketers are actively developing their social media strategies, but still find themselves struggling to execute these new tactics. Source: Balihoo f The Social Universe MAY: Social Media On average, companies respond to only 30% of the feedback received via social, while only... ByAnnaPapachristosandLorriCosentino