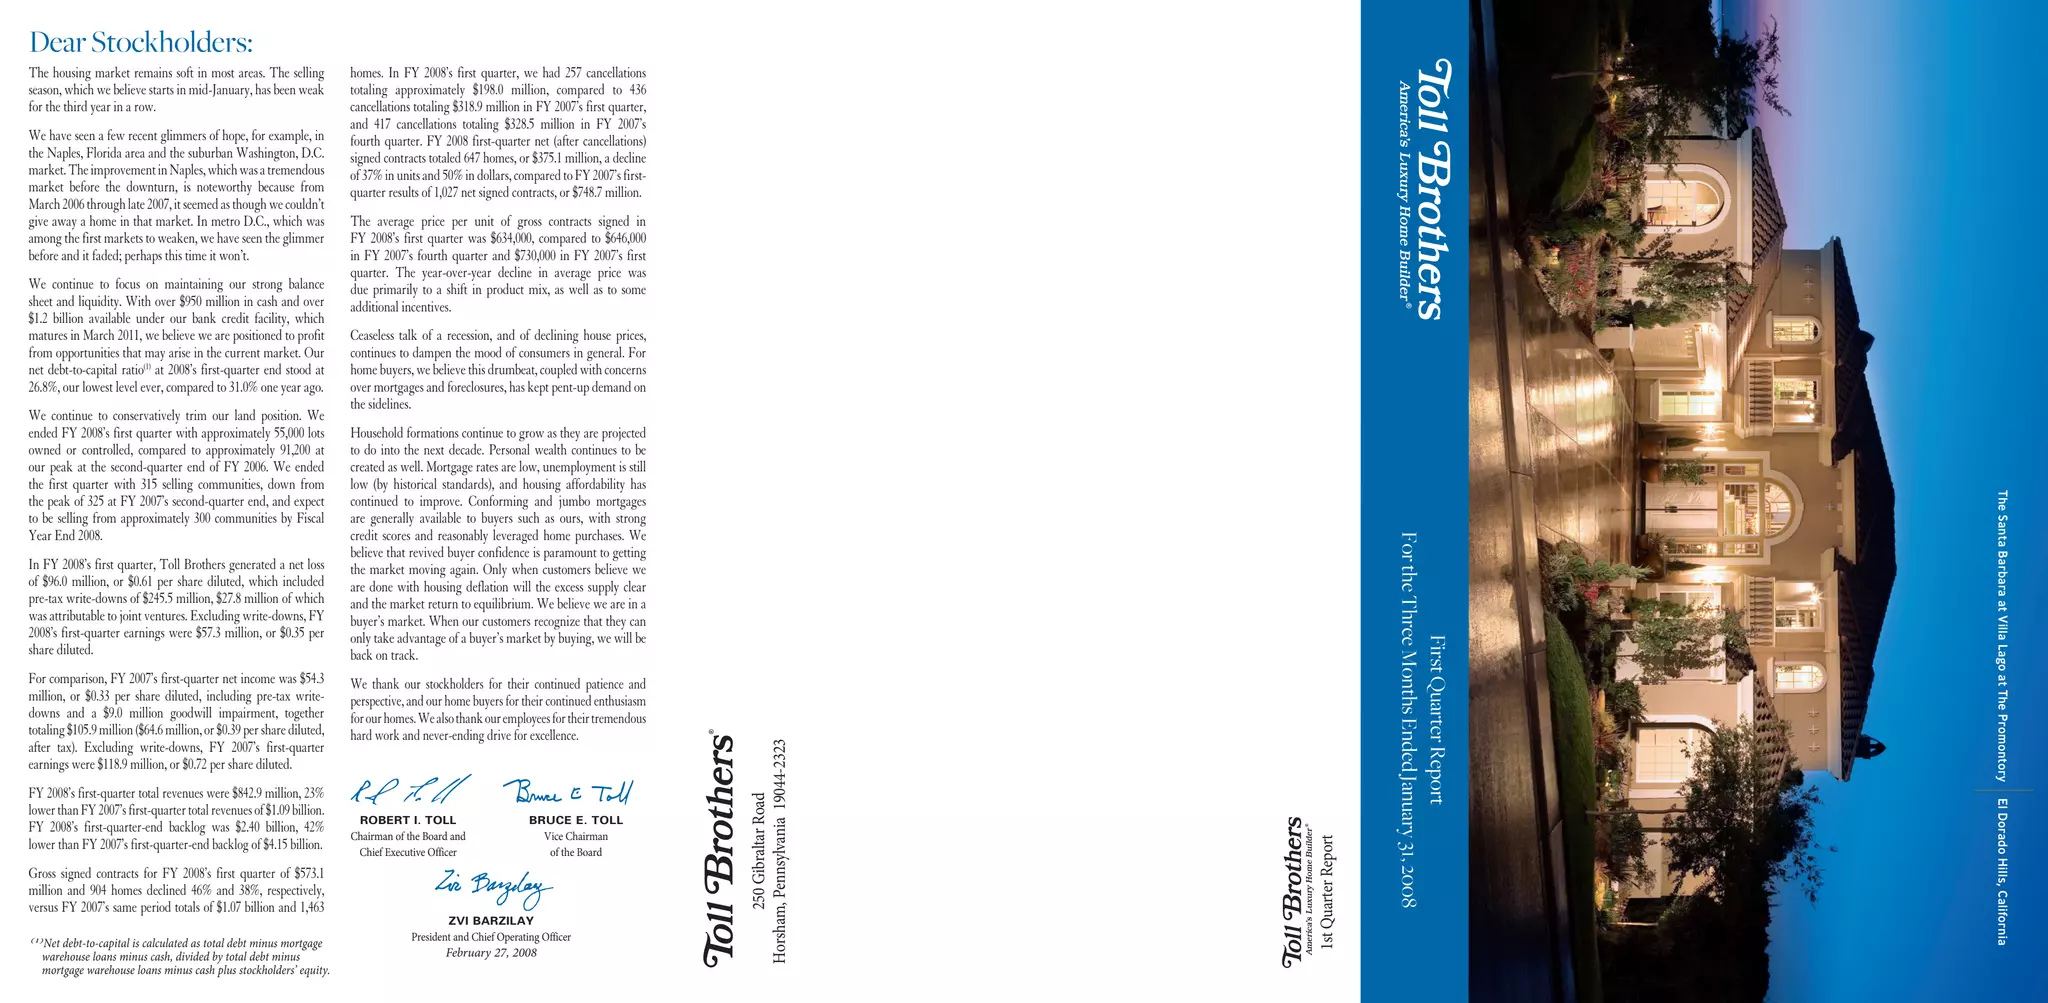
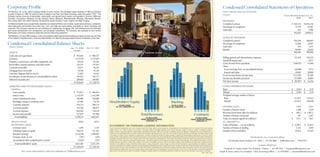
This document is a letter to stockholders from Toll Brothers, a luxury home builder, addressing the company's performance in the first quarter of fiscal year 2008. It summarizes that housing market conditions remained weak with declining sales. The company reported a net loss for the quarter due to write-downs, though earnings excluding write-downs were positive. Backlog and gross contracts signed declined significantly year-over-year as the company continued adjusting to soft market conditions.
BB&T reported 2008 net income of $1.5 billion and earnings per common share of $2.71. For the fourth quarter of 2008, net income totaled $305 million and net income available to common shareholders totaled $284 million, or $.51 per diluted common share. For the full year 2008, BB&T's net income available to common shareholders was $1.50 billion compared to $1.73 billion earned in 2007, a decrease of 13.6%.
U.S. Bancorp reported net income of $950 million for Q2 2008, down 17.8% from Q2 2007. Diluted earnings per share were $0.53, down 18.5% from the prior year. The decline was due to higher credit costs as the provision for credit losses increased $405 million over Q2 2007. Net interest income rose 15.6% to $1.908 billion from strong earning asset growth and an improved net interest margin. However, revenue growth was offset by a larger provision given stress in the housing and commercial real estate markets and the economic slowdown.
U.S. Bancorp reported net income of $1,130 million for the first quarter of 2007, down slightly from $1,153 million in the first quarter of 2006. Diluted earnings per share were $0.63, equal to the prior year. The net interest margin declined to 3.51% from 3.80% a year ago due to competitive pressures and changes in the yield curve. Noninterest income grew 5.1% driven by fee businesses, but this growth was offset by increased credit costs and the impact of items in the year-ago period. Overall results were solid given the challenging environment, and credit quality remained strong.
May/June 2010 Edition: Toronto Real Estate Market ViewsMagda Mo
The real estate market in the GTA saw record high home sales and new listings in April 2010. Sales volume increased 34% and new listings increased 59% compared to April 2009. The average home price also set a new record at $437,600, up 13% from April 2009. While prices and demand were up significantly, the increase in new listings helped restore some balance to the market. However, days on the market remained very low at just 21 days.
U.S. Bancorp reported net income of $1,090 million for Q1 2008, down slightly from $1,130 million in Q1 2007. Earnings per share were $0.62, down 1.6% from the prior year. The results were impacted by a $492 million gain from the Visa IPO, $253 million in impairment charges, and $192 million in increased credit loss provisions. Net interest income was up 9.8% to $1,830 million due to loan and securities growth and a higher net interest margin of 3.55%. Noninterest income rose 18.6% to $2,044 million, reflecting organic fee income growth of 7.3% and
American Express Company is a global provider of travel, financial, and network services. It was founded in 1850 and offers charge and credit cards, traveler's checks, financial planning, brokerage services, insurance, and investment products. As the world's largest travel agency, it offers travel services to individuals and corporations globally. It also provides banking services outside the US. In 1998, American Express continued growing its network services by adding new bank partners, expanded its financial services presence, and grew its international operations despite economic difficulties in some markets.
Restructuring Completed At American Capital And European Capital June 28 2010Monster12
The document summarizes a debt restructuring completed by American Capital and European Capital in June 2010. It involved paying down $1 billion in cash, and issuing $1.3 billion in new secured debt maturing in December 2013. The restructuring reduced total debt from $4.026 billion to $2.996 billion, and increased shareholders' equity from $2.526 billion to $2.814 billion. This improved the debt to equity ratio from 1.6x to 1.1x. The new debt structure provides flexibility to make new investments with proceeds from asset sales and capital raisings.
Puerto rico's fiscal and economic turnaroundgobiernoprfaa
Governor Fortuño outlines Puerto Rico's fiscal and economic turnaround from 2009-2011. Key accomplishments include reducing the deficit by 81% through spending cuts, improving the credit rating, reforming the tax code, reducing unemployment, and increasing home and tourism sales. Economic indicators now point to positive growth, including a 28,000 job increase in 2011. The tax reform is generating increased government revenues despite lower tax collections, showing early success.
We sold our power generation subsidiary, Texas Genco, for $3.65 billion and received approval from the Public Utility Commission of Texas to recover a portion of our stranded costs. This allowed us to significantly reduce our debt and interest costs. Our core electric, gas, and pipeline businesses also reported higher operating incomes in 2004 from growth in customers and improved operational efficiencies. We are committed to providing shareholders a well-managed company focused on paying dividends and increasing shareholder value.
The document provides financial results for 3Q09. Key highlights include:
- Net income of $3.6 billion and EPS of $0.82, with strong earnings in the Investment Bank.
- Credit costs remain high at $9.8 billion as consumer credit reserves were added.
- Capital levels were further strengthened with Tier 1 Common ratio of 8.2% and Tier 1 Capital ratio of 10.2%.
1) GE is operating in a very challenging global economic environment characterized by recession, high unemployment, declining home prices and negative GDP growth.
2) The financial crisis has resulted in huge losses across the banking system and a fundamental reset of the financial services landscape. Capital markets are also not functioning normally.
3) GE Capital is facing earnings pressure due to the economic downturn, but GE expects it to remain profitable in 2009. GE cut its dividend in 2009 in light of the deteriorating environment and loss expectations.
- JPMorgan Chase reported net income of $2.1 billion for Q1 2009, driven by record revenue in the investment bank but higher credit costs.
- The investment bank had its best quarter ever with net income of $1.6 billion on record revenue of $8.3 billion from strong fixed income and equity trading. However, markdowns on leveraged loans totaled $711 million.
- Retail banking profits grew 58% to $863 million due to higher deposits and fees from the Washington Mutual acquisition, while consumer lending lost $389 million due to increased loan losses.
Black & Decker reported second quarter 2007 earnings of $1.75 per share, meeting expectations. Sales were flat at $1.7 billion compared to the previous year. Free cash flow for the first half of 2007 was $300 million, an increase of $120 million over the prior year. The company expects challenges in the US housing market and commodity inflation to continue impacting earnings comparisons and forecasts third quarter EPS of $1.40-$1.45.
Embraer delivered 35 commercial and 20 executive aircraft in Q2 2012. Revenues for the first half of 2012 totaled $2.87 billion. EBIT and EBITDA margins for Q2 2012 were 11.5% and 15.4% respectively. Net income was $54.3 million for Q2 2012, impacted by unrealized foreign exchange losses. Cash flow from operations was positive, but free cash flow for the first half was negative $149.2 million due to capital expenditures and inventory levels.
5
J.P. Morgan Chase & Co. reported second quarter 2009 net income of $2.7 billion, up 36% from the prior year. Revenue was a record $27.7 billion. The Investment Bank reported record revenue for the first half of 2009, including record fees and fixed income markets revenue. Retail Financial Services saw higher revenue due to the Washington Mutual acquisition, but a higher provision for credit losses led to a net loss. JPMorgan maintained a strong capital position with Tier 1 capital of $122.2 billion after repaying $25 billion in TARP funds.
U.S. Bancorp reported net income of $942 million for Q4 2007, down from $1,194 million in Q4 2006. Earnings per share were $.53 compared to $.66 in Q4 2006. Results were impacted by $215 million in charges related to Visa litigation and $107 million in losses from money market securities. Excluding these charges, earnings were comparable to Q3 2007. Loan and deposit growth was strong, driven by fee businesses. Credit quality remained sound with manageable expected increases in charge-offs and nonperforming assets. The company remains well-capitalized and increased its dividend.
The document provides an overview of Macquarie Infrastructure Company's fourth quarter and full year 2011 earnings conference call. It discusses positive cash generation trends, with proportionately combined free cash flow of $145.1 million for 2011. Segment performance is reviewed for IMTT, The Gas Company, District Energy, and Atlantic Aviation. Guidance is also provided for expected 2012 performance at each business. Debt profiles and compliance with debt covenants are summarized.
JPMorgan Chase First Quarter 2008 Financial Results Conference Call finance2
1) JPMorgan Chase reported earnings of $2.4 billion on revenue of $17.9 billion for 1Q08, down 49% from record earnings in 1Q07. EPS was $0.68.
2) The Investment Bank took markdowns of $2.6 billion related to subprime, Alt-A, prime mortgages, and leveraged lending commitments. It reported a net loss of $87 million on revenue of $3 billion, down 52% year-over-year.
3) The firm increased its credit reserves by $2.5 billion, including $1.1 billion related to the home equity portfolio. It transferred $4.9 billion of lever
This document is the annual report from Marshall & Ilsley Corporation (M&I) for the year 2003. It discusses M&I's financial highlights for 2003 including record net income of $544 million, a 10.2% increase in earnings per share from 2002. It outlines M&I's successes across its business lines, continued expansion into new markets, and strategic focus on becoming a national financial services provider beyond its traditional Midwest footprint. The report is signed by James B. Wigdale, Chairman of M&I, and Dennis J. Kuester, President and CEO, who thank employees and leadership for helping achieve strong results in 2003.
Mercator Lines (Singapore) Ltd. reported financial results for the second quarter of FY 2013, with revenue of USD 35.5 million compared to USD 35.1 million in the prior year period. However, net loss was USD 0.3 million compared to a net profit of USD 1.7 million previously. The company has a young fleet of geared Panamax vessels and focuses on transporting commodities like coal and iron ore between countries like India, Indonesia, China, Brazil and Australia. It aims to provide customized logistics solutions and leverage relationships with major customers like Tata Power and Arcelor Mittal to hedge against volatility in the dry bulk market.
This document provides quarterly financial data for Citigroup, including:
1) Income statements for Citigroup's major business segments broken down by product and region, showing revenues, expenses, profits.
2) Key metrics for Citigroup as a whole, including revenues, income, earnings per share, assets, equity.
3) Specific data on performance of Citigroup's Global Consumer credit card business, including revenues, expenses, profits, and effects of securitization activities.
Embraer released its second quarter 2011 results. Revenues reached $1.358 billion and gross margin grew to 22.4%. EBIT was $105.6 million
and the EBIT margin was 7.8%, in line with guidance. Net income was $96.4 million compared to $57.4 million in the prior year. Embraer delivered
25 commercial and 23 executive jets. The company revised its 2011 revenue guidance upward to $5.8 billion from $5.6 billion and revised other
guidance metrics accordingly.
Xcel Energy had a difficult 2002 due to challenges faced by the entire energy industry and issues specific to NRG Energy, its subsidiary. Core utility operations performed well but earnings were reduced by market conditions and an $3.5 billion loss from NRG. Looking forward, Xcel Energy will focus on its strong core utility businesses and improving its financial position by resolving the NRG restructuring and pursuing top performance.
John Hopper, Vice President and Treasurer of Merrill Lynch, presented at the Leveraged Finance Conference on November 14, 2006. The presentation focused on El Paso Corporation's strong financial results in the third quarter of 2006, significant progress on legacy issues, continued debt reduction, growth in the pipeline business, drilling success in exploration and production, and risk management strategies. El Paso aims to provide natural gas and related energy products in a safe, efficient, and dependable manner.
United Stationers Inc. reported a reconciliation of non-GAAP financial measures for debt to total capitalization as of June 30, 2005 and 2004. Total debt and securitization, considered adjusted debt, increased from $154 million to $235.3 million from 2004 to 2005 primarily due to a $91 million increase in accounts receivable sold. Adjusted debt as a percentage of total capitalization increased from 18.2% to 23.1% over this period.
Toll Brothers had a record first quarter in fiscal year 2000, with earnings of $22.4 million, up 28% from the previous year. Revenues were $344.6 million, a 26% increase, driven by delivering 799 homes generating $334.2 million in revenues. New contracts signed were $391.6 million, up 27% from the previous year, and backlog reached a record high of $1.122 billion, up 31% from the previous year. Toll Brothers attributes the strong results to favorable demographics of move-up buyers and empty nesters, price increases implemented in 1999, and strategic expansion into new markets and product lines such as active adult communities.
This document provides a reconciliation of selected United Stationers Inc. financial statement accounts excluding the impact of the ORS Nasco acquisition in December 2007. It shows accounts receivable, inventories, and accounts payable as of September 30, 2008 and 2007, adjusted to exclude the balances from ORS Nasco. The changes in accounts receivable and inventories excluding ORS Nasco increased 5.5% and 10.0% respectively from the prior year, while accounts payable remained relatively flat, changing -0.2%.
United Stationers Inc. provided a reconciliation of selected financial statement accounts excluding the impact of its acquisition of ORS Nasco in December 2007. For the six months and three months ended June 30, 2008, net sales increased 7.3% and 9.7% respectively compared to the same periods in 2007 when excluding ORS Nasco. As of June 30, 2008, accounts receivable increased 3.1%, inventories decreased 3.2%, and accounts payable increased 13.5% compared to June 30, 2007 when excluding the impact of ORS Nasco. This reconciliation was provided to allow for a comparison of United Stationers' financial position and operating results to the prior year.
United Stationers Inc. provided a reconciliation of its non-GAAP financial measure of total accounts receivable, which combines accounts receivable on its balance sheet ($321.3 million in 2007) with its retained interest in accounts receivable sold under a securitization program ($94.8 million in 2007) and the amount of accounts receivable actually sold under the program ($248 million in 2007), for a total of $664.1 million in accounts receivable for 2007. The company disclosed this total amount as it believes it provides a more meaningful measure of the accounts receivable used in its operations than the net amount shown on its balance sheet alone.
United Stationers Inc. reported net income of $23.4 million for the first quarter of 2004, up from $12.7 million in the same period of 2003. Excluding one-time charges, net income would have been $23.4 million in 2004 and $19.3 million in 2003. Diluted earnings per share were $0.68 in 2004 and $0.39 in 2003, or $0.68 and $0.59 respectively excluding the one-time charges. These non-GAAP measures are provided for comparative purposes in addition to the GAAP reporting.
United Stationers Inc. provides a reconciliation of non-GAAP financial measures, specifically debt to total capitalization. They calculate adjusted debt, which includes long-term debt plus accounts receivable sold, rather than treating accounts receivable sold as a reduction to accounts receivable. This provides an additional liquidity measure by considering accounts receivable sold as a financing mechanism. Comparing 2005 to 2004, adjusted debt increased by $63 million while total capitalization increased by $121.5 million, resulting in an increase in the adjusted debt to total capitalization ratio from 14.5% to 19.3%.
- FY 2007 first quarter net income was $54.3 million, down 66% from $163.9 million in FY 2006 due to write-downs and impairments totaling $105.9 million. Excluding write-downs, earnings were down 27%. Revenues were down 19% to $1.09 billion.
- Housing market demand varied greatly between markets. Some areas like New York City remained strong while others like Chicago and parts of Florida had not yet stabilized. The cancellation rate was lower than last quarter but still above historical averages.
- The company had $4.15 billion in backlog, down 30% from last year, and 67,500 lots under control, down 26%
Toll Brothers had its most successful third quarter ever. Net income rose 103% to $215.5 million, revenues rose 54% to $1.56 billion, and contracts set a new third quarter record rising 19% to $1.92 billion. The company entered new markets in Orlando and Minneapolis-St. Paul and issued $300 million in senior debt to retire more expensive debt. Toll Brothers believes demand will continue to grow due to wealth accumulation and constrained land supply. The company expects revenues to grow to $6.78-7.05 billion in fiscal year 2006 with net income growth of approximately 20% over fiscal year 2005.
This document is the transcript of Realogy Corporation's second quarter 2008 earnings conference call from August 14, 2008. In the call, Realogy executives discussed the company's financial results for Q2 2008, including $1.4 billion in revenue, $161 million in EBITDA, and a net loss of $27 million. They also provided an overview of the challenging housing market and economy, and commented on various real estate market trends and indicators. Realogy's CEO emphasized the company's focus on productivity, costs, and strategic growth initiatives to position it for future success when the market recovers.
This document is a transcript of Realogy Corporation's third quarter 2008 earnings call from November 7, 2008. In the call, Realogy's President and CEO Richard Smith discusses the company's performance in light of the difficult housing market and economic conditions. He notes that home sales and prices declined year-over-year for Realogy, in line with industry trends, but that Realogy has strengths like its scale and brands that provide advantages over competitors during the downturn. Smith also highlights growth areas such as the launch of the new Better Homes and Gardens Real Estate franchise brand.
The document is a transcript of Realogy Corporation's third quarter 2008 earnings call from November 7, 2008. In the call, Realogy's President and CEO Richard Smith discusses:
- The difficult housing market conditions and weak economy negatively impacting Realogy's performance.
- Realogy's competitive strengths that provide advantages during the downturn, including its scale, cost efficiencies, and countercyclical businesses.
- Highlights of Realogy's third quarter performance, including declines in home sales and prices at RFG and NRT in line with industry trends.
- Updates on the expansion of Realogy's franchise brands and performance of its various business units.
The passage discusses the benefits of exercise for both physical and mental health. It notes that regular exercise can reduce the risk of diseases like heart disease and diabetes, and help manage weight. Exercise is also praised for improving mood and reducing stress and anxiety by releasing endorphins that make us feel happier.
- Columbia Banking System reported net income of $419,000 for Q1 2009, down significantly from $11.0 million in Q1 2008, due to a higher provision for loan losses from economic deterioration.
- Non-performing assets increased to $121.7 million from $15.0 million in Q1 2008, primarily in residential construction and commercial real estate loans.
- The company remains well-capitalized and focused on expense control while navigating challenging economic conditions.
Merrill Lynch reported a net loss of $1.97 billion for Q1 2008 compared to net earnings of $2.03 billion in Q1 2007. Revenues fell 69% to $2.9 billion due to write-downs related to US ABS CDOs and credit valuation adjustments on hedges with financial guarantors. However, Global Wealth Management saw record quarterly revenues with strong fee income and $9 billion in annuity inflows. While investment banking revenues fell 40% due to lower deal volumes, the business pipeline was only down 5% overall from year-end levels.
Ameriprise Financial reported second quarter 2008 results, with net income increasing 7% year-over-year to $210 million. Earnings per share increased 15% to $0.93. Excluding realized losses and prior year separation costs, earnings per share increased 3% to $1.01. Total revenues declined 8% to $2.0 billion due to market depreciation. The company maintained a strong capital position and increased its quarterly dividend by 13%.
Merrill Lynch reported a net loss of $1.97 billion for Q1 2008 compared to net earnings of $2.03 billion in Q1 2007. Net revenues were $2.9 billion, down 69% due to write-downs related to ABS CDOs and credit valuation adjustments on hedges with financial guarantors. Global Wealth Management achieved record quarterly net revenues of $3.6 billion, up 8% year-over-year, driven by strong fee growth. Merrill Lynch intends to reduce headcount by 4,000 employees to lower costs by $800 million annually. The firm remains well capitalized with $82 billion in excess liquidity.
Sovereign Bancorp Inc. announced its second quarter 2008 results, reporting net income of $127.4 million compared to $100.1 million in Q1 2008 and $147.5 million in Q2 2007. Key highlights included expanding its net interest margin to 3.06%, increasing its allowance for credit losses, and strengthening its capital ratios through a common stock offering. While asset quality deteriorated, with non-performing loans rising, the company stated it was on solid financial footing to manage through the uncertain economic environment.
- Ball Corporation reported its fourth quarter and full-year 2008 earnings. On a comparable basis, diluted EPS was $3.61 for 2008, up from $3.50 in 2007.
- Several business segments performed well despite the economic downturn, including aerospace and food and household products. However, beverage cans and plastics saw lower volumes and earnings.
- Looking ahead, Ball expects to reduce costs through plant closures and initiatives. However, challenges remain due to the uncertain economic environment.
Kellogg reported strong financial results for Q4 2007 and full year 2007. Net sales grew 8% for the year due to price increases and volume growth. Operating profit rose 6% despite high inflation. EPS grew 10% to $2.76 for the year through strong performance, lower tax rate, and share repurchases. For 2008, Kellogg expects mid-single digit sales and profit growth and high single digit EPS growth of $2.92 to $2.97 despite significant cost inflation, as they continue investing in the business.
- Cascade Financial reported a net loss of $4.8 million for Q1 2009 compared to earnings of $2.6 million in Q1 2008, due to increasing its provision for loan losses to $13.9 million.
- Checking deposits grew 83% year-over-year to a record level, while total loans increased 8% to $1.25 billion despite a slowdown in new loan originations.
- Nonperforming loans rose to represent 4.05% of total loans as the weak housing market continued to present challenges, leading to a higher allowance for loan losses.
- The company remained well capitalized with strong capital ratios, while continuing to focus on residential and small business lending to
5
J.P. Morgan Chase & Co. reported second quarter 2009 net income of $2.7 billion, up 36% from the prior year. Revenue was a record $27.7 billion. The Investment Bank reported record revenue for the first half of 2009, including record fees and fixed income markets revenue. Retail Financial Services earnings were reduced by high credit costs, though revenue increased 56% due to the Washington Mutual acquisition. JPMorgan maintained a strong capital position with Tier 1 capital of $122.2 billion.
This document is Toll Brothers' second quarter report for fiscal year 2007. It reports a decline in net income and revenues compared to the second quarter of fiscal year 2006. Net income was $36.7 million compared to $174.9 million the previous year. Revenues also declined. The company signed fewer contracts and saw higher cancellation rates than the previous year. However, the company remains well capitalized with over $550 million in cash and available credit. Market conditions remain difficult overall but some regions like New York City are stronger. The company believes the long term value of its land holdings will be realized in the future.
Marriott International Reports Second Quarter Resultsfinance20
Marriott International reported second quarter 2008 results. Worldwide revenue per available room (REVPAR) rose 5.6% driven by strong international growth. North American REVPAR increased 1.4%. Net income was $153 million compared to $175 million last year. Marriott added over 9,000 rooms in the quarter and has over 130,000 rooms in its development pipeline. For full year 2008, Marriott expects REVPAR to be flat to up 2% worldwide and for North American REVPAR to be up 1% or down 1%.
City National Corp reported first quarter 2009 net income of $7.5 million, down from $44 million in first quarter 2008. Earnings per share were $0.04 compared to $0.91 in first quarter 2008. Total deposits reached a record high of $13.7 billion, up 16% from first quarter 2008. However, revenue was down 16% from first quarter 2008 due to declines in wealth management fees and securities losses. The board approved a quarterly dividend of $0.10 per share, down from the previous $0.25, reflecting current economic conditions. Credit quality continued to weaken in the first quarter as real estate values declined and unemployment rose in key markets.
The interim report summarizes the company's financial performance in the first half of 2008. Key points include record profitability with an operating margin of 16.6% and net margin of 12.1%. Vehicle and service sales grew 15% and 30% respectively. Earnings per share increased 36% to SEK 12.52. The outlook predicts earnings in 2008 will be higher than 2007 due to continued strong demand outside of Europe.
1) Scania reported record earnings in the first half of 2008, with operating margin reaching 16.6% and net margin at 12.1%.
2) Scania is pursuing profitable growth through increasing vehicle and service sales. Revenue grew 15% while EBIT grew 30% in the first half of 2008.
3) Scania's vision is to reach annual production of 150,000 vehicles while maintaining a flexible cost structure and focus on customer productivity and uptime.
The interim report summarizes the company's performance in the first three quarters of 2008. Key highlights include operating margins reaching an all-time high of 15.8% and EBIT growth of 25%. Revenue and profitability increased due to higher vehicle and service volumes, price increases, and favorable product mix. However, order bookings for trucks have declined 51% in Western Europe and 34% in Central and Eastern Europe. While flexible production has helped, earnings forecasts for 2009 are not provided due to economic uncertainty. The service business continues growing with increased traffic and workshop utilization.
HQ Bank has experienced volume driven growth in its credit portfolio over the past 9 months of 2008. While the portfolio increased 8% in local currencies, bad debt provisions increased in several markets. The bank has a well balanced portfolio that is diversified across exposure levels, geographic areas, and products. It maintains a conservative refinancing policy and manages risks through matched funding and credit risk management.
1) Scania reported all-time high earnings in 2008 with operating income of SEK 12,512 million. However, deliveries declined 18% in Q4 as the company adjusted production rates due to decreased demand in Europe.
2) While the trucks and services segment grew profits through price increases, this was partially offset by negative impacts from lower deliveries, used vehicles, raw materials, and R&D spending.
3) Scania's flexible production system and focus on reducing inventory and postponing investments helped cash flow, but tied up capital increased with capacity investments. Outlook remains uncertain given rapid demand fall in Q4 2008 and high industry inventory levels.
The interim report summarizes the company's performance in the first three quarters of 2008. Key highlights include operating margins reaching an all-time high of 15.8% and EBIT growth of 25%. Vehicle deliveries increased 4% while service revenue grew due to the large installed base of vehicles. The outlook acknowledges earnings will be higher in 2008 than 2007 but provides no forecast for 2009 due to uncertainty.
- Scania's operating margin and net margin increased in the first nine months of 2008 compared to the same period in 2007. Net sales rose 11% while order bookings declined 29% due to lower demand in Europe.
- Earnings per share increased and the forecast for higher full-year 2008 earnings remains unchanged. However, due to lower order bookings and higher inventories, Scania will adjust production rates.
- Service revenue continued to show strong growth of 8%, while trucks deliveries increased 4% and various restructuring efforts are expected to generate annual cost savings of SEK 300 million from 2009.
1) Scania reported all-time high earnings in 2008 with operating income of SEK 12,512 million. However, deliveries declined 18% in Q4 as the company adjusted production rates due to decreased demand in Europe.
2) While the trucks and services segment grew profits through price increases, this was partially offset by negative impacts from lower deliveries, used vehicles, raw materials, and R&D spending.
3) Scania's flexible production system and focus on reducing inventory and postponing investments helped cash flow, but tied up capital increased with capacity investments. Outlook for 2009 is uncertain due to rapid demand fall in Q4 and high industry inventory levels.
This document is Scania's annual report for 2008. It discusses Scania's vision to be a leading company in its industry by creating value for customers, employees, shareholders, and society. The report outlines Scania's mission to supply high-quality vehicles and services for transporting goods and passengers in a sustainable way. It provides an overview of Scania's operations in trucks, buses, coaches, engines, and financial services. The financial reports indicate that Scania delivered 66,516 trucks, 7,277 buses and coaches, and 6,671 engines in 2008.
Our Chief Executive Officer is required to annually certify to the New York Stock Exchange that the company is in compliance with NYSE corporate governance listing standards or note any violations. On June 6, 2007, our Chief Executive Officer submitted this unqualified certification, indicating the company was in full compliance with NYSE standards as of that date.
Our Chief Executive Officer is required to annually certify to the New York Stock Exchange that the company is in compliance with NYSE corporate governance listing standards, though he may qualify the certification if needed. On June 6, 2007, our Chief Executive Officer submitted the certification with no qualification, indicating full compliance with NYSE standards as of that date.
The document outlines the corporate governance guidelines of Perini Corporation. It discusses (1) the composition and responsibilities of the Board of Directors, including director qualifications and independence, (2) the roles and responsibilities of Board committees, and (3) policies regarding Board performance evaluation, director orientation, management succession planning, and the company's code of business conduct. The guidelines are intended to assist the Board in exercising its duties to stakeholders.
The Perini Corporation Code of Business Conduct and Ethics outlines guidelines for ethical behavior. It applies to all directors, officers, and employees. The code establishes rules regarding conflicts of interest, procurement ethics, accounting practices, use of company property, environmental compliance, and insider trading. Any violations of the code are taken seriously and can result in disciplinary action up to dismissal.
The document outlines the Corporate Governance and Nominating Committee Charter for Perini Corporation. The purpose of the committee is to identify and evaluate potential board candidates and lead corporate governance efforts. The committee must consist of at least two independent directors appointed by the board. It has authority to retain outside advisors and meet at least twice per year. Regarding nominations, the committee evaluates candidates, recommends nominees, and assesses board independence. For corporate governance, the committee develops guidelines, reviews committee performance, and recommends criteria for director tenure.
The document is the Compensation Committee Charter for Perini Corporation. It outlines the committee's purpose of ensuring compensation programs attract and retain employees while representing fair value for shareholders. It details the committee's composition, duties, and responsibilities which include annually reviewing executive compensation programs, recommending director and CEO compensation, overseeing incentive plans, and preparing required compensation disclosures.
A toxic combination of 15 years of low growth, and four decades of high inequality, has left Britain poorer and falling behind its peers. Productivity growth is weak and public investment is low, while wages today are no higher than they were before the financial crisis. Britain needs a new economic strategy to lift itself out of stagnation.
Scotland is in many ways a microcosm of this challenge. It has become a hub for creative industries, is home to several world-class universities and a thriving community of businesses – strengths that need to be harness and leveraged. But it also has high levels of deprivation, with homelessness reaching a record high and nearly half a million people living in very deep poverty last year. Scotland won’t be truly thriving unless it finds ways to ensure that all its inhabitants benefit from growth and investment. This is the central challenge facing policy makers both in Holyrood and Westminster.
What should a new national economic strategy for Scotland include? What would the pursuit of stronger economic growth mean for local, national and UK-wide policy makers? How will economic change affect the jobs we do, the places we live and the businesses we work for? And what are the prospects for cities like Glasgow, and nations like Scotland, in rising to these challenges?
Madhya Pradesh, the "Heart of India," boasts a rich tapestry of culture and heritage, from ancient dynasties to modern developments. Explore its land records, historical landmarks, and vibrant traditions. From agricultural expanses to urban growth, Madhya Pradesh offers a unique blend of the ancient and modern.
What Lessons Can New Investors Learn from Newman Leech’s Success?Newman Leech
Newman Leech's success in the real estate industry is based on key lessons and principles, offering practical advice for new investors and serving as a blueprint for building a successful career.
Falcon stands out as a top-tier P2P Invoice Discounting platform in India, bridging esteemed blue-chip companies and eager investors. Our goal is to transform the investment landscape in India by establishing a comprehensive destination for borrowers and investors with diverse profiles and needs, all while minimizing risk. What sets Falcon apart is the elimination of intermediaries such as commercial banks and depository institutions, allowing investors to enjoy higher yields.
13 Jun 24 ILC Retirement Income Summit - slides.pptxILC- UK
ILC's Retirement Income Summit was hosted by M&G and supported by Canada Life. The event brought together key policymakers, influencers and experts to help identify policy priorities for the next Government and ensure more of us have access to a decent income in retirement.
Contributors included:
Jo Blanden, Professor in Economics, University of Surrey
Clive Bolton, CEO, Life Insurance M&G Plc
Jim Boyd, CEO, Equity Release Council
Molly Broome, Economist, Resolution Foundation
Nida Broughton, Co-Director of Economic Policy, Behavioural Insights Team
Jonathan Cribb, Associate Director and Head of Retirement, Savings, and Ageing, Institute for Fiscal Studies
Joanna Elson CBE, Chief Executive Officer, Independent Age
Tom Evans, Managing Director of Retirement, Canada Life
Steve Groves, Chair, Key Retirement Group
Tish Hanifan, Founder and Joint Chair of the Society of Later life Advisers
Sue Lewis, ILC Trustee
Siobhan Lough, Senior Consultant, Hymans Robertson
Mick McAteer, Co-Director, The Financial Inclusion Centre
Stuart McDonald MBE, Head of Longevity and Democratic Insights, LCP
Anusha Mittal, Managing Director, Individual Life and Pensions, M&G Life
Shelley Morris, Senior Project Manager, Living Pension, Living Wage Foundation
Sarah O'Grady, Journalist
Will Sherlock, Head of External Relations, M&G Plc
Daniela Silcock, Head of Policy Research, Pensions Policy Institute
David Sinclair, Chief Executive, ILC
Jordi Skilbeck, Senior Policy Advisor, Pensions and Lifetime Savings Association
Rt Hon Sir Stephen Timms, former Chair, Work & Pensions Committee
Nigel Waterson, ILC Trustee
Jackie Wells, Strategy and Policy Consultant, ILC Strategic Advisory Board
Every business, big or small, deals with outgoing payments. Whether it’s to suppliers for inventory, to employees for salaries, or to vendors for services rendered, keeping track of these expenses is crucial. This is where payment vouchers come in – the unsung heroes of the accounting world.
Economic Risk Factor Update: June 2024 [SlideShare]Commonwealth
May’s reports showed signs of continued economic growth, said Sam Millette, director, fixed income, in his latest Economic Risk Factor Update.
For more market updates, subscribe to The Independent Market Observer at https://blog.commonwealth.com/independent-market-observer.
How to Invest in Cryptocurrency for Beginners: A Complete GuideDaniel
Cryptocurrency is digital money that operates independently of a central authority, utilizing cryptography for security. Unlike traditional currencies issued by governments (fiat currencies), cryptocurrencies are decentralized and typically operate on a technology called blockchain. Each cryptocurrency transaction is recorded on a public ledger, ensuring transparency and security.
Cryptocurrencies can be used for various purposes, including online purchases, investment opportunities, and as a means of transferring value globally without the need for intermediaries like banks.
Explore the world of investments with an in-depth comparison of the stock market and real estate. Understand their fundamentals, risks, returns, and diversification strategies to make informed financial decisions that align with your goals.
Tdasx: Interpreting the 2024 Cryptocurrency Market Funding Trends and Technol...
1st_Qtr_Report_2008
1. Dear Stockholders:
The housing market remains soft in most areas. The selling homes. In FY 2008’s first quarter, we had 257 cancellations
season, which we believe starts in mid-January, has been weak totaling approximately $198.0 million, compared to 436
for the third year in a row. cancellations totaling $318.9 million in FY 2007’s first quarter,
and 417 cancellations totaling $328.5 million in FY 2007’s
We have seen a few recent glimmers of hope, for example, in fourth quarter. FY 2008 first-quarter net (after cancellations)
the Naples, Florida area and the suburban Washington, D.C. signed contracts totaled 647 homes, or $375.1 million, a decline
market. The improvement in Naples, which was a tremendous of 37% in units and 50% in dollars, compared to FY 2007’s first-
market before the downturn, is noteworthy because from quarter results of 1,027 net signed contracts, or $748.7 million.
March 2006 through late 2007, it seemed as though we couldn’t
give away a home in that market. In metro D.C., which was The average price per unit of gross contracts signed in
among the first markets to weaken, we have seen the glimmer FY 2008’s first quarter was $634,000, compared to $646,000
before and it faded; perhaps this time it won’t. in FY 2007’s fourth quarter and $730,000 in FY 2007’s first
quarter. The year-over-year decline in average price was
We continue to focus on maintaining our strong balance due primarily to a shift in product mix, as well as to some
sheet and liquidity. With over $950 million in cash and over additional incentives.
$1.2 billion available under our bank credit facility, which
matures in March 2011, we believe we are positioned to profit Ceaseless talk of a recession, and of declining house prices,
from opportunities that may arise in the current market. Our continues to dampen the mood of consumers in general. For
net debt-to-capital ratio(1) at 2008’s first-quarter end stood at home buyers, we believe this drumbeat, coupled with concerns
26.8%, our lowest level ever, compared to 31.0% one year ago. over mortgages and foreclosures, has kept pent-up demand on
the sidelines.
We continue to conservatively trim our land position. We
ended FY 2008’s first quarter with approximately 55,000 lots Household formations continue to grow as they are projected
owned or controlled, compared to approximately 91,200 at to do into the next decade. Personal wealth continues to be
our peak at the second-quarter end of FY 2006. We ended created as well. Mortgage rates are low, unemployment is still
the first quarter with 315 selling communities, down from low (by historical standards), and housing affordability has
The Santa Barbara at Villa Lago at The Promontory
the peak of 325 at FY 2007’s second-quarter end, and expect continued to improve. Conforming and jumbo mortgages
to be selling from approximately 300 communities by Fiscal are generally available to buyers such as ours, with strong
Year End 2008. credit scores and reasonably leveraged home purchases. We
For the Three Months Ended January 31, 2008
believe that revived buyer confidence is paramount to getting
In FY 2008’s first quarter, Toll Brothers generated a net loss the market moving again. Only when customers believe we
of $96.0 million, or $0.61 per share diluted, which included are done with housing deflation will the excess supply clear
pre-tax write-downs of $245.5 million, $27.8 million of which and the market return to equilibrium. We believe we are in a
was attributable to joint ventures. Excluding write-downs, FY buyer’s market. When our customers recognize that they can
2008’s first-quarter earnings were $57.3 million, or $0.35 per only take advantage of a buyer’s market by buying, we will be
First Quarter Report
share diluted. back on track.
For comparison, FY 2007’s first-quarter net income was $54.3 We thank our stockholders for their continued patience and
million, or $0.33 per share diluted, including pre-tax write- perspective, and our home buyers for their continued enthusiasm
downs and a $9.0 million goodwill impairment, together for our homes. We also thank our employees for their tremendous
totaling $105.9 million ($64.6 million, or $0.39 per share diluted, hard work and never-ending drive for excellence.
after tax). Excluding write-downs, FY 2007’s first-quarter
Horsham, Pennsylvania 19044-2323
earnings were $118.9 million, or $0.72 per share diluted.
FY 2008’s first-quarter total revenues were $842.9 million, 23%
250 Gibraltar Road
El Dorado Hills, California
lower than FY 2007’s first-quarter total revenues of $1.09 billion.
roBert i. toll Bruce e. toll
FY 2008’s first-quarter-end backlog was $2.40 billion, 42%
Chairman of the Board and Vice Chairman
1st Quarter Report
lower than FY 2007’s first-quarter-end backlog of $4.15 billion. Chief Executive Officer of the Board
Gross signed contracts for FY 2008’s first quarter of $573.1
million and 904 homes declined 46% and 38%, respectively,
versus FY 2007’s same period totals of $1.07 billion and 1,463
Zvi BarZilay
President and Chief Operating Officer
Net debt-to-capital is calculated as total debt minus mortgage
(1)
February 27, 2008
warehouse loans minus cash, divided by total debt minus
mortgage warehouse loans minus cash plus stockholders’ equity.
2. Corporate Profile Condensed Consolidated Statements of Operations
Toll Brothers, Inc. is the nation’s leading builder of luxury homes. The Company began business in 1967 and became (Amounts in thousands, except per share and housing data)
a public company in 1986. Its common stock is listed on the New York Stock Exchange under the symbol “TOL.” The (Unaudited)
three Months ended Jan. 31,
Company serves move-up, empty-nester, active-adult, and second-home buyers and operates in Arizona, California,
2008 2007
Colorado, Connecticut, Delaware, Florida, Georgia, Illinois, Maryland, Massachusetts, Michigan, Minnesota, Nevada,
reveNueS
New Jersey, New York, North Carolina, Pennsylvania, South Carolina, Texas, Virginia, and West Virginia.
Completed contract $ 826,534 $1,054,136
Toll Brothers builds luxury single-family detached and attached home communities; master planned luxury residential,
resort-style golf communities; and urban low-, mid-, and high-rise communities, principally on land it develops and Percentage of completion 15,795 33,085
improves. The Company operates its own architectural, engineering, mortgage, title, land development and land sale,
Land sales 523 3,390
golf course development and management, and landscape subsidiaries. The Company also operates its own lumber
842,852 1,090,611
distribution, and house component assembly and manufacturing operations.
Toll Brothers, a Fortune 500 company, is the only publicly traded national home building company to have won all three
coStS oF reveNueS
of the industry’s highest honors: America’s Best Builder, the National Housing Quality Award, and Builder of the Year.
Completed contract 834,196 846,403
Condensed Consolidated Balance Sheets Percentage of completion 12,888 25,897
Land sales 434 1,037
(Amounts in thousands)
Jan. 31, 2008 oct. 31, 2007
Interest 20,967 22,643
(Unaudited)
868,485 895,980
aSSetS The Villarica at Saguaro Estates Scottsdale, Arizona
Cash and cash equivalents $ 956,644 $ 900,337
Selling, general and administrative expenses 121,318 134,210
Inventory 5,273,702 5,572,655
Goodwill impairment - 8,973
Property, construction, and office equipment, net 98,342 84,265
(Loss) income from operations (146,951) 51,448
Receivables, prepaid expenses, and other assets 130,331 135,910
$3,497.8
$5,947
$3,413.4
Other
Contracts receivable 24,471 46,525
(Loss) earnings from unconsolidated entities (24,086) 6,792
$2,942.0
Mortgage loans receivable 78,544 93,189
$4,888
Interest and other 19,082 28,960
Customer deposits held in escrow 31,824 34,367
(Loss) income before income taxes (151,955) 87,200
$4,150
Investments in and advances to unconsolidated entities 156,931 183,171
$1,443
$1,341.0
Income tax (benefit) provision (55,998) 32,884
$2,108.6
Deferred tax assets, net 269,830 169,897
Net (loss) income $ (95,957) $ 54,316
$2,945
$ 7,020,619 $ 7,220,316
$1,090.6
$1,549.2
$1,140
$2,399
$990.3
(loSS) earNiNGS Per SHare
liaBilitieS aND StocKHolDerS’ eQuity
Basic $ (0.61) $ 0.35
liabilities
$842.9
$903
Diluted $ (0.61) $ 0.33
Loans payable $ 712,015 $ 696,814
$749
Weighted-average number of shares
Senior notes 1,142,591 1,142,306
$595.6
Basic 157,813 154,212
Senior subordinated notes 350,000 350,000 ‘04 ‘05 ‘06 ‘07 ‘08 ‘04 ‘05 ‘06 ‘07 ‘08
Diluted 157,813 164,048
Mortgage company warehouse loan 67,605 76,730
$375
Customer deposits 226,713 260,155 IN MILLIONS IN MILLIONS
HouSiNG Data 2008 2007
AT F Y E J A N U A R Y 3 1 AT Q E J A N U A R Y 3 1
Accounts payable 192,346 236,877
Number of homes closed 1,208 1,559
Accrued expenses 694,283 724,229 ‘04 ‘05 ‘06 ‘07 ‘08 ‘04 ‘05 ‘06 ‘07 ‘08
Revenues from home sales (in millions) $ 842.3 $ 1,087.2
Income taxes payable 213,670 197,960
Number of homes contracted 647 1,027
Total liabilities 3,599,223 3,685,071 IN MILLIONS
Value of contracts signed (in millions) $ 375.1 $ 748.7
IN MILLIONS
THREE MONTHS ENDED THREE MONTHS ENDED
JANUARY 31
8,014 8,011 JANUARY 31
Minority interest at JaNuary 31,
Value of backlog — net (in millions) $ 2,398.9 $ 4,149.9
Stockholders’ equity
StateMeNt oN ForWarD-looKiNG iNForMatioN
Common stock 1,585 1,570 Number of homes in backlog 3,341 5,949
Certain information included herein and in other Company reports, SEC filings, verbal or written statements, and presentations is forward-looking within the meaning of the Private Securities
Litigation Reform Act of 1995, including, but not limited to, information related to anticipated operating results, financial resources, changes in revenues, changes in profitability, changes in
Number of lots controlled 55,014 67,465
Additional paid-in capital 258,718 227,561 margins, changes in accounting treatment, interest expense, land-related write-downs, effects of home buyer cancellations, growth and expansion, anticipated income to be realized from our
Retained earnings 3,155,508 3,298,925 investments in unconsolidated entities, the ability to acquire land, the ability to gain approvals and to open new communities, the ability to sell homes and properties, the ability to deliver homes
from backlog, the ability to secure materials and subcontractors, the ability to produce the liquidity and capital necessary to expand and take advantage of opportunities in the future, industry
Treasury stock, at cost (787) (425) toll Brothers, inc. corporate office
trends, and stock market valuations. Such forward-looking information involves important risks and uncertainties that could significantly affect actual results and cause them to differ materially from
expectations expressed herein and in other Company reports, SEC filings, statements, and presentations. These risks and uncertainties include local, regional, and national economic conditions,
Accumulated other comprehensive income (1,642) (397) 250 Gibraltar Road, Horsham, PA 19044 215-938-8000 TollBrothers.com NYSE:TOL
the demand for homes, domestic and international political events, uncertainties created by terrorist attacks, the effects of governmental regulation, the competitive environment in which the
Company operates, fluctuations in interest rates, changes in home prices, the availability and cost of land for future growth, adverse market conditions that could result in substantial inventory
Total stockholders’ equity 3,413,382 3,527,234 write-downs, the availability of capital, uncertainties and fluctuations in capital and securities markets, changes in tax laws and their interpretation, legal proceedings, the availability of adequate
investor relations
insurance at reasonable cost, the ability of customers to obtain adequate and affordable financing for the purchase of homes, the ability of home buyers to sell their existing homes, the ability of our
$ 7,020,619 $ 7,220,316 partners and joint ventures in various transactions to honor their commitments, the availability and cost of labor and materials, construction delays, and weather conditions. Any or all of the forward-
Frederick N. Cooper, Senior Vice President - Finance 215-938-8312 fcooper@tollbrothersinc.com
looking statements included herein and in any Company reports of public statements are not guarantees of future performance and may turn out to be inaccurate. Forward-looking statements
For more information, visit our website at tollBrothers.com. speak only as of the date they are made. We undertake no obligation to publicly update any forward-looking statements, whether as a result of new information, future events, or otherwise.
Joseph R. Sicree, Senior Vice President - Chief Accounting Officer 215-938-8045 jsicree@tollbrothersinc.com
TOL-11935-11935