
More Related Content
What's hot
What's hot (16)
Similar to center- point energy annual reports 2004
Similar to center- point energy annual reports 2004 (20)
More from finance41
More from finance41 (20)
Recently uploaded
Recently uploaded (20)
center- point energy annual reports 2004
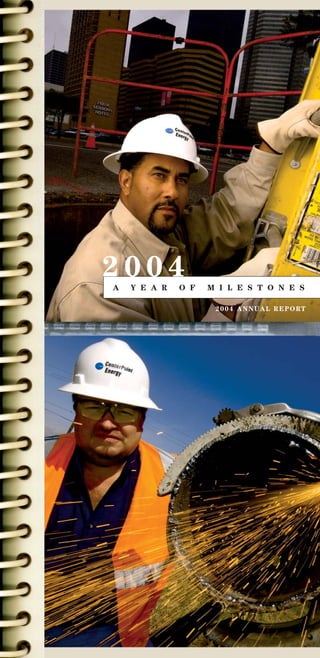
- 1. 2004 A YEAR OF MILESTONES 2 0 0 4 A N N U A L R E P O RT
- 2. MILESTONE HIGHLIGHTS • Sold our power generation subsidiary, Texas Genco, for $3.65 billion in two phases, the second of which was completed in mid April 2005 • Received approval from the Public Utility Commission of Texas (PUC) for the recovery of a portion of our true-up request • Reduced our debt and cut interest costs A YEAR OF MILESTONES A major part of our plan when we formed CenterPoint Energy was to sell Texas Genco, our power generation subsidiary. Mission accomplished. We sold our 81 percent interest in Texas Genco for $2.9 billion. With proceeds from the sale, we began paying down debt. Recovering the amounts due the company under the 1999 Texas Electric Restructuring Law was another important part of the original plan for CenterPoint Energy. However, the PUC granted our electric transmission and distribution subsidiary considerably less than we requested. We were disappointed in the PUC’s actions and filed an appeal with the Texas courts. In the meantime, we received approval of a financing order that would allow us to issue approxi- mately $1.8 billion in transition bonds. Unfortunately, appeals by other parties will delay our issuance of the bonds. In addition, about $600 million will be recovered over time through a charge to retail electric providers. Proceeds from the sale of Texas Genco and the amounts we receive under the Texas Electric Restructuring Law will allow us to significantly reduce our debt and save hundreds of millions of dollars in interest during 2006.
- 4. A B O U T O U R C O M PA N Y CenterPoint Energy, Inc., based in Houston, Texas, is a domestic energy delivery company with operations that include electric transmission and distribution, natural gas distribution and sales, interstate pipelines and natural gas gathering. The company serves nearly five million metered electric and natural gas distribution customers in Arkansas, Louisiana, Minnesota, Mississippi, Oklahoma and Texas. Assets total about $17 billion after the sale of our subsidiary, Texas Genco. With more than 9,000 employees, CenterPoint Energy and its predecessor companies have been in business for more than 130 years. For more information, please visit our Web site at www.CenterPointEnergy.com. Above: Jim Brush, Lead Construction and Maintenance Technician in Little Rock, welds pipe before installation; Pam Riche supervises gathering services in Shreveport, TABLE OF CONTENTS and from left, Linemen Roy McDonald, Shannon Thames and James Kohler head out prepared for inclement weather. Financial Highlights 3 Letter to Shareholders 4 On the Cover: Committed to Shareholders 8 Outside top: Ronald Bruno, Cable Splicer, Underground, emerges from a manhole in downtown Houston. Bottom: Committed to Customers 14 Fred Pitcher, Construction Inspector, conducts an inspection Committed to Employees 22 at a natural gas construction site in Houston. Inside from top left clockwise: Peaches Hardison reads meters in Committed to Community 26 Houston; Robert Zych, left, and Kevin Fahey are part of Board of Directors 30 a construction and maintenance crew in Minnesota; Chivonne Miller dispatches repair jobs in Minnesota; and Officers 31 John Lobue is a Gathering Technician at Stateline Waskom Financial Information 32 on the Texas-Louisiana border.
- 5. OVER 130 YEARS OF RELIABLE SERVICE FINANCIAL HIGHLIGHTS Year Ended December 31 2002 2003 2004 (In Millions Of Dollars Except Per Share Amounts) Revenues $ 6,438 $ 7,790 $ 8,510 Operating Income $ 1,440 $ 1,355 $ 864 Income From Continuing Operations (1) $ 482 $ 409 $ 205 Per Share of Common Stock: Income From Continuing Operations, Basic (1) $ 1.62 $ 1.35 $ 0.67 Income From Continuing Operations, Diluted (1) $ 1.61 $ 1.24 $ 0.61 Book Value – Year End $ 4.74 $ 5.77 $ 3.59 Market Price – Year End $ 8.01 $ 9.69 $ 11.30 Common Dividend Paid $ 1.07 $ 0.40 $ 0.40 Capitalization: Long-term Debt (Includes Current Maturities) $ 9,996 $ 10,939 $ 9,029 Trust Preferred Securities (2) $ 706 $ — $ — Common Stock Equity $ 1,422 $ 1,761 $ 1,106 Total Capitalization (Includes Current Maturities) $ 12,124 $ 12,700 $ 10,135 Total Assets $ 16,041 $ 17,217 $ 16,597 (3) Capital Expenditures (3) $ 566 $ 497 $ 530 Common Stock Outstanding (4) (in thousands) 300,102 305,385 308,045 Number of Common Shareholders 67,308 63,660 59,448 Number of Employees 12,019 11,046 9,093 1. Before extraordinary loss. 2. See footnote (4) on page 34. 3. Excluding discontinued operations. See page 34. 4. Excludes ESOP shares of 4,915,577 and 911,847 at December 31, 2002, and 2003, respectively. 3
- 6. LETTER TO SHAREHOLDERS DEAR FELLOW SHAREHOLDERS, Thank you for investing your trust in CenterPoint Energy. Our vision is “to be recognized as America’s leading energy delivery company . . . and more.” We believe we will have achieved this vision when CenterPoint Energy delivers world-class performance to four key stakeholder groups beginning with you, our shareholders, but also including our Milton Carroll, left, Chairman of the Board, customers, our employees and the communities we serve. and David McClanahan, President and We are pleased with the progress we made in 2004, but we Chief Executive Officer know there is more work that needs to be done. Investors today seek sound investments in companies that share their values. At CenterPoint Energy, our core values of integrity, accountability, initiative and respect guide everything we do. To achieve our vision, we need strong values and a sound corporate strategy. Though detailed in its execution, our strategy can be easily summarized: “One Company, Get it Right, and Grow.” By “One Company,” we mean that we will leverage our talents and resources across our entire company rather than operate as a collection of smaller, autonomous business units. By “Get it Right,” we mean that we will constantly focus on making our businesses more efficient and cost- effective. Finally, by “Grow,” we mean that we want to
- 7. OUR VISION IS “TO BE RECOGNIZED AS A M E R I C A’ S L E A D I N G E N E R G Y D E L I V E R Y COMPANY . . . AND MORE.” expand our company and increase the value of your $2.2 billion, in late 2004 with the sale of 11 coal, lignite investment over time. (See page 21 of this report for and gas-fired power plants. Following approval of the examples of our One Company, Get it Right, and Grow Nuclear Regulatory Commission, we were able to complete strategic initiatives). the final phase of the sale in April 2005 by selling our investment in the South Texas Project nuclear power plant for $700 million. Sale of Texas Genco and our electric subsidiary “true-up” proceeding 2004 was a watershed year. Since CenterPoint Energy was The second key event is the recovery of costs associated created in 2002 as a regulated utility company with a with the transition to electric competition in Texas. The significant amount of debt, we have looked forward to recovery of these costs was provided for in the 1999 law completing the two key events that would allow us to return that restructured Texas’ electric utility industry. In March to debt levels more typical for a utility our size and help 2004, we filed a “true-up” request with the Public Utility solidify our investment-grade credit ratings. These two Commission of Texas (PUC) to recover $3.7 billion in important events were the sale of our electric generation stranded costs and regulatory assets, excluding interest. assets and the recovery of our “stranded” costs associated In December, the PUC approved (subject to certain with the restructuring of the Texas electric market. We adjustments) approximately $2.3 billion, including interest are pleased to report we made significant progress on through August 31. both events last year. Frankly, we were very disappointed by this ruling. We don’t In July 2004, we announced the sale of our electric believe the Commission followed the law or its own generation business, Texas Genco, for $3.65 billion. regulations on a number of significant issues, and in CenterPoint Energy received $2.9 billion for our 81 percent January, we filed an appeal with the Texas state courts. interest in the company. The sale was structured in two However, it will likely take a number of years before phases. We finished the first phase, for which we received the appeals process is complete. 5
- 8. LETTER TO SHAREHOLDERS With the proceeds from the first step in the sale of 2004: a solid year for core electric, gas and Texas Genco, we were able to reduce our company’s pipeline operations Even as our senior management team focused much indebtedness by $2 billion in 2004. This year, by combining attention in 2004 on the sale of Texas Genco and our true-up the proceeds from the second step in the sale of our case, employees in our core electric, gas and pipeline interest in the power generation subsidiary along with operations turned in their best performance in our brief the sale of approximately $1.8 billion in low-cost transition history as CenterPoint Energy. bonds, we will be in position to further reduce our company’s debt. These low-cost bonds cover most of In Houston, our electric transmission and distribution the transition costs that were approved by the PUC in operations continued to show overall improvement. We our true-up case. increased our core operating income by $33 million over 2003, added nearly 47,000 new metered customers and met Unfortunately, several parties have appealed the financing system reliability goals after establishing an aggressive order authorizing the bond sale, which will delay our recovery special program to cut outage times. of these costs for a number of months. We will, however, continue to earn interest on the approved amount during Our natural gas delivery and gas marketing operations also the consideration of these appeals. had their best year, raising operating income by $20 million. Spurred by strong growth in the metropolitan The sale of our power generation subsidiary and the areas of Houston and Minneapolis, we added about 45,000 transition bonds are not, however, the only ways we are customers. We also achieved high customer satisfaction working to improve our company. Through our One scores. Our gas marketing business increased sales to Company, Get it Right and Grow strategic initiatives, we electric and gas utilities as well as to large commercial and are taking important steps to make our company more industrial customers. efficient, cost effective and profitable.
- 9. W E S O L D O U R P O W E R G E N E R AT I O N B U S I N E S S F O R $ 2 . 9 B I L L I O N A N D S I G N I F I C A N T LY REDUCED OUR DEBT Likewise, our pipeline group had its best year ever, company is well positioned to successfully pursue our vision improving operating income by $22 million. We connected of being recognized as America’s leading energy delivery a record number of new natural gas wells and began an company … and more. expansion of our pipelines, storage facilities and remote wellhead monitoring services. Thank you for your continued confidence in us. 2005: positioned for the future We achieved much in 2004, and we’re excited about our future. In the near term, we will continue to execute our plan Milton Carroll to reduce the company’s debt and enhance operations to Chairman of the Board better serve our customers. As the financial strength of the company continues to improve, we will actively pursue potential growth opportu- David M. McClanahan nities in areas that complement our core energy delivery President and Chief Executive Officer business. However, we will pursue these opportunities only when we believe they will create sustainable shareholder value. The CenterPoint Energy management team is committed to achieving our vision and strategy. We believe our accomplishments last year are evidence of this. We met the difficult challenges we faced in 2004 and we feel the 7
- 10. COMMITTED TO SHAREHOLDERS 17,000 New Customers MINNEAPOLIS CHICAGO ST. LOUIS WICHITA LITTLE ROCK OXFORD LAWTON Inset photo: Key finance execu- TYLER SHREVEPORT tives, Brenda Cauthen, VP Audit GULFPORT/ BILOXI Services, Jim Brian, Senior VP LAKE CHARLES HOUSTON and Chief Accounting Officer, and Walter Fitzgerald, VP and 74,000 Controller, examine internal LAREDO New Gas and controls and audit processes in Electric Metered Customers compliance with the new federal rules related to the Sarbanes- Oxley Act.
- 11. A YEAR OF EXCEPTIONAL PROGRESS CenterPoint Energy is committed to providing shareholders Our natural gas distribution segment reported operating a well-managed company dedicated to paying competitive income of $222 million, an increase from $202 million in dividends and building shareholder value. As described on 2003. This higher income was the result of rate increases, a the inside front cover of this report, we are focused on using higher customer count and more efficient operations. proceeds from the sale of Texas Genco and the true-up proceeding to reduce debt and interest costs. While we An aggressive restructuring plan that improved operational reported losses in 2004 related to the sale of our generating efficiencies and lowered ongoing operating expenses assets and stranded cost proceedings, our core electric, contributed to the income gains. However, one-time charges gas and pipeline delivery businesses posted solid gains in related to the restructuring plan, and mild winter operating income. weather that led to lower customer gas usage, partially offset these gains. All core segments report higher operating income Our electric transmission and distribution business continued Our pipelines and gathering segment increased operating to perform well in 2004, ending the year with core operating income to $180 million from $158 million in 2003. The income of $441 million (excluding the impact of ECOM increase was driven by favorable market pricing and higher revenues, the transition bond company and the final fuel demand on our interstate pipelines business, increased reconciliation). Driven primarily by the addition of nearly throughput, an increase in treating and processing by our 47,000 new metered customers, core operating income gas gathering unit and higher third party earnings increased by $33 million (excluding the impact of ECOM in Pipeline Services. revenues, the transition bond company and the final fuel reconciliation). Operating income also benefited from lower Customer base growing across our business employee-related costs and proceeds from a land sale, but We experienced customer growth in each of our energy was partially offset by decreased usage due to milder delivery businesses in 2004. These increases provided both weather and higher transmission costs. current revenue growth and, we expect, the basis for future 9
- 12. COMMITTED TO SHAREHOLDERS OUR CORE ENERGY DELIVERY BUSINESSES ACHIEVED EXCELLENT FINANCIAL RESULTS WHILE CONTINUING T O M A K E O P E R AT I O N A L I M P R O V E M E N T S earnings growth. Houston and Minneapolis, two of the Improving earnings through rate relief and rate design nation’s fastest growing metropolitan areas, together added We remain committed to achieving our allowed rate of more than 91,000 electric and natural gas customers in 2004. return in our regulated businesses. As part of this strategy, we will seek rate increases when necessary. In 2004, In the Houston area, we added a total of 47,000 new electric CenterPoint Energy sought and received significant rate meters to our previous base of 1.8 million and 27,000 new relief in several jurisdictions. natural gas customers to the 1 million we currently serve. The strong residential housing market in the Minneapolis In the Houston metropolitan area, we received approval for area accounted for most of the approximately 17,000 new $14 million in base rate increases from the Texas Railroad customers in Minnesota, where we serve 750,000 customers. Commission, the city of Houston and 28 other cities. In We also added gas distribution customers in Little Rock, addition to the base rate changes, we also established gas Ark., Shreveport, La., suburban Jackson, Miss., and the cost adjustment clauses that help mitigate fuel price risks corridor between Austin and San Antonio, Texas. by enhancing our ability to more quickly reflect the current estimated cost of gas in customers’ bills. Our interstate pipelines operations signed new seven-year contracts with our Arkansas, Louisiana and Texas gas We also obtained rate relief in Louisiana and Oklahoma, distribution operations that will provide long-term stability. resulting in a $2 million increase in base rates and The gas gathering business enjoyed a record-setting year, service charges in our southern Louisiana service connecting 393 new natural gas wells, completing eight new territory, a $7 million increase in base rates and service major gathering projects and installing 1,800 additional charges in northern Louisiana and a $3 million rate increase ServiceStar units, our remote wellhead monitoring and in Oklahoma. We also obtained rate stabilization clauses measuring product. Pipeline Services continued to make in northern Louisiana and Oklahoma, which are similar progress providing pipeline operations, maintenance and to the clause that is already in effect in southern Louisiana. technical services to third party clients. The stabilization clauses allow us to make small annual
- 13. Robert Newberry, Project Manager, Corporate Communications, sizes up a storage tank at the Sligo Plant in Haughton, La. adjustments to rates without filing expensive and time- consuming rate cases. In Minnesota, our request for a $22 million rate increase and new rate design to improve margin stability is currently under review by regulators. Interim rates of $17 million went into effect on Oct. 1, 2004, for all customers, subject to refund. We have reached a settlement with the Minnesota Department of Commerce for an annualized increase of approximately $9 million, subject to approval by the Minnesota Public Utilities Commission (MPUC). A decision Jason Hobbs, Lineman at the Fort Bend Service Center by the MPUC is expected in the second quarter of 2005, and near Houston, stands ready to serve customers. we expect to implement new rates by the end of the summer. In April 2005, we received approval from the Texas our company’s size and skills to continually improve Railroad Commission for a $2 million base rate increase our operating performance. for unincorporated areas in Texas. In November of 2004, we filed a request with the Arkansas Public Service CenterPoint Energy’s electric transmission and distribution Commission for about $34 million in increases. We expect organization is in the third year of its ongoing program to a decision to be made on this request in the second improve performance and achieve top-quartile status in half of 2005. service reliability, cost efficiency and customer satisfaction, while at the same time, lowering capital spending. They Get it Right – improving our operating efficiency have had success in improving their operating income A key element of our strategy to “Get it Right” is to leverage and reducing capital spending, and they are working to 11
- 14. COMMITTED TO SHAREHOLDERS Reynaldo Carabajal, Construction and Maintenance Technician, uncoils piping at a construction site in New Braunfels, Texas. control costs and continue to make improvements in Targeting new customers for growth their overall performance. While we continue to experience strong customer growth in many of our service territories, we are committed to Our gas delivery business turned in a strong performance in expanding our business by strategically targeting new 2004. In Houston, we achieved our target earnings, despite growth opportunities. warmer weather during the heating season, primarily by effectively managing costs. Employees were able to In Minnesota, we are focusing our customer acquisition stay within budget while meeting service objectives and efforts on high-growth residential areas, ethanol production controlling capital expenditures and operating and facilities and large natural gas-fired electric generation maintenance costs. facilities. During 2004, we signed contracts to serve four new commercial/industrial customers who will use more Our pipeline businesses are ranked in the top quartile than 5 billion cubic feet (Bcf) of natural gas annually, among pipeline companies with operations similar to ours, which is equivalent to the consumption of 50,000 residential according to the results of an internal study conducted in customers. With nearly 240,000 repair plan customers, our 2004. The study benchmarked the operating costs for appliance sales and repair business in Minnesota, Home Service Plus® (HSP), covers more than 1.3 million appliances pipelines in the United States as a starting point for comparisons. We were ranked in the top quartile in all and is the largest furnace and appliance repair provider measures. Still, recognizing that newly enacted regulatory in Minnesota. It is also the largest provider of residential requirements are placing increased pressure on our heating, ventilation and air conditioning replacement operating costs, Pipeline Services and Field Services began equipment in the state. a full review of our construction and maintenance processes in 2005 to ensure that we continue to operate our business at In our pipelines business, we signed contracts and filed a maximum efficiency. request seeking regulatory approval for major pipeline growth and for an expansion of our Chiles Dome storage
- 15. W E A R E C O M M I T T E D T O S T R AT E G I C A L LY TA R G E T I N G NEW GROWTH OPPORTUNITIES field in Oklahoma. Additionally, we are pursuing on- and off- for Longhorn Partners Pipeline, LP; modernizing our Ada system storage opportunities to meet increasing customer Storage compression facilities; completing our Integrity demand brought about by highly volatile commodity prices Management Plan; and developing a strategic workforce and shifts in gas flows. Increased traditional drilling in our plan to ensure that we meet our future labor requirements. major supply basins, new coal-bed methane drilling in the Arkoma Basin and strong relationships with our current customers offer us new and continuing opportunities to grow our field services operations. Similarly, we are aggressively looking for ways to grow and leverage our ServiceStar business, an industry leading provider of remote monitoring automation and measurement services. Plans are under way to unbundle our current product offerings and add new services that include commu- nication services, automation of existing electronic flow measurement devices and monitors, and development of a personal data application for manual monitoring. Pipeline Services continued to expand in 2004, managing customer pipeline integrity projects and offering onshore and offshore pipeline operations and technical services. Pipeline Services also continued to provide services to No matter how remote, ServiceStar, in the fenced our affiliated pipelines and distribution units. Major area to the right, can provide monitoring service for projects we completed included commissioning services well and compression operations. 13
- 16. COMMITTED TO CUSTOMERS Clockwise from top left, Linemen Nick White left, and James Candelari ride high at a Houston freeway construction site; Scott O’Brien at Houston’s H.O. Clarke Service Center and Dante Evans, who helped restore power in Florida after Hurricane Ivan caused damage that included leaving boats aground.
- 17. W E ’ R E “ A LW AY S T H E R E ” F O R O U R CUSTOMERS – DELIVERING SAFE AND R E L I A B L E E N E R G Y S E RV I C E S CenterPoint Energy has a strong commitment to delivering monthly targets designed to reduce allowable outage time a safe and reliable electric and natural gas service to our little each month so we could still meet our original goal by customers. This is at the heart of what we mean when we the end of the year. With hard work by everyone in service say we are “Always There” for our customers. In 2004, we restoration, we reached our goal. This accomplishment is delivered on that promise, not only for our own customers, especially significant because it was achieved while but also for our neighbors in Florida and Alabama, alternating crews shuttled back and forth between Florida who found themselves without power following four and Alabama to help neighboring utilities restore power devastating hurricanes. following hurricanes Charley, Frances, Ivan and Jeanne. Electric Reliability – outage goals achieved Gas Reliability – emergency response times improve Despite assisting other utilities with their restoration efforts, Delivering natural gas to homes and businesses is and facing a series of small but powerful spring storms in one of the most reliable forms of energy delivery. We the Houston area, our employees worked together to find a determine the reliability of our natural gas distribution way to meet the company’s electric service reliability goals. businesses by measuring both the number of gas outages and how quickly our crews restore service when We measure overall reliability results using the there is trouble. System Average Interruption Duration Index (SAIDI), which records the number of minutes the average customer is In Houston, the reliability of our natural gas delivery system without power during the year. Following the unusual series improved over the previous year. We experienced fewer gas of storms early in the year, it appeared unlikely we could outages and successfully reduced our emergency response meet our SAIDI goal. By the end of July, we were on a path time by 8.3 percent over 2003. that would exceed our total allowable outage time by 20 percent. To get back on track, we established a special In Minnesota, system damage and damage location requests SAIDI Recovery Plan. The plan set aggressive daily and showed an 8.5 percent decrease. We also reduced the 15
- 18. COMMITTED TO CUSTOMERS Angel Dominguez reads meters in Houston. Randy Draper, Gas Gathering Technician at the Haughton, La., office, checks a storage tank. number of gas outages and the time customers were without 2003. The safety record of our southern gas operations was service. There were 1,271 customers affected by gas outages exemplary, earning our company the American Gas in 2004, totaling 6,103 hours. This is an improvement over Association’s (AGA) top safety award for 2003. We improved 2003 when 1,559 customers were without service for a on the 2003 record during 2004, all but assuring a top ranking total of 6,460 hours. in the next AGA ratings. Similarly, our Houston operations received an AGA safety award last year for being a leader in In our southern states, we created a combined Gas Control accident prevention in 2003. Our employees in Houston Group, which has the ability to track the status of the gas worked 1 million hours without a lost time injury during a system in “real time.” This allows us to make quicker and one-year period that ended Aug. 27, 2004. more accurate decisions on how to respond to a cut line or other problem on the system. It also helps reduce the time In Minnesota, we did not reach our safety goals for necessary to restore the system and the number of people preventable vehicle collisions, so we implemented several who may be affected by an outage. measures to reduce vehicle accidents in the future. We have: • Implemented a program to address distracted driving; Continuing award-winning safety in our communities In the communities we serve, we recognize that customers • Provided National Safety Council courses for count on us to provide safe and reliable energy delivery, our drivers; and and we honor the trust they have in us. Ensuring that our • Changed our vehicle collision review process employees operate our systems safely is a key element to include review boards with front-line of our continuing commitment to both our employees employees, supervisors and managers from and our customers. multiple divisions. The overall safety record for our natural gas operations was Our Pipeline Services business achieved the best safety very good last year, showing significant improvement over performance in its history in 2004, reducing the
- 19. W E A R E C O M M I T T E D T O C O N T I N U A L LY IMPROVING OUR SERVICE TO CUSTOMERS Occupational Safety & Health Administration (OSHA) Recordable Incident Rate by 15 percent while increasing the number of hours worked by 9 percent. Our pipelines safety record is one of the best in the industry. Operational Excellence – improving service and response time All of our business units reported successes in their operations in 2004. Our electric operations unit expanded a shared trenching effort that now includes the installation of both telephone Construction Inspectors Johnny Rawls, left, and cable lines in the same trench with our electric cable and Fred Pitcher inspect work at a Houston and gas pipe. As a result of this initiative, we lowered construction site. installation costs and expect to realize future savings to receive timely electric service. The new system now through reduced cable cuts and buried line locator expenses. identifies instances in which there are multiple service requests for a single address, and it “stacks” them so they Also, along with the rest of the Texas retail electric market, can all be processed at the same time. As a result, CenterPoint Energy helped launch and complete a massive CenterPoint Energy’s manual work load is reduced by two-year project to automate the move-in/move-out process 90 percent, saving us time and money. for electricity customers. This was a major milestone involving a collaborative process in which market Our natural gas delivery business is focusing on implementing participants worked together to benefit customers. As a new computer technology to reduce costs and improve result, customers moving into a new home can expect 17
- 20. COMMITTED TO CUSTOMERS Fans of the Houston Livestock Show and Rodeo enjoy the benefits of electric power and natural gas. service times. Currently, we are implementing a new and implement a new customer care computer system. customer care computer system that will replace three We expect to realize annual savings of $10 million beginning in different computer applications and allow us to realize 2005 as a result of these changes. significant savings by retiring aging legacy computer systems. By the end of 2004, we had completed 43 percent of We also granted open access on our rural Texas distribution this system upgrade and achieved software and personnel systems to qualified commercial and industrial customers. cost savings. We are scheduled to complete this project With open access, qualified customers obtain their own by the end of 2005. natural gas supplies and use CenterPoint Energy to transport these supplies to their facilities. This service was Additionally, approximately 80 percent of our natural gas already available in Arkansas, northern Louisiana and distribution crews are now equipped with a new mobile data Oklahoma. The conversion to open access will be complete system, which uses laptop computers in our trucks, to give us when qualified commercial and industrial customers in more efficient dispatching and rapid customer service. We southern Louisiana, Mississippi and Houston, Texas, are plan to have 100 percent of our business using mobile data granted this option in the future. systems by the fourth quarter of 2005. In Arkansas, we replaced 84 miles of older cast iron Technological improvements, however, are not the only and bare steel pipe with more than $23 million worth of ways we are working to improve service quality. In our new piping. This is part of a 10-year, 1,700-mile pipe southern gas service territories in Arkansas, Louisiana, replacement program. Mississippi, Oklahoma and Texas, we completed a major organizational restructuring program in 2004 without Customer Satisfaction – operational disruptions. This allowed us to reduce the striving for top-quartile performance number of payment centers across the service territory, Providing safe, reliable and efficient natural gas and electric centralize customer call center operations in Shreveport, La., service is where our commitment to customers begins, but
- 21. WE AIM FOR EXCELLENCE IN OUR WORK SO O U R C U S T O M E R S C A N E N J O Y W H AT I S M O S T IMPORTANT IN THEIR LIVES it doesn’t end until we exceed their expectations for the products and services we provide. Our customer satisfaction results in 2004 were mostly positive, with high and improving scores in our gas operations, but lower scores in our electric operations. CenterPoint Energy’s goal for all areas of our company remains top-quartile performance. In the J.D. Power and Associates (JDPA) annual residential study of natural gas utilities, our Minnesota customers gave us a top quartile ranking for customer service in the Midwest region, an improvement from the second quartile ranking we achieved last year. Our gas operations in the southern We help customers enjoy themselves by providing states outside the city of Houston, which was ranked lighting at athletic fields. separately, also showed improved performance, moving up from the fourth to third quartile in the South region. storms. These storms occurred at the same time JDPA was In Houston, our natural gas customer satisfaction scores surveying customers, which we believe resulted in the held steady compared to last year, maintaining a second lower customer ratings. quartile ranking. Even though we ultimately achieved our 2004 electric Our electric customer satisfactions scores, however, reliability goals, we have renewed our focus on improving declined from top quartile to third quartile in the power restoration plan performance by increasing our emphasis on quality and reliability measure of the JDPA residential study tree trimming and developing a new strategy to address of electric utilities. As described on page 15, our service momentary outages. territory was hit last spring by a number of unusually strong 19
- 22. COMMITTED TO CUSTOMERS WE STRIVE TO MAKE OUR CUSTOMERS’ LIVES MORE COMFORTABLE, PRODUCTIVE AND ENJOYABLE During 2004, we placed a heightened emphasis on increasing customer satisfaction in Pipelines and Field Services. The results of the independent Mastio Customer Satisfaction Survey showed significant improvements for both our interstate pipelines, CenterPoint Energy Gas Transmission Company (CEGT) and CenterPoint Energy- Mississippi River Transmission Corporation (MRT). Both pipelines were ranked in the top quartile, with MRT ranking third out of 42 pipelines in the Overall Satisfaction Index and CEGT ranking eighth. A Field Services survey also showed us with high marks for service, with 73 percent of our customers rating us either above average or excellent in CenterPoint Energy natural gas customers such as Ed Lowe meeting their expectations. When asked how well our serv- enjoy backyard grilling with family and friends. ices are adding value to their business versus expectations, 94 percent said we met or exceeded their expectations.
- 23. I N S U M M A RY: E X E C U T I N G O U R C O R P O R AT E S T R AT E G Y When CenterPoint Energy was created a little more than two • We implemented training and reporting tools to years ago, we outlined our strategy of One Company, improve internal controls and support Sarbanes-Oxley Get it Right and Grow. Our successes in 2004 include: Act compliance. • We expanded our joint trenching program, resulting in additional cost reductions. One Company • We implemented a common computer network and • We helped implement an automated move-in/move-out work order processing system across our gas process for electric customers. distribution businesses. • We installed design software that provides savings in • We held employee conferences to improve commun- overhead and underground electric line construction. ication between executives and front-line employees. • We cut in half the prep time for building new electric • We launched CNP University, providing employees access service to subdivisions. to career development resources and opportunities. • We stopped using our heritage names, Arkla, Entex Grow and Minnegasco. • We added more than 91,000 new metered customers. • We launched our “On the Spot” ad campaign, leveraging • We expanded wholesale gas capabilities in the Midwest. safety, marketing and service messages to define • We began an open access program to move qualified CenterPoint Energy to customers. commercial and industrial gas distribution customers from distribution rates to transportation rates. • We increased CenterPoint Energy Gas Services Get It Right • We completed a major restructuring program in our retail sales and sales to electric and gas utilities. southern gas operations, estimated to save $10 million • We expanded the Pipeline Group’s gas gathering system. annually beginning in 2005. • We launched pipeline and gas storage expansions. • We initiated rate relief proceedings in several jurisdictions (see pages 10-11 for details). 21
- 24. COMMITTED TO EMPLOYEES Top photo from left, Leah Kasparek and H.O. Clarke Service Area Manager, Marie Bogan listen as Lineman Carlos Pereda recounts experiences on the job in Houston. Inset photo: Human Resources employees, from left, Alice Otchere, Director; Dinny Tan, Payroll Tax Accountant; Patricia Frank, Director; Ira Winsten, Director; Anthony Serrato, Labor Relations Manager; and Myrna Saavedra-Flores, Executive Secretary, discuss employee health plans.
- 25. WE WORK HARD FOR OUR E M P L O Y E E S ’ H E A LT H , W E L L - B E I N G AND OVERALL DEVELOPMENT “For a forest to be green, each tree must be green .” Competitive Compensation – – Maharishi Mahesh Yogi incentives, rewards and benefits CenterPoint Energy strives to attract, motivate and retain employees by offering competitive pay and benefits. In CenterPoint Energy’s employees are the source of our addition to base pay, employees may receive awards for success. They operate and maintain our energy delivery exceptional performance and annual short-term incentives infrastructure. They work to satisfy our customers’ energy for their role in achieving company goals. These objectives, needs, whether on the front lines or in the back offices. They which are tailored for each of our business units, focus procure materials, process invoices and perform all the on areas such as financial performance, safety, system functions necessary and vital to our business. They lead the reliability and customer satisfaction. Tied to overall company way in delivering energy to our customers, volunteer service performance, the measures determine if employee bonuses to our communities and earnings to our shareholders. are paid. Bonuses are paid only if the company’s dividends are paid at least at the previous year’s level. Bonuses were Safety – our priority paid to employees in 2004. Our first commitment to our employees is to keep them safe. We provide our employees safety training, wellness Employees may also choose from an array of flexible information, health and safety updates, and safety policies benefits to select the medical, dental and vision plans and practices. Our leadership attends safety meetings, and that are right for them and their families. Our employee individual managers and supervisors conduct and document assistance program provides confidential counseling, legal periodic on-site safety inspections. Safety initiatives and help and financial services. training, such as our online safety training Web sites, are regularly updated to help improve the safety of our In addition to a company-funded pension plan, employees employees. We track vehicular incident and lost time may contribute a portion of their pay to a 401(k) savings incident rates and other measures to assess progress toward plan. Employees are immediately vested in the plan, to our goal of first quartile safety performance in our industry. 23
- 26. COMMITTED TO EMPLOYEES Customer Service Advisors and Representatives in Houston, from left, Carlos Bueno, Angie Ray, Dianna Ford, Gloria Pinnekins and Anna Nelson. which the company makes a matching contribution based Our management team is carefully reviewing the suggestions on a portion of eligible pay. When qualified employees retire, made by employees and will develop and implement plans they receive credits based on their years of service to help to make the suggested changes. them pay for medical and dental coverage. Employee Development – Employee Surveys – every opinion counts building a world-class workforce We recognize the critical role employees play in ensuring The survey highlighted our employees’ continued belief in CenterPoint Energy’s success, so we conduct an employee the importance of career growth and development opportu- survey every 18 months to ask how we are doing. In 2004, nities. Company management agrees and has made developing we conducted the second CenterPoint Energy Employee employee skills a key element of our corporate strategy. Survey based on a set of questions the Hay Group developed specifically for CenterPoint Energy. The survey allows We took a major step toward improving employee us to compare our work environment to 300 other development in 2004 by creating CNP University, an online companies and gives us an indication of how employees resource of virtual and classroom training opportunities think we can improve. and helpful materials. In addition to a core curriculum of required training on CenterPoint Energy values, ethics and The 2004 survey showed high employee satisfaction overall regulatory compliance issues, employees can access three and provided both positive feedback and opportunities for Schools of Excellence: leadership, business excellence and further improvement in the company. The survey also personal effectiveness. Services offered include assessments indicated that employees understand and support the and team-building for workgroups at on-site training facilities company’s goals, and they believe they can make meaning- and a library of books, videos and other media. ful contributions to achieving them. Our employees are focused on our customers and are proud of the quality of service the company provides.
- 27. O U R E M P L O Y E E S L E A D T H E WAY I N D E L I V E R I N G E N E R G Y TO OUR CUSTOMERS, VOLUNTEER SERVICE TO OUR C O M M U N I T I E S A N D VA L U E T O O U R S H A R E H O L D E R S Dorothy Rodgers is a Measurement Analyst in Shreveport, La. Dick Walker, Gathering Technician, works in Waskom, La. Ray Robbins, Gathering Technician, stays in touch at the Sligo Plant in Haughton, La. Glenn Lea is a Construction CenterPoint Energy’s employees are also committed to each & Maintenance Technician other. As one generation of leaders prepares for retirement, in New Braunfels, Texas. it must transfer knowledge to help develop our leaders of tomorrow. Even after leaving their day-to-day employment at the company, our commitment to employees continues, as our retirement and savings plans show. In 2004, the company reaffirmed that commitment by contributing $476 million to the pension plan. In addition to benefiting both current and retired employees, this move added $350 million to shareholders’ equity in 2004. 25
- 28. COMMITTED TO COMMUNITY Clockwise from top left, Adrian Moreno, Service Consultant, and Donna Novak, Field Service Representative, repair a home in Houston; inset: Volunteers clear away debris during a “Trash Bash” clean-up near Galveston, Texas; and, at left, Janie Norton and Julie Beitler, Engineering Systems, help restore native plants at the Dakota Peak Shaving Station in Minnesota.
- 29. WE ROLL UP OUR SLEEVES TO HELP OUR NEIGHBORS IN THE MANY C O M M U N I T I E S W E S E RV E Respect for our communities is one of CenterPoint Energy’s Pancake Supper to help fund eye care and educational core values. Our employees take the initiative to make a dif- summer camps. In Brazoria County, Texas, employees held ference in other people’s lives through volunteer efforts, with a holiday gift drive for disadvantaged children. In Minnesota, a special focus on education and economic development. employees raised more than $6,000 for the Food Share program – enough to feed 318 families of four for a week by selling 6,000 flowers. Food Share purchases supplies in Employee Giving – meeting community needs CenterPoint Energy employees volunteered 95,508 hours in bulk, and every dollar raised buys eight pounds of food. 2004 at corporate-sponsored walkathons, food and blood drives, fundraising events and independent initiatives. Based on a standard volunteer rate of $17.19 per hour, this represents $1.6 million in benefits to our communities. Our company and employees also made more than $2 million in direct cash contributions to support 85 United Way agencies across our service areas. Contributions by our Houston employees placed us among the top 10 givers in Houston. Also in the Houston area, the MS150 bicycle team had a record 100 plus riders and raised more than $65,000 for the fight against multiple sclerosis. In Oklahoma, employees raised thousands of dollars for the American Cancer Society Relay for Life. In Batesville, Ark., employees participated in the Special Olympics Master’s Jina Faith, valedictorian at Chavez High School gets Fun Day. Employees from Alice and Kingsville, Texas, flipped pointers from Ben Carranza, Senior Engineer, H.O. 600 flapjacks at the Premont Lion’s Club’s 51st Annual Clarke Service Center in Houston. 27
- 30. COMMITTED TO COMMUNITY nonprofit organizations to share strategies for managing Community Partnerships – building for tomorrow We live, work, worship and play in the communities we political, social, economic and technological challenges for serve. We partner with organizations to make the community the improvement of life in our communities. a better place. We provide sponsorships, grants and assistance for education, economic development and family Supporting Education – helping young minds grow programs. We also support the use and development of CenterPoint Energy knows knowledge is power. In 2004, minority and women-owned business enterprises, and in employees in our speaker’s bureau made 574 speeches to a 2004, spending with these diverse suppliers was nearly 12 combined audience of 18,638 people. The Electric Universe percent of our total qualified procurement dollars, excluding and Energy Underground Web sites are popular resources fuel and certain other expenses. Additionally, our economic for teachers and students. We sponsor or support education development department worked with 16 companies to expand or relocate to our Houston service area, bringing 2,251 new jobs and adding $6 billion to the area’s economy. Our employees in Houston and Minnesota have partnered with Habitat for Humanity for 15 and 12 years, respectively, building homes for those in need. In June, more than 125 employees and retirees in Minnesota spent a week siding, insulating and building a home in Anoka. In Houston, we received the Texas Public Relations Association’s Silver Spur Award for our partnership with the University of Houston in presenting the Power Tools for Nonprofits Conference. Over the past 11 years, this annual event has Amanda Newsome, left, Employee Service brought together more than 6,200 professionals from 2,600 Specialist, and Lena Clark, Project Manager, walked for the United Negro College Fund.
- 31. W E S U P P O R T E D U C AT I O N A L A N D E N V I R O N M E N TA L EFFORTS THROUGHOUT THE COMMUNITIES WHERE WE PROVIDE SERVICE efforts such as the Houston Hispanic Forum’s Career and communities where we live. Several organizations recognized Education Day, Junior Achievement and National Scholars us in 2004 for the work we have done to preserve our Initiative. The Houston Independent School District environment. In Minnesota, employees are helping restore recognized our 24-year partnership with the district by indigenous species of plants at the Dakota Peak Shaving inducting CenterPoint Energy into the HISD Hall of Fame. Station in the Minnesota River Valley. In Mississippi, the Ridgeland Chamber of Commerce “Trees make our communities more livable,” wrote The recognized district manager Tina Lakey for her work with National Arbor Day Foundation when it named CenterPoint the Junior Diplomat program, which prepares future leaders. Energy a Tree Line USA Utility in recognition of our “national Stuart Mouton, a senior service technician in Abbeville, La., leadership in caring for trees while meeting service taught fourth graders that recognizing the odor of natural objectives.” Tree Line USA is sponsored in cooperation with gas could save their lives. the National Association of State Foresters. CenterPoint Energy’s sense of community stretches beyond CenterPoint Energy received the Mayor’s Proud Partners our service territory. Our company and employees donated award from Houston Mayor Bill White and the Keep $135,000 to aid tsunami victims in southeast Asia. Our Houston Beautiful program after our volunteers helped employees spent weeks away from home helping restore remove 11 tons of trash from a two-plus mile stretch of power to hurricane-ravaged Florida and Alabama. And the Galveston Bay shoreline. children of the Destino del Reino orphanage in Honduras will remember their CenterPoint Energy friends who built The National Pollution Prevention Roundtable presented the power lines that brought them electricity. CenterPoint Energy’s ENERGY STAR program a national award for helping prevent pollution through the construction of more energy efficient homes. Caring for the environment CenterPoint Energy cares about the environment in the 29
- 32. BOARD OF DIRECTORS Left to Right: Michael E. Shannon, Robert T. O’Connell, O. Holcombe Crosswell, David M. McClanahan, Milton Carroll, John T. Cater, Thomas F. Madison and Derrill Cody. Milton Carroll, 54, is Chairman of the Board. He is also Minnesota Mutual Life Insurance Company. He has been a Chairman and founder of Instrument Products, Inc., an oilfield CenterPoint Energy board member since 2003. He serves on the equipment manufacturing company in Houston. He has been a Audit and Compensation Committees. board member of CenterPoint Energy and its predecessor compa- nies since 1992. He is Chairman of the Governance Committee and David M. McClanahan, 55, is President and Chief Executive also serves on the Compensation Committee. Officer of CenterPoint Energy. He has been a member of the Board of Directors since 2002. John T. Cater, 69, is a private investor and former Chairman of Compass Bank – Houston. He has been a board member of Michael E. Shannon, 68, is President of MEShannon & CenterPoint Energy and its predecessor companies since 1983. He Associates, Inc., a corporate financial advisory services and is the Chairman of the Compensation Committee and also serves investments company in Houston. He served as Chairman of on the Finance and Governance Committees. the Board and Chief Administrative and Financial Officer of Ecolab, Inc., a Fortune 500 specialty chemical company. He has Derrill Cody, 66, is presently of counsel to the law firm of been a CenterPoint Energy board member since 2003. He is the McKinney & Stringer, P.C. in Oklahoma City, Okla. He is a former Chairman of the Audit Committee and also serves on the Executive Vice President of Texas Eastern Corporation and Finance Committee. Chairman and Chief Executive Officer of Texas Eastern Gas Pipeline Company. He has been a CenterPoint Energy board Robert T. O’Connell, 66, is a business consultant focusing on member since 2003. He serves on the Audit, Compensation and financial, strategic and business development matters. He is Governance Committees. a board member of Commonwealth Corporation and a member of the Boston Finance Commission, two Massachusetts public O. Holcombe Crosswell, 64, is President of Griggs Corporation, service entities. He previously served as a director of a real estate and investment company in Houston. He has been RWD Technologies, Inc.; as Senior Vice President and a board member of CenterPoint Energy and its predecessor Chief Staff Officer of EMC Corporation; as Chief Financial companies since 1997. He is Chairman of the Finance Committee Officer of General Motors Corporation and as Chairman of and also serves on the Audit Committee. General Motors Acceptance Corporation. He has been a CenterPoint Energy board member since 2004 and serves on Thomas F. Madison, 69, is President and Chief Executive Officer the Audit and Finance Committees. of MLM Partners, a small business consulting and investments company in Minneapolis, Minn. He is a former President of US West Communications – Markets and served as Vice Chairman of
- 33. OFFICERS Left to Right: Dean Liollio, Preston Johnson, Georgianna Nichols, Gary Whitlock, Byron Kelley, David McClanahan, Tom Standish, Scott Rozzell, Gary Cerny and Wayne Stinnett. Executive Committee Business Unit Leadership David M. McClanahan, 55 Walter L. Fitzgerald, 47 Gary M. Cerny, 49 President Vice President Division President and Chief Executive Officer and Controller and Chief Operating Officer CenterPoint Energy Scott E. Rozzell, 56 Carol R. Helliker, 44 Minnesota Gas Executive Vice President, Vice President, General Counsel Corporate Compliance Officer Byron R. Kelley, 57 * and Corporate Secretary and Associate General Counsel Group President and Chief Operating Officer Gary L. Whitlock, 55 Marc Kilbride, 52 CenterPoint Energy Pipelines, Executive Vice President Vice President Pipeline Services and and Chief Financial Officer and Treasurer Field Services Floyd J. LeBlanc, 45 Constantine S. Liollio, 46 Vice President Division President Other Corporate Officers Corporate Communications and Chief Operating Officer James S. Brian, 57 CenterPoint Energy Senior Vice President Joseph B. McGoldrick, 51 Southern Gas Operations and Chief Accounting Officer Vice President Strategic Planning Georgianna E. Nichols, 56 Preston Johnson, Jr., 49 Division President Senior Vice President Rufus S. Scott, 61 and Chief Operating Officer Human Resources and Vice President, CenterPoint Energy Houston Gas Shared Services Deputy General Counsel and Assistant Corporate Secretary Thomas R. Standish, 55 * Jeff W. Bonham, 42 Group President and Vice President William J. Starr, 51 Chief Operating Officer Government Relations Vice President CenterPoint Energy Tax Houston Electric & Brenda S. Cauthen, 43 Information Technology Vice President Audit Services Wayne D. Stinnett, 54 Division Senior Vice President CenterPoint Energy Gas Services * Also Corporate Officers (Senior Vice President) 31
- 34. F I N A N C I A L I N F O R M AT I O N The accompanying financial information regarding CenterPoint Energy and its subsidiaries should be read in conjunction with the company’s consolidated financial statements as well as the management’s discussion and analysis of financial condition and results of operations, which are presented in the company’s 2004 Annual Report on Form 10-K. Investors may request, without charge, the company’s Annual Report on Form 10-K for the year ended Dec. 31, 2004, by writing or calling CenterPoint Energy Investor Services at 1-888-468-3020. Additional investor information can be found on the inside back cover of this report and on our Web site, www.CenterPointEnergy.com/investors. TABLE OF CONTENTS Selected Financial Data 33 Condensed Statements of Consolidated Operations 35 Condensed Statements of Consolidated Comprehensive Income 36 Condensed Consolidated Balance Sheets 37 Condensed Statements of Consolidated Cash Flows 38 Condensed Statements of Consolidated Shareholders’ Equity 39 Investor Information Inside Back Cover
- 35. S E L E C T E D F I N A N C I A L D ATA Year Ended December 31, 2000 2001(1) 2002 2003(2) 2004(3) (In millions, except per share amounts) Revenues $ 6,949 $ 7,148 $ 6,438 $ 7,790 $ 8,510 Income from continuing operations before extraordinary loss and cumulative effect of accounting change 52 357 482 409 205 Discontinued operations, net of tax 395 565 (4,402) 75 (133) Extraordinary loss, net of tax — — — — (977) Cumulative effect of accounting change, net of tax — 58 — — — Net income (loss) attributable to common shareholders $ 447 $ 980 $ (3,920) $ 484 $ (905) Basic earnings (loss) per common share: Income from continuing operations before extraordinary loss and cumulative effect of accounting change $ 0.18 $ 1.23 $ 1.62 $ 1.35 $ 0.67 Discontinued operations, net of tax 1.39 1.95 (14.78) 0.24 (0.43) Extraordinary loss, net of tax — — — — (3.18) Cumulative effect of accounting change, net of tax — 0.20 — — — Basic earnings (loss) per common share $ 1.57 $ 3.38 $ (13.16) $ 1.59 $ (2.94) Diluted earnings (loss) per common share: Income from continuing operations before extraordinary loss and cumulative effect of accounting change $ 0.18 $ 1.22 $ 1.61 $ 1.24 $ 0.61 Discontinued operations, net of tax 1.38 1.93 (14.69) 0.22 (0.37) Extraordinary loss, net of tax — — — — (2.72) Cumulative effect of accounting change, net of tax — 0.20 — — — Diluted earnings (loss) per common share $ 1.56 $ 3.35 $ (13.08) $ 1.46 $ (2.48) Cash dividends paid per common share $ 1.50 $ 1.50 $ 1.07 $ 0.40 $ 0.40 Dividend payout ratio from continuing operations 833% 122% 66% 30% 60% Return from continuing operations on average common equity 1.0% 5.8% 11.8% 25.7% 14.4% Ratio of earnings from continuing operations to fixed charges 1.39 1.99 2.03 1.81 1.43 33
- 36. Year Ended December 31, 2000 2001 (1) 2002 2003(2) 2004(3) (In millions, except per share amounts) At year-end: Book value per common share $ 19.10 $ 22.77 $ 4.74 $ 5.77 $ 3.59 Market price per common share 43.31 26.52 8.01 9.69 11.30 Market price as a percent of book value 227% 116% 169% 168% 315% Assets of discontinued operations $ 18,479 $ 16,840 $ 4,594 $ 4,244 $ 1,565 Total assets 35,936 32,020 20,635 21,461 18,162 Short-term borrowings 4,799 3,469 347 63 — Long-term debt obligations, including current maturities 4,989 4,712 9,996 10,939 9,029 Trust preferred securities(4) 705 706 706 — — Cumulative preferred stock 10 — — — — Capitalization: Common stock equity 49% 55% 12% 14% 11% Trust preferred securities 6% 6% 6% — — Long-term debt, including current maturities 45% 39% 82% 86% 89% Capital expenditures, excluding discontinued operations $ 653 $ 802 $ 566 $ 497 $ 530 (1) 2001 net income includes the cumulative effect of an accounting change resulting from the adoption of SFAS No. 133, “Accounting for Derivative Instruments and Hedging Activities” ($58 million after-tax gain, or $0.20 earnings per basic and diluted share). For additional information related to the cumulative effect of accounting change, please read Note 5 to our consolidated financial statements. (2) 2003 net income includes the cumulative effect of an accounting change resulting from the adoption of SFAS No. 143, “Accounting for Asset Retirement Obligations” ($80 million after-tax gain, or $0.26 and $0.24 earnings per basic and diluted share, respectively), which is included in discontinued operations related to Texas Genco. (3) 2004 net income includes an after-tax extraordinary loss of $977 million ($3.18 and $2.72 loss per basic and diluted share, respectively) based on our analysis of the Texas Utility Commission’s deliberations in the 2004 True-Up Proceeding. Additionally, we recorded a net after-tax loss of approximately $133 million ($0.43 and $0.37 loss per basic and diluted share, respectively) in 2004 related to our interest in Texas Genco. For more information on these and other matters currently affecting us, please see “Management’s Discussion and Analysis of Financial Condition and Results of Operations — Executive Summary — Significant Events in 2005” in our 2004 Form 10-K. (4) The subsidiary trusts that issued trust preferred securities have been deconsolidated as a result of the adoption of FIN 46 “Consolidation of Variable Interest Entities, an Interpretation of Accounting Research Bulletin No. 51” (FIN 46) and the subordinated debentures issued to those trusts are now reported as long-term debt effective December 31, 2003. For additional information related to the adoption of FIN 46, please read Note 2(n) to our consolidated financial statements.
- 37. C O N D E N S E D S TAT E M E N T S O F C O N S O L I D AT E D O P E R AT I O N S Year Ended December 31, 2002 2003 2004 (In thousands, except per share amounts) $ 6,437,505 $ 7,789,681 $ 8,510,428 Revenues Expenses: Natural gas 2,953,871 4,297,914 5,524,451 Other operating expenses 1,586,283 1,670,783 1,632,540 Depreciation and amortization 457,608 465,571 489,642 Total 4,997,762 6,434,268 7,646,633 1,439,743 1,355,413 863,795 Operating Income (685,534) (741,578) (519,774) Other Income (Expense) Income From Continuing Operations Before Income Taxes and 754,209 613,835 344,021 Extraordinary Loss Income Tax Expense (272,246) (205,064) (138,306) 481,963 408,771 205,715 Income From Continuing Operations Before Extraordinary Loss (4,402,197) 74,896 (133,083) Discontinued Operations, net of tax (3,920,234) 483,667 72,632 Income (Loss) Before Extraordinary Loss Extraordinary Loss, net of tax — — (977,336) $ (3,920,234) $ 483,667 $ (904,704) Net Income (Loss) Basic Earnings Per Share: Income from Continuing Operations $ 1.62 $ 1.35 $ 0.67 Discontinued Operations, net of tax (14.78) 0.24 (0.43) Extraordinary Loss, net of tax — — (3.18) Net Income (Loss) $ (13.16) $ 1.59 $ (2.94) Diluted Earnings Per Share: Income from Continuing Operations $ 1.61 $ 1.24 $ 0.61 Discontinued Operations, net of tax (14.69) 0.22 (0.37) Extraordinary Loss, net of tax — — (2.72) Net Income (Loss) $ (13.08) $ 1.46 $ (2.48) See Notes to the Consolidated Financial Statements in the Company’s Form 10-K. 35
- 38. C O N D E N S E D S TAT E M E N T S O F C O N S O L I D AT E D C O M P R E H E N S I V E I N C O M E Year Ended December 31, 2002 2003 2004 (In thousands of dollars) Net income (loss) $(3,920,234) $ 483,667 $ (904,704) Other comprehensive income (loss), net of tax: Minimum pension liability adjustment (414,254) 47,296 366,594 Other comprehensive income (loss) from continuing operations (29,910) 30,988 (16,316) Other comprehensive income (loss) from discontinued operations 161,176 680 (3,573) Other comprehensive income (loss) (282,988) 78,964 346,705 Comprehensive income (loss) $(4,203,222) $ 562,631 $ (557,999) See Notes to the Consolidated Financial Statements in the Company’s Form 10-K.
- 39. C O N D E N S E D C O N S O L I D AT E D B A L A N C E S H E E T S December 31, 2003 2004 (In thousands) ASSETS Current Assets: Cash and cash equivalents $ 86,922 $ 164,645 Other current assets 1,967,944 2,158,111 Current assets of discontinued operations 301,765 513,768 Total current assets 2,356,631 2,836,524 8,084,924 8,186,393 Property, Plant and Equipment, net Other Assets: Goodwill, net 1,740,510 1,740,510 Regulatory assets 4,930,793 3,349,944 Other non-current assets 405,936 997,428 Non-current assets of discontinued operations 3,942,296 1,051,158 Total other assets 11,019,535 7,139,040 $ 21,461,090 $ 18,161,957 Total Assets LIABILITIES AND SHAREHOLDERS’ EQUITY Current Liabilities: Short-term borrowings and current portion of long-term debt $ 223,927 $ 1,835,988 Regulatory liabilities 186,239 225,158 Other current liabilities 1,794,936 2,677,080 Current liabilities of discontinued operations 332,125 448,974 Total current liabilities 2,537,227 5,187,200 Other Liabilities: Accumulated deferred income taxes and unamortized investment tax credits 2,292,263 2,468,833 Regulatory liabilities 1,358,030 1,081,370 Other non-current liabilities 1,278,646 705,643 Non-current liabilities of discontinued operations 1,277,760 420,393 Total other liabilities 6,206,699 4,676,239 10,777,934 7,193,016 Long-term Debt Commitments and Contingencies 178,673 — Minority Interest in Discontinued Operations 1,760,557 1,105,502 Shareholders’ Equity $ 21,461,090 $ 18,161,957 Total Liabilities and Shareholders’ Equity See Notes to the Consolidated Financial Statements in the Company’s Form 10-K. 37