This document analyzes the impact of climate change on food security in the East African Community (EAC) region using panel data analysis from 2000-2014. The study finds that food security in the EAC is negatively affected by increased temperatures. However, greater precipitation and increased areas of cereal crop cultivation can help ensure food security. Actions to mitigate global warming are important for the EAC countries to support economic, political, and social development in the region.
![Climate change and food security in
EAC region: a panel data analysis
Walaa Mahrous
Department of Political Science and Economics,
Cairo University Institute of African Researches and Studies, Giza, Egypt
Abstract
Purpose – This study aims to analyze the impact of global climate change on food security in the East
African Community (EAC) region, using panel data analysis for five countries, over 2000-2014.
Design/methodology/approach – The determinants of food security are expressed as a function of
rainfall, temperature, land area under cereal production, and population size. The paper used pooled fixed
effects to estimate the relationship among these variables.
Findings – Findings show that food security in EAC is adversely affected by temperature. However,
precipitation and increasing areas cultivated with cereal crops will be beneficial to ensure everyone’s food
security.
Originality/value – Actions for mitigating global warming are important for EAC to consolidate the
region’s economic, political and social development/stability.
Keywords Climate change, Panel data analysis, Food security, EAC
Paper type Research paper
1. Introduction
Putting an end to hunger and malnutrition is considered to be a serious challenge for
achieving sustainable development in developing countries. For instance, about 500 million
people who are food insecure are still in Africa and Southern Asia. In addition, a high
percentage of those people are directly or indirectly dependent on agriculture [Food and
Agriculture Organization of the United Nations (FAO), 2015].
The Intergovernmental Panel on Climate Change (IPCC), in its fifth assessment report,
remarks that climate change is negatively affecting crops, livestock, and fisheries. Also,
climatic variability is threatening the agriculture sector and food security through the loss of
rural livelihoods, the loss of marine ecosystems, inland water ecosystems, and the
breakdown of food systems (IPCC, 2014). For example, disasters that hit tropical areas
destroy the stability and food security of communities living there. Therefore, these tropical
zones often witness food insecurity crises; especially that agriculture sector in these regions
employs from 30 to over 80 per cent of the population (FAO, 2015).
In the IPCC’s fourth assessment report, the agriculture sector in Africa was expected to
experience periods of prolonged droughts and floods. Consequently, there would be
reduction in the fertile agricultural land, expansion of arid/semi-arid land, and vast decrease
© Walaa Mahrous. Published in Review of Economics and Political Science. Published by Emerald
Publishing Limited. This article is published under the Creative Commons Attribution (CC BY 4.0)
licence. Anyone may reproduce, distribute, translate and create derivative works of this article (for
both commercial and non-commercial purposes), subject to full attribution to the original publication
and authors. The full terms of this licence may be seen at http://creativecommons.org/licences/by/4.0/
legalcode
REPS
4,4
270
Received 20 December 2018
Revised 27 April 2019
3 June 2019
Accepted 4 August 2019
Review of Economics and Political
Science
Vol. 4 No. 4, 2019
pp. 270-284
EmeraldPublishingLimited
2631-3561
DOI 10.1108/REPS-12-2018-0039
The current issue and full text archive of this journal is available on Emerald Insight at:
www.emeraldinsight.com/2631-3561.htm](https://image.slidesharecdn.com/1-211021075838/85/1-climate-change-and-food-security-in-eac-region-a-panel-data-analysis-1-320.jpg)
![Climate change and food security in
EAC region: a panel data analysis
Walaa Mahrous
Department of Political Science and Economics,
Cairo University Institute of African Researches and Studies, Giza, Egypt
Abstract
Purpose – This study aims to analyze the impact of global climate change on food security in the East
African Community (EAC) region, using panel data analysis for five countries, over 2000-2014.
Design/methodology/approach – The determinants of food security are expressed as a function of
rainfall, temperature, land area under cereal production, and population size. The paper used pooled fixed
effects to estimate the relationship among these variables.
Findings – Findings show that food security in EAC is adversely affected by temperature. However,
precipitation and increasing areas cultivated with cereal crops will be beneficial to ensure everyone’s food
security.
Originality/value – Actions for mitigating global warming are important for EAC to consolidate the
region’s economic, political and social development/stability.
Keywords Climate change, Panel data analysis, Food security, EAC
Paper type Research paper
1. Introduction
Putting an end to hunger and malnutrition is considered to be a serious challenge for
achieving sustainable development in developing countries. For instance, about 500 million
people who are food insecure are still in Africa and Southern Asia. In addition, a high
percentage of those people are directly or indirectly dependent on agriculture [Food and
Agriculture Organization of the United Nations (FAO), 2015].
The Intergovernmental Panel on Climate Change (IPCC), in its fifth assessment report,
remarks that climate change is negatively affecting crops, livestock, and fisheries. Also,
climatic variability is threatening the agriculture sector and food security through the loss of
rural livelihoods, the loss of marine ecosystems, inland water ecosystems, and the
breakdown of food systems (IPCC, 2014). For example, disasters that hit tropical areas
destroy the stability and food security of communities living there. Therefore, these tropical
zones often witness food insecurity crises; especially that agriculture sector in these regions
employs from 30 to over 80 per cent of the population (FAO, 2015).
In the IPCC’s fourth assessment report, the agriculture sector in Africa was expected to
experience periods of prolonged droughts and floods. Consequently, there would be
reduction in the fertile agricultural land, expansion of arid/semi-arid land, and vast decrease
© Walaa Mahrous. Published in Review of Economics and Political Science. Published by Emerald
Publishing Limited. This article is published under the Creative Commons Attribution (CC BY 4.0)
licence. Anyone may reproduce, distribute, translate and create derivative works of this article (for
both commercial and non-commercial purposes), subject to full attribution to the original publication
and authors. The full terms of this licence may be seen at http://creativecommons.org/licences/by/4.0/
legalcode
REPS
4,4
270
Received 20 December 2018
Revised 27 April 2019
3 June 2019
Accepted 4 August 2019
Review of Economics and Political
Science
Vol. 4 No. 4, 2019
pp. 270-284
EmeraldPublishingLimited
2631-3561
DOI 10.1108/REPS-12-2018-0039
The current issue and full text archive of this journal is available on Emerald Insight at:
www.emeraldinsight.com/2631-3561.htm](https://image.slidesharecdn.com/1-211021075838/75/1-climate-change-and-food-security-in-eac-region-a-panel-data-analysis-1-2048.jpg)
![in the productivity of fisheries (IPCC, 2007). In recent years, drought and elevated
temperatures, as evidence of climate change, have adversely affected all the agricultural
sub-sectors in the Horn of Africa and other African regions. As a result, estimates of the
prevalence of severe food insecurity in the whole African Region is increasing, particularly
for middle and eastern Africa (FAO, 2017).
With respect to FAO (1996), food security is attained when:
[. . .] all people, at all times, have physical and economic access to sufficient, safe and nutritious
food that meets their dietary needs and food preferences for an active and healthy life.
Thus, food security concept encompasses four main dimensions: food availability,
economical and physical accessibility, utilization and stability. Accordingly, not only
enough food being produced worldwide is needed but also everyone should have the ability
to timely get this food, in the proper quantity and quality.
The East African Community (EAC) is a regional intergovernmental organization of six
Partner States: Burundi, Kenya, Rwanda, South Sudan, Uganda and Tanzania. Through this
community, these members cooperate together in political, economic, and social fields. They
established a Customs Union in 2005, then a Common Market in 2010. In 2013, The East
African Monetary Union (EAMU) Protocol was signed and set the ground for a monetary
union within 10 years. Finally, in 2017, the EAC Heads of State agreed on reaching Political
Federation by carrying out the Political Confederation as a transitional phase (EAC, 2017).
In spite of having a big capacity to produce enough food for its population, the EAC
region frequently suffers from food shortages and hunger. There are a lot of factors that
stand behind such a critical state, such as:
prevalence of rain-fed farming systems;
inadequate food access among the vulnerable and poor population;
frequency and severity of global warming impacts on food production;
modest prices paid to food producers;
social unrest and political instability; and
poor technologies applied by farmers (EAC, 2011).
Still, empirical studies that assess impacts of global climate change on food security in
African regions like EAC are limited. Such research is needed by policy makers to design
agricultural policies that can adapt to climate change and ensure food security
simultaneously (Mendelsohn, 2009). Thus, this paper tries to estimate the relationship
between food production and different climate-change factors (namely precipitation and
temperature) in EAC States. It also tries to explore ways that enable the adaptation of
agriculture sector in these countries to climate change and mitigate the effect of this change
on food.
The rest of this study is organized as follows. Section 2 presents a literature review on the
various impacts of global warming on food security in both developed and developing
countries. Section 3 illustrates facts on relationship between climate change and food
security in EAC. Sections 4 and 5 show the methodology, data sources, and the diagnostic
tests used. Section 6 provides the empirical results. Finally, Section 7 concludes the paper.
2. Literature review
Recently, the impacts of climatic variability on food security have become debatable. Many
researchers have analyzed this relationship empirically and consequently mixed findings
Climate
change and
food security
271](https://image.slidesharecdn.com/1-211021075838/85/1-climate-change-and-food-security-in-eac-region-a-panel-data-analysis-2-320.jpg)
![increase in food prices, food insecurity, and sharp decline in economic growth [United
Nations Framework Convention on Climate Change (UNFCC), 2007]. Besides, scientists have
observed that the productivity of fisheries in the region has decreased over the past
200 years. This is due to climatic impact on lakes’ ecosystems that has caused a decline in
fish abundance in East African lakes (Roessig et al., 2004).
As climate change is threatening the quality and availability of the region’s resources, in
2010, EAC countries developed the EAC Climate Change Policy to guide their governments
and other concerned groups on adaptation and mitigation actions to address climate change.
This policy assured that goals of food security and economic development could not be
attained without considering mitigation and adaptation measures to climate change in the
area. Thus, with respect to adaptation, the policy focused on consolidating meteorological
services, developing early warning systems, improving irrigation and protecting vulnerable
ecosystems (such as wetlands, coastal, marine and forestry ecosystems). Concerning
mitigation measures included in this policy, they were as follows: increasing pro-
environmental energy resources, applying efficient crop and livestock production system,
capturing opportunities in emission reductions, and engaging in reforestation in the region
(EAC, 2010).
Moreover, the EAC countries tried in 2011 to achieve food security and rational
agricultural production across the region, by applying the EAC Agriculture and Rural
Development Policy. By focusing on increasing agricultural production, processing, storage
and marketing, this policy aims at eradicating poverty and ensuring food security within the
region (EAC, 2011).
In 2015-2016, Eastern Africa witnessed huge losses in the production of crops and
livestock as it was severely affected by El Niño–Southern Oscillation[1]. As a result, the
number of people suffering from undernourishment in the region increased from 121.4m to
132.2m; most of them were in Kenya and Uganda. In 2017, due to worsening climatic
conditions, eastern Kenya, South Sudan and Uganda were hit by recurrent drought that
destroyed major crops and raised food prices in these countries (FAO and ECA, 2018).
Subsequently, in June 2018, a meeting was held by the regional East African Climate Change
Technical Working Group, the GIZ Global Carbon Markets Programme, and the UNFCCC
Regional Collaboration Centre. This assembly discussed ways for funding climate change
mitigation and adaptation actions in EAC region, through global carbon markets and
climate finance agreements (Namande, 2018).
4. Empirical analysis
4.1 Empirical model
As previously illustrated in the literature review section, Badolo and Kinda (2014) has
succeeded in analyzing the causal relationship between climatic variability and food
security for 71 developing countries. Later on, some papers have adopted the same model to
study climate change impacts on food security in African countries (Kinda, 2017; Singh,
2018). However, the main shortage of this model is that it has not studied the four
dimensions of food security. This has been due to the limited availability of data that are
needed to compose food security index in developing countries.
Our paper has adopted the same framework, with some modifications in both dependent
and explanatory variables due to some data limitations[2]. Thus, the following single
multivariate equation is used to examine the relationship between food security in EAC and
both climatic and non-climatic factors over the period (2000-2014):
REPS
4,4
274](https://image.slidesharecdn.com/1-211021075838/85/1-climate-change-and-food-security-in-eac-region-a-panel-data-analysis-5-320.jpg)
![Yit ¼ ai þ b Xit þ «it (1)
With X it the matrix of explanatory variables (precipitation, temperature, population growth
and land under cereal production), in a country i at the period t. ai comprises unobserved
country-specific effects and «it is the error term. Yit is the food production index (FPI) as a
proxy for food security[3].
4.2 Data sources and variables description
The data range used in this paper starts from 2000 till 2014 for the five countries in EAC:
Burundi, Kenya, Rwanda, Tanzania and Uganda[4]. This data range has been chosen to get
balanced panel data for our model. The annual data on food production index, precipitation,
temperature, population growth and land under cereal production are obtained from Climate
Change Knowledge Portal and the World Development Indicators Database; both provided
by the World Bank (World Bank, 2018a, 2018b).
Food production index (FPI), by covering food crops that are edible and contain nutrients
[5], calculates the changes in the production of food in a given year relative to the base year
(Index Mundi, 2018). Population growth (PG) is the annual growth rate in population size
while land under cereal production (LC) is measured in hectares. With respect to climatic
factors, precipitation (Precipt) is measured in millimeter and temperature (Tempt) is
measured in Celsius degree centigrade[6]. Data on these variables are converted into natural
logarithms (except for PG) to facilitate the estimation procedure. The descriptive statistics,
mean value, standard deviation and coefficient of variation of these variables are given in
Table AI.
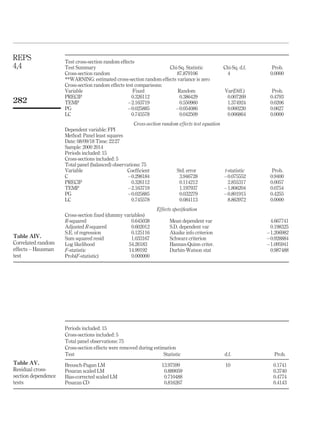
5. Post regression diagnostic tests
Our model has been estimated with EViews 10. Choice has been made among fixed effects
(FE) and random effects (RE); as they represent the two alternative methods in our case for
estimating static panel models. Tables AII and AIII show the results of each one of them. It
is worth noting that Pooled OLS method hasn’t been used as it does not account for the
unobserved heterogeneity of countries. On the other hand, FE (Table AII) and/or random
effects (Table AIII) estimators have successfully addressed this problem (Baltagi, 2005)[7].
Therefore, decision should be made whether to rely on FE method or RE method.
Accordingly, Hausman test has been used and it shows that the FE method is more suitable
than the random effect method for our model (Table AIV)[8].
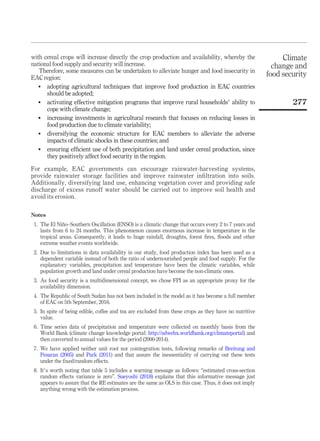
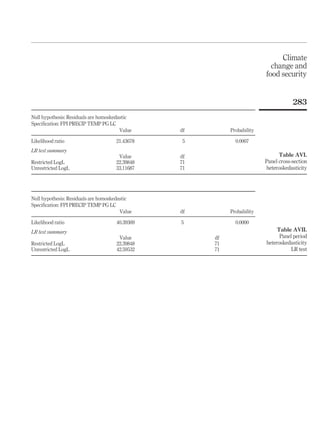
To identify the cross sectional independence in panel data set, Pesaran’s test shows that
there is no cross-section correlation in residuals of our model (Table AV). Also, Jarque-Bera
normality test assures the normality of errors at 5 per cent significance level (Figure 1). With
respect to serial correlation (autocorrelation), Durbin-Watson statistic value shows that
there is a first-order autocorrelation. Finally, Tables AVI and AVII show that the model
suffers from heteroskedasticity. So, to deal with the problems of heteroskedasticity and
serial correlation, White period method is used in re-estimating our FE regression model
(Table AVIII)[9].
6. Results
Table AVIII shows that climatic factors – compared to non-climatic factors – play major role
in determining food security in EAC region as both rainfall and temperature have
significant impact on our dependent variable while land under cereal production is the only
non-climatic variable that has a significant effect.
Climate
change and
food security
275](https://image.slidesharecdn.com/1-211021075838/85/1-climate-change-and-food-security-in-eac-region-a-panel-data-analysis-6-320.jpg)


![11.[21 29]the implications of climate change on food security and rural livel...](https://cdn.slidesharecdn.com/ss_thumbnails/11-21-29theimplicationsofclimatechangeonfoodsecurityandrurallivelihoods-120512235612-phpapp01-thumbnail.jpg?width=640&height=640&fit=bounds)


