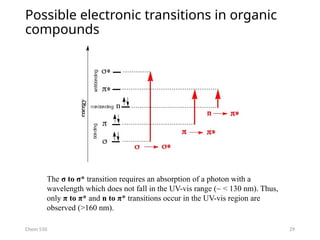
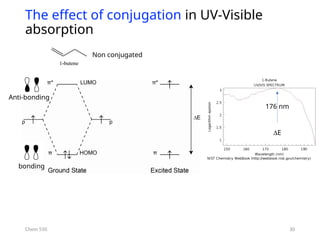
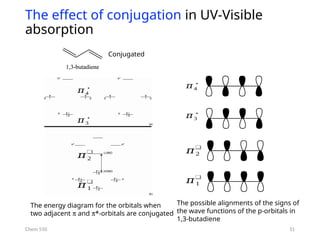
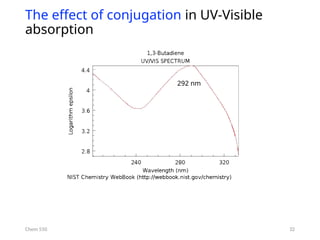
The document provides an overview of UV-Vis spectrophotometry principles, including the measurement of absorbance and transmittance, the application of Beer’s Law, and factors affecting absorbance like concentration and pathlength. It discusses deviations from Beer’s Law due to high concentrations, polychromatic radiation, and instrumental factors, while explaining the ideal conditions for accurate measurements. Additionally, it covers the interaction of electromagnetic radiation with matter, atomic versus molecular absorption, and the effects of conjugation on UV-visible absorption spectra.
![4
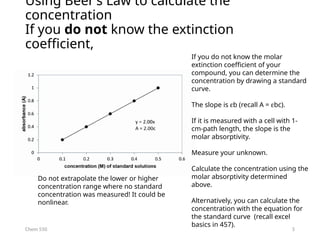
Using Beer’s Law to calculate the
concentration
If you know the extinction coefficient,
Chem 550
Figure 6.12 UV-vis spectrum of 1-10-phenanthroline-5,6-dione platinum(IV)
chloride [Pt(dione)Cl4] in dry acetonitrile.
Absorbance
A = 0.145
**290.5 nm seem to be a typo. It should be ~315 nm.
What is the concentration of the
compound? The path length of the cell
is 1 cm.](https://image.slidesharecdn.com/18-19uv-vismolecularabsorptionspectroscopy-240811110420-7fddf972/85/18-19_UV-Vis-Molecular-Absorption-Spectroscopy-pptx-4-320.jpg)