Download as DOCX, PPTX

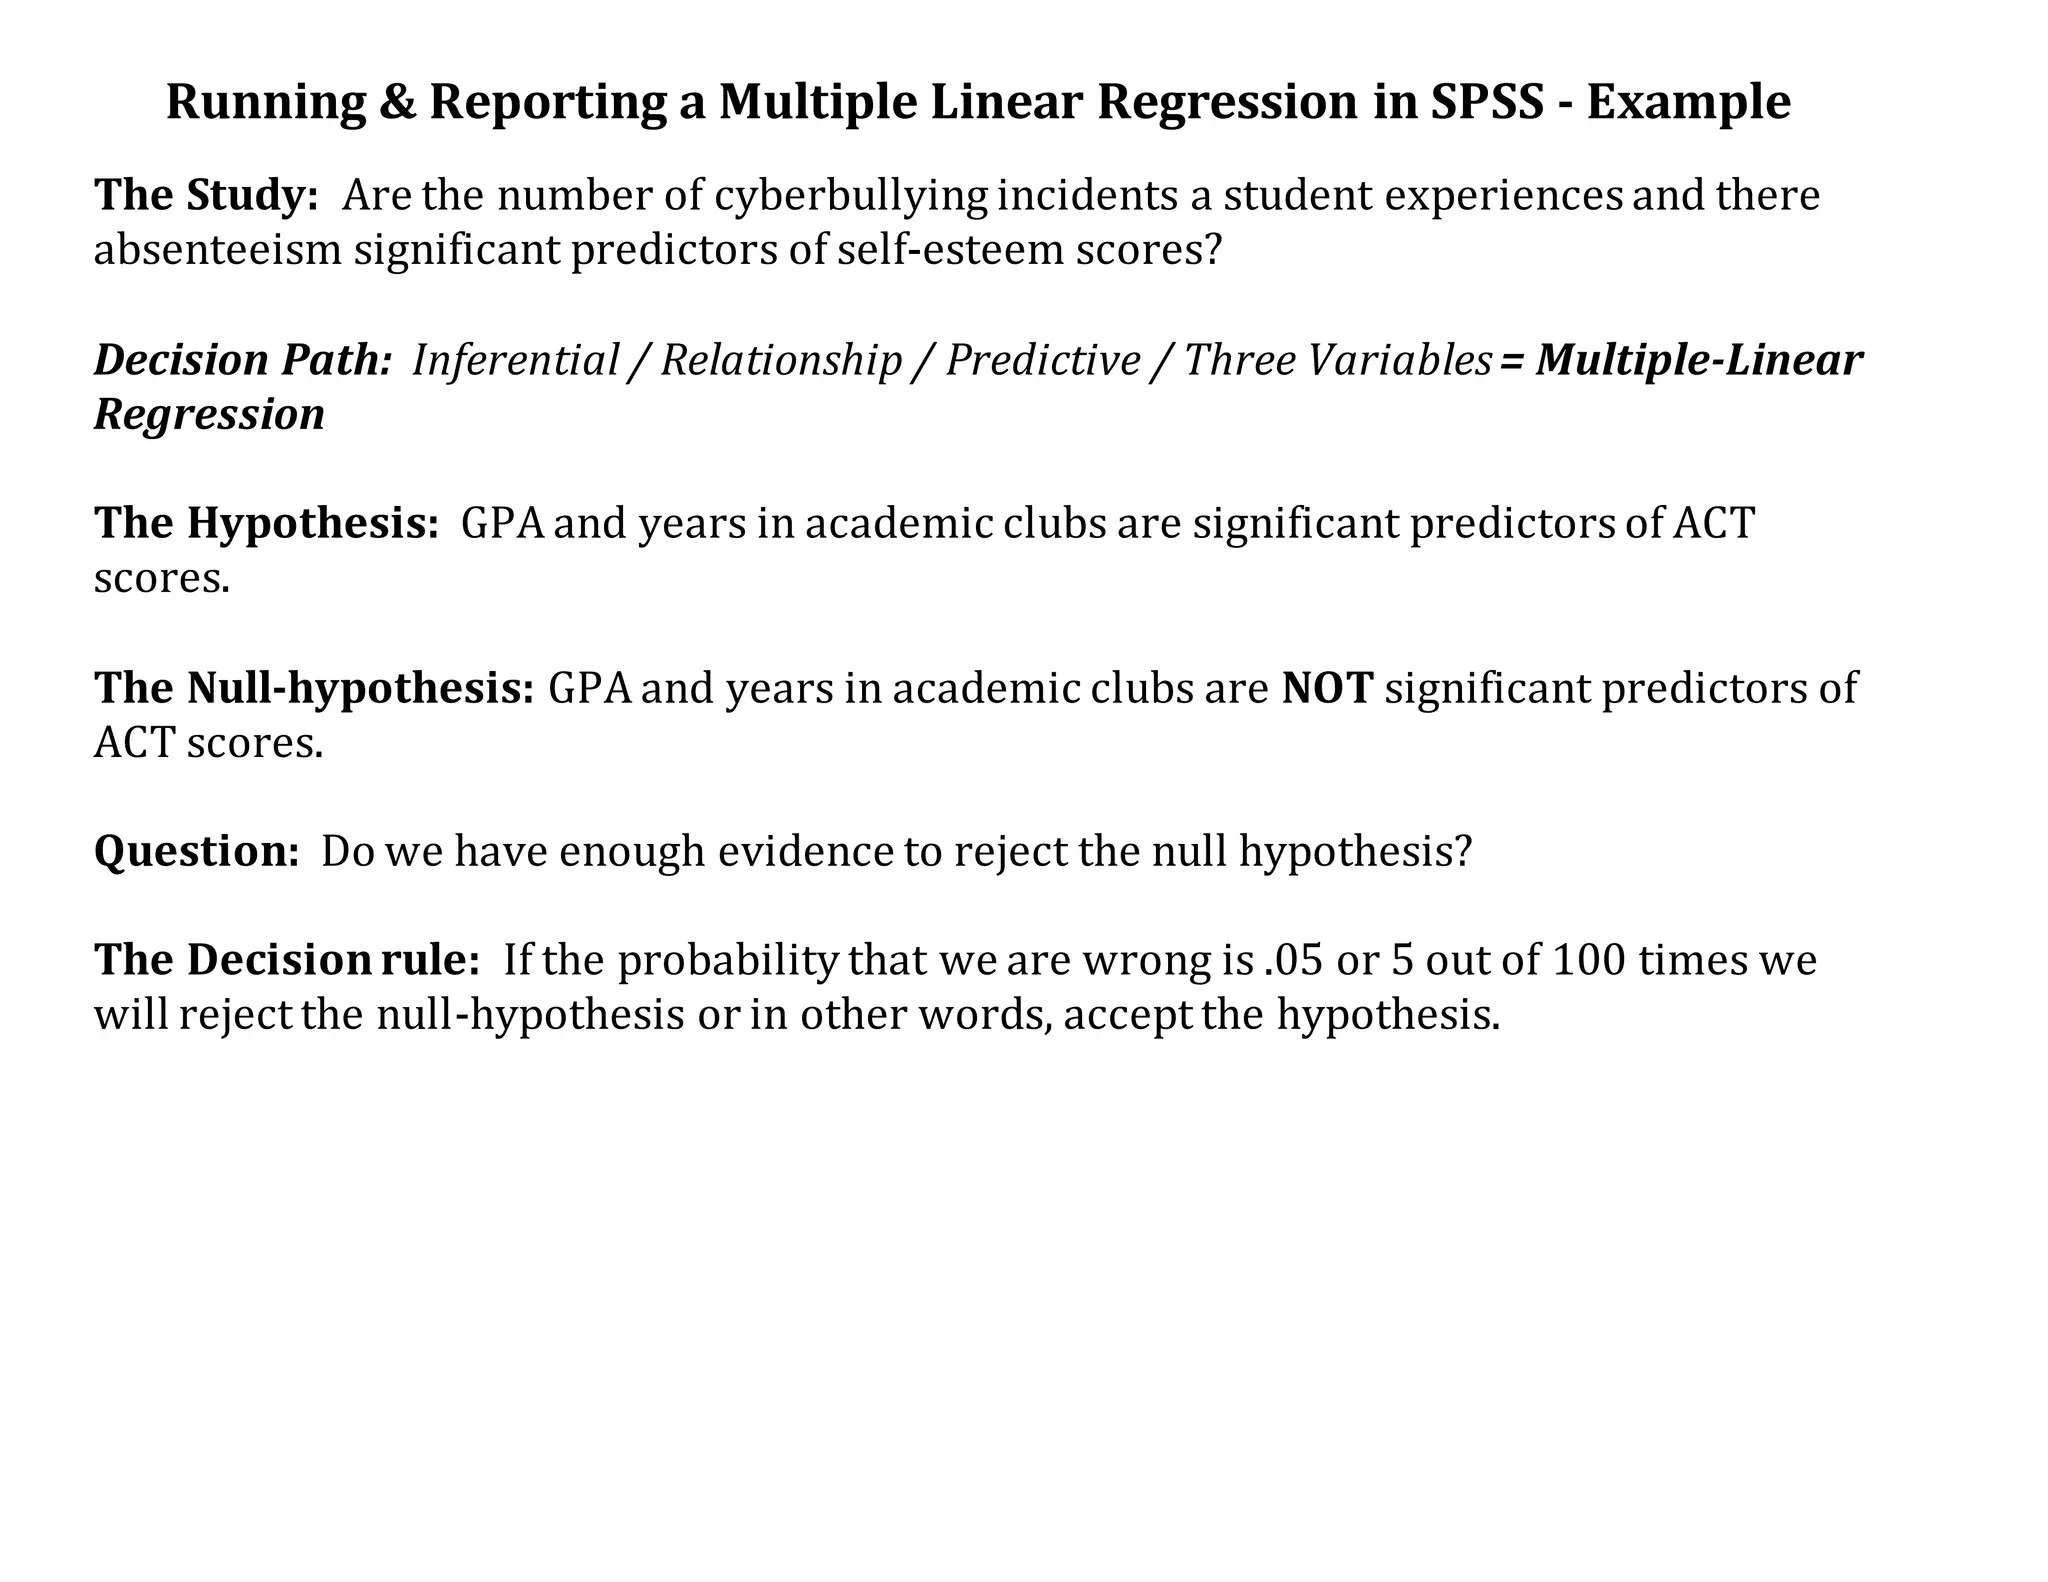
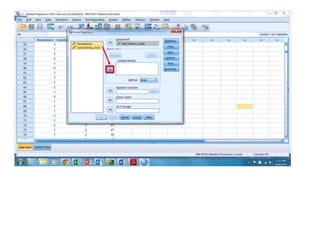
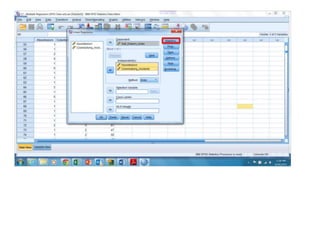
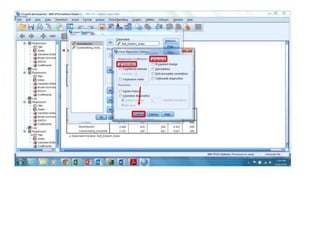
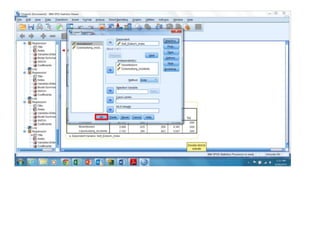
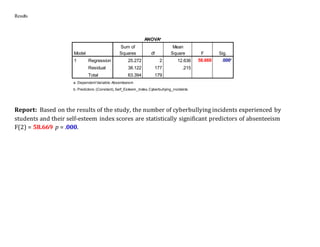
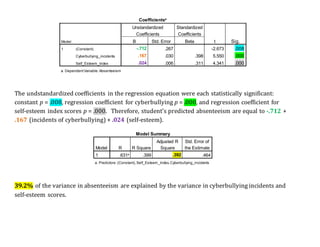
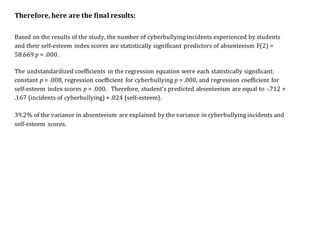

The document reports on a multiple linear regression analysis conducted in SPSS to determine if the number of cyberbullying incidents and self-esteem scores can predict absenteeism. The analysis found that both cyberbullying incidents and self-esteem scores were statistically significant predictors of absenteeism, explaining 39.2% of the variance. The regression equation for predicting absenteeism is: Predicted Absenteeism = -.712 + .167(Cyberbullying Incidents) + .024(Self-Esteem Score).


