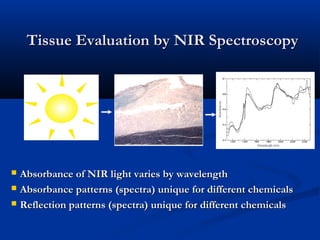
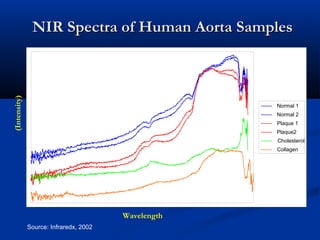
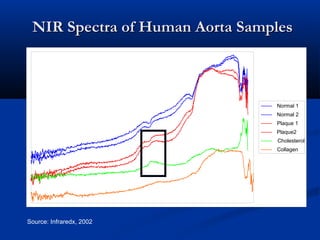
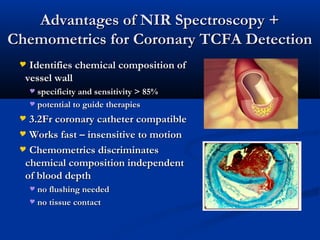
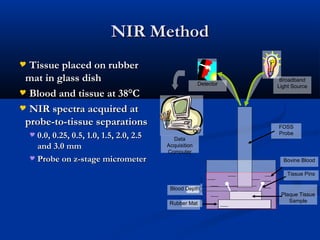
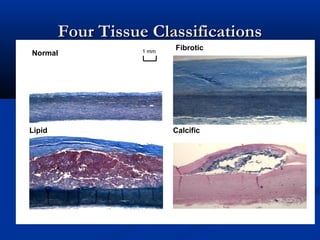
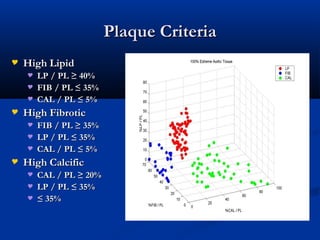
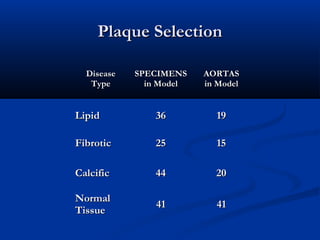
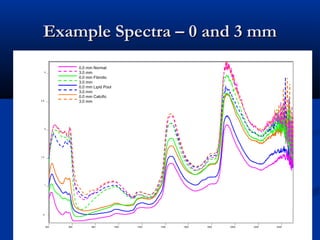
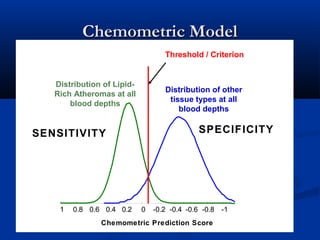
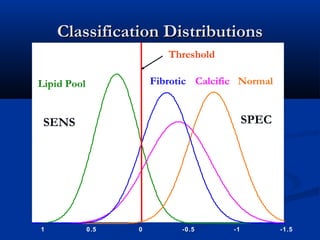
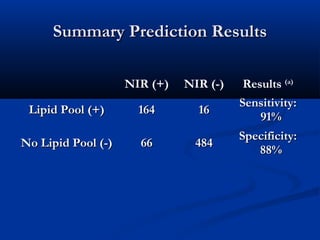
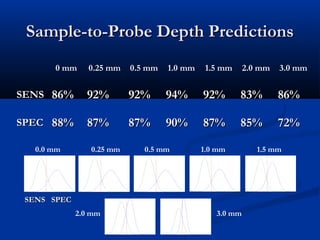
VP.Org
November 16, 2002
Mitchell W. Krucoff, MD, FACC
Associate Professor Medicine/Cardiology
Duke University Medical Center
Director, Interventional Devices Clincal Trials
Duke Clinical Research Institute
Discrimination of Ex Vivo Lipid-Discrimination of Ex Vivo Lipid-
Rich Plaques in Human AortaRich Plaques in Human Aorta
Specimens with NIR SpectroscopySpecimens with NIR Spectroscopy
through Whole Bloodthrough Whole Blood
B.Marshik, H.Tan, J.Tang, A. Zuluaga,B.Marshik, H.Tan, J.Tang, A. Zuluaga,
A. Lindquist, P.R.Moreno, K.R.Purushothaman,A. Lindquist, P.R.Moreno, K.R.Purushothaman,
W.O’Connor, G.TearneyW.O’Connor, G.Tearney
First results on freshFirst results on fresh
human tissue sampleshuman tissue samples
through variable depthsthrough variable depths
of bloodof blood
(updated from TCT 2002 poster)(updated from TCT 2002 poster)
Tissue Evaluation by NIR SpectroscopyTissue Evaluation by NIR Spectroscopy
 Absorbance of NIR light varies by wavelengthAbsorbance of NIR light varies by wavelength
 Absorbance patterns (spectra) unique for different chemicalsAbsorbance patterns (spectra) unique for different chemicals
 Reflection patterns (spectra) unique for different chemicalsReflection patterns (spectra) unique for different chemicals
NIR Spectra of Human Aorta SamplesNIR Spectra of Human Aorta Samples
Source: Infraredx, 2002
Normal 1
Normal 2
Plaque 1
Plaque2
Cholesterol
Collagen
Wavelength
(Intensity)
NIR Spectra of Human Aorta SamplesNIR Spectra of Human Aorta Samples
Source: Infraredx, 2002
Normal 1
Normal 2
Plaque 1
Plaque2
Cholesterol
Collagen
ChemometricsChemometrics
 Set of methods to predict chemical properties of unknownSet of methods to predict chemical properties of unknown
samples using spectroscopy and linear algebrasamples using spectroscopy and linear algebra
 Commonly used in pharmaceutical, chemical and foodCommonly used in pharmaceutical, chemical and food
processing; also being applied to glucose monitoringprocessing; also being applied to glucose monitoring
Advantages of NIR Spectroscopy +Advantages of NIR Spectroscopy +
Chemometrics for Coronary TCFA DetectionChemometrics for Coronary TCFA Detection
 Identifies chemical composition ofIdentifies chemical composition of
vessel wallvessel wall
 specificity and sensitivity > 85%specificity and sensitivity > 85%
 potential to guide therapiespotential to guide therapies
 3.2Fr coronary catheter compatible3.2Fr coronary catheter compatible
 Works fast – insensitive to motionWorks fast – insensitive to motion
 Chemometrics discriminatesChemometrics discriminates
chemical composition independentchemical composition independent
of blood depthof blood depth
 no flushing neededno flushing needed
 no tissue contactno tissue contact
Near Infrared (NIR) SpectroscopyNear Infrared (NIR) Spectroscopy
Previous ReportsPrevious Reports
1.1. Cassis, Lodder (1993)Cassis, Lodder (1993)
 Discrimination of lipid-filled and normal rat aorta tissue specimensDiscrimination of lipid-filled and normal rat aorta tissue specimens
2.2. Jaross (1999)Jaross (1999)
 Determined cholesterol content in human aorta tissue specimensDetermined cholesterol content in human aorta tissue specimens
3.3. Moreno (2002)Moreno (2002)
 Identified lipid pool, thin cap, and inflammatory cells in human aortaIdentified lipid pool, thin cap, and inflammatory cells in human aorta
tissue specimenstissue specimens
4.4. Wang (2002)Wang (2002)
 Analyzed lipid and protein content in carotid endarterectomy specimensAnalyzed lipid and protein content in carotid endarterectomy specimens
5.5. Neumeister, Jaross (2002)Neumeister, Jaross (2002)
 Determined cholesterol and collagen content in human aorta tissue withDetermined cholesterol and collagen content in human aorta tissue with
NIR spectroscopyNIR spectroscopy
 LimitationsLimitations: Not through blood, room temperature, fixed probe-target: Not through blood, room temperature, fixed probe-target
distance, tissue fixed or frozen/thawed (except Wang)distance, tissue fixed or frozen/thawed (except Wang)
Study PurposeStudy Purpose
NIR spectroscopy and chemometrics:NIR spectroscopy and chemometrics:
discriminate large lipid pool specimensdiscriminate large lipid pool specimens
from other tissue typesfrom other tissue types
using fresh human arterial tissueusing fresh human arterial tissue
through variable amounts of bloodthrough variable amounts of blood
InstrumentationInstrumentation
 FOSS NIRSystems Model 6500FOSS NIRSystems Model 6500
 ½” diameter fiber optic SmartProbe™½” diameter fiber optic SmartProbe™
 Central fiber delivery bundleCentral fiber delivery bundle
 Outer fiber collection bundleOuter fiber collection bundle
 Broad spectral range: 400 to 2500 nm.Broad spectral range: 400 to 2500 nm.
 Sixty seconds for spectral acquisitionSixty seconds for spectral acquisition
TissueTissue
 Human Aorta TissueHuman Aorta Tissue
 Aorta from 72 human subjects (avg age 69.6 ±12.8)Aorta from 72 human subjects (avg age 69.6 ±12.8)
 751 tissue specimens cut to 2x2 cm from diseased and751 tissue specimens cut to 2x2 cm from diseased and
non-diseased sitesnon-diseased sites
 Stored in phosphate buffered saline solutionStored in phosphate buffered saline solution
 Shipped on wet ice less then 24 hours after autopsyShipped on wet ice less then 24 hours after autopsy
NIR MethodNIR Method
 Tissue placed on rubberTissue placed on rubber
mat in glass dishmat in glass dish
 Blood and tissue at 38°CBlood and tissue at 38°C
 NIR spectra acquired atNIR spectra acquired at
probe-to-tissue separationsprobe-to-tissue separations
 0.0, 0.25, 0.5, 1.0, 1.5, 2.0, 2.50.0, 0.25, 0.5, 1.0, 1.5, 2.0, 2.5
and 3.0 mmand 3.0 mm
 Probe on z-stage micrometerProbe on z-stage micrometer
FOSS
Probe
Plaque Tissue
SampleRubber Mat
Blood Depth
Bovine Blood
Tissue Pins
Broadband
Light SourceDetector
Data
Acquisition
Computer
Four Tissue ClassificationsFour Tissue Classifications
1 mmNormal
Fibrotic
Lipid Calcific
HistologyHistology
 Fixed tissueFixed tissue
 Analyze probe illuminationAnalyze probe illumination
areaarea
 Stained sub-sections withStained sub-sections with
H&E and elastic trichromeH&E and elastic trichrome
 Microscopic planimetryMicroscopic planimetry
and morphology toand morphology to
characterize tissue contentcharacterize tissue content
Methods of AFIPMethods of AFIP
A3
B1
B2
B3
C1
Plaque CriteriaPlaque Criteria
 High LipidHigh Lipid
 LP / PL ≥ 40%LP / PL ≥ 40%
 FIB / PL ≤ 35%FIB / PL ≤ 35%
 CAL / PL ≤ 5%CAL / PL ≤ 5%
 High FibroticHigh Fibrotic
 FIB / PL ≥ 35%FIB / PL ≥ 35%
 LP / PL ≤ 35%LP / PL ≤ 35%
 CAL / PL ≤ 5%CAL / PL ≤ 5%
 High CalcificHigh Calcific
 CAL / PL ≥ 20%CAL / PL ≥ 20%
 LP / PL ≤ 35%LP / PL ≤ 35%
 ≤≤ 35%35%
Plaque SelectionPlaque Selection
DiseaseDisease
TypeType
SPECIMENSSPECIMENS
in Modelin Model
AORTASAORTAS
in Modelin Model
LipidLipid 3636 1919
FibroticFibrotic 2525 1515
CalcificCalcific 4444 2020
NormalNormal
TissueTissue
4141 4141
Example Spectra – 0 and 3 mmExample Spectra – 0 and 3 mm
.5
1
1.5
2
2.5
3
400 600 800 1000 1200 1400 1600 1800 2000 2200 2400
0.0 mm Normal
3.0 mm
0.0 mm Fibrotic
3.0 mm
0.0 mm Lipid Pool
3.0 mm
0.0 mm Calcific
3.0 mm
Wavelength (nm)
ABS.
Chemometric ModelChemometric Model
-1-0.8-0.6-0.4-0.200.20.40.60.81
Chemometric Prediction Score
SPECIFICITYSENSITIVITY
-1-0.8-0.6-0.4-0.200.20.40.60.81
Distribution of Lipid-
Rich Atheromas at all
blood depths
Threshold / Criterion
Distribution of other
tissue types at all
blood depths
Classification DistributionsClassification Distributions
-1.5-1-0.500.51
Lipid Pool CalcificFibrotic Normal
Threshold
SENS SPEC
Summary Prediction ResultsSummary Prediction Results
NIR (+) NIR (-) Results (a)
Lipid Pool (+)Lipid Pool (+) 164164 1616
Sensitivity:Sensitivity:
91%91%
No Lipid Pool (-)No Lipid Pool (-) 6666 484484
Specificity:Specificity:
88%88%
0 mm 0.25 mm 0.5 mm 1.0 mm 1.5 mm 2.0 mm 3.0 mm
SENSSENS 86%86% 92%92% 92%92% 94%94% 92%92% 83%83% 86%86%
SPECSPEC 88%88% 87%87% 87%87% 90%90% 87%87% 85%85% 72%72%
Sample-to-Probe Depth PredictionsSample-to-Probe Depth Predictions
0.0 mm 0.25 mm 0.5 mm 1.0 mm 1.5 mm
2.0 mm 3.0 mm
SENSSENS SPECSPEC
ConclusionsConclusions
 NIR can discriminate atherosclerotic plaqueNIR can discriminate atherosclerotic plaque
lipid poolslipid pools
 through variable blood depthsthrough variable blood depths
 with high sensitivity and high specificitywith high sensitivity and high specificity
 Study illustrates the potential clinicalStudy illustrates the potential clinical
feasibility of near-infrared spectroscopy tofeasibility of near-infrared spectroscopy to
detect vulnerable plaque in perfused coronarydetect vulnerable plaque in perfused coronary
arteries.arteries.
Ongoing workOngoing work
 Reproduce results with ex vivo coronaryReproduce results with ex vivo coronary
tissue through bloodtissue through blood
 Complete prototype console with 5 msecComplete prototype console with 5 msec
spectral acquisitionspectral acquisition
 Overcomes motionOvercomes motion
 Complete prototype human use catheterComplete prototype human use catheter
with 2.5 mm optical penetration depthwith 2.5 mm optical penetration depth
 Begin human studies – To discriminateBegin human studies – To discriminate
disrupted plaques from normal tissuesdisrupted plaques from normal tissues
through bloodthrough blood
VP.OrgVP.Org
November 16, 2002November 16, 2002
Mitchell W. Krucoff, MD, FACCMitchell W. Krucoff, MD, FACC
Associate Professor Medicine/CardiologyAssociate Professor Medicine/Cardiology
Duke University Medical CenterDuke University Medical Center
Director, Interventional Devices Clincal TrialsDirector, Interventional Devices Clincal Trials
Duke Clinical Research InstituteDuke Clinical Research Institute

163 infra redx

  • 1.
    VP.Org November 16, 2002 MitchellW. Krucoff, MD, FACC Associate Professor Medicine/Cardiology Duke University Medical Center Director, Interventional Devices Clincal Trials Duke Clinical Research Institute
  • 2.
    Discrimination of ExVivo Lipid-Discrimination of Ex Vivo Lipid- Rich Plaques in Human AortaRich Plaques in Human Aorta Specimens with NIR SpectroscopySpecimens with NIR Spectroscopy through Whole Bloodthrough Whole Blood B.Marshik, H.Tan, J.Tang, A. Zuluaga,B.Marshik, H.Tan, J.Tang, A. Zuluaga, A. Lindquist, P.R.Moreno, K.R.Purushothaman,A. Lindquist, P.R.Moreno, K.R.Purushothaman, W.O’Connor, G.TearneyW.O’Connor, G.Tearney
  • 3.
    First results onfreshFirst results on fresh human tissue sampleshuman tissue samples through variable depthsthrough variable depths of bloodof blood (updated from TCT 2002 poster)(updated from TCT 2002 poster)
  • 4.
    Tissue Evaluation byNIR SpectroscopyTissue Evaluation by NIR Spectroscopy  Absorbance of NIR light varies by wavelengthAbsorbance of NIR light varies by wavelength  Absorbance patterns (spectra) unique for different chemicalsAbsorbance patterns (spectra) unique for different chemicals  Reflection patterns (spectra) unique for different chemicalsReflection patterns (spectra) unique for different chemicals
  • 5.
    NIR Spectra ofHuman Aorta SamplesNIR Spectra of Human Aorta Samples Source: Infraredx, 2002 Normal 1 Normal 2 Plaque 1 Plaque2 Cholesterol Collagen Wavelength (Intensity)
  • 6.
    NIR Spectra ofHuman Aorta SamplesNIR Spectra of Human Aorta Samples Source: Infraredx, 2002 Normal 1 Normal 2 Plaque 1 Plaque2 Cholesterol Collagen
  • 7.
    ChemometricsChemometrics  Set ofmethods to predict chemical properties of unknownSet of methods to predict chemical properties of unknown samples using spectroscopy and linear algebrasamples using spectroscopy and linear algebra  Commonly used in pharmaceutical, chemical and foodCommonly used in pharmaceutical, chemical and food processing; also being applied to glucose monitoringprocessing; also being applied to glucose monitoring
  • 8.
    Advantages of NIRSpectroscopy +Advantages of NIR Spectroscopy + Chemometrics for Coronary TCFA DetectionChemometrics for Coronary TCFA Detection  Identifies chemical composition ofIdentifies chemical composition of vessel wallvessel wall  specificity and sensitivity > 85%specificity and sensitivity > 85%  potential to guide therapiespotential to guide therapies  3.2Fr coronary catheter compatible3.2Fr coronary catheter compatible  Works fast – insensitive to motionWorks fast – insensitive to motion  Chemometrics discriminatesChemometrics discriminates chemical composition independentchemical composition independent of blood depthof blood depth  no flushing neededno flushing needed  no tissue contactno tissue contact
  • 9.
    Near Infrared (NIR)SpectroscopyNear Infrared (NIR) Spectroscopy Previous ReportsPrevious Reports 1.1. Cassis, Lodder (1993)Cassis, Lodder (1993)  Discrimination of lipid-filled and normal rat aorta tissue specimensDiscrimination of lipid-filled and normal rat aorta tissue specimens 2.2. Jaross (1999)Jaross (1999)  Determined cholesterol content in human aorta tissue specimensDetermined cholesterol content in human aorta tissue specimens 3.3. Moreno (2002)Moreno (2002)  Identified lipid pool, thin cap, and inflammatory cells in human aortaIdentified lipid pool, thin cap, and inflammatory cells in human aorta tissue specimenstissue specimens 4.4. Wang (2002)Wang (2002)  Analyzed lipid and protein content in carotid endarterectomy specimensAnalyzed lipid and protein content in carotid endarterectomy specimens 5.5. Neumeister, Jaross (2002)Neumeister, Jaross (2002)  Determined cholesterol and collagen content in human aorta tissue withDetermined cholesterol and collagen content in human aorta tissue with NIR spectroscopyNIR spectroscopy  LimitationsLimitations: Not through blood, room temperature, fixed probe-target: Not through blood, room temperature, fixed probe-target distance, tissue fixed or frozen/thawed (except Wang)distance, tissue fixed or frozen/thawed (except Wang)
  • 10.
    Study PurposeStudy Purpose NIRspectroscopy and chemometrics:NIR spectroscopy and chemometrics: discriminate large lipid pool specimensdiscriminate large lipid pool specimens from other tissue typesfrom other tissue types using fresh human arterial tissueusing fresh human arterial tissue through variable amounts of bloodthrough variable amounts of blood
  • 11.
    InstrumentationInstrumentation  FOSS NIRSystemsModel 6500FOSS NIRSystems Model 6500  ½” diameter fiber optic SmartProbe™½” diameter fiber optic SmartProbe™  Central fiber delivery bundleCentral fiber delivery bundle  Outer fiber collection bundleOuter fiber collection bundle  Broad spectral range: 400 to 2500 nm.Broad spectral range: 400 to 2500 nm.  Sixty seconds for spectral acquisitionSixty seconds for spectral acquisition
  • 12.
    TissueTissue  Human AortaTissueHuman Aorta Tissue  Aorta from 72 human subjects (avg age 69.6 ±12.8)Aorta from 72 human subjects (avg age 69.6 ±12.8)  751 tissue specimens cut to 2x2 cm from diseased and751 tissue specimens cut to 2x2 cm from diseased and non-diseased sitesnon-diseased sites  Stored in phosphate buffered saline solutionStored in phosphate buffered saline solution  Shipped on wet ice less then 24 hours after autopsyShipped on wet ice less then 24 hours after autopsy
  • 13.
    NIR MethodNIR Method Tissue placed on rubberTissue placed on rubber mat in glass dishmat in glass dish  Blood and tissue at 38°CBlood and tissue at 38°C  NIR spectra acquired atNIR spectra acquired at probe-to-tissue separationsprobe-to-tissue separations  0.0, 0.25, 0.5, 1.0, 1.5, 2.0, 2.50.0, 0.25, 0.5, 1.0, 1.5, 2.0, 2.5 and 3.0 mmand 3.0 mm  Probe on z-stage micrometerProbe on z-stage micrometer FOSS Probe Plaque Tissue SampleRubber Mat Blood Depth Bovine Blood Tissue Pins Broadband Light SourceDetector Data Acquisition Computer
  • 14.
    Four Tissue ClassificationsFourTissue Classifications 1 mmNormal Fibrotic Lipid Calcific
  • 15.
    HistologyHistology  Fixed tissueFixedtissue  Analyze probe illuminationAnalyze probe illumination areaarea  Stained sub-sections withStained sub-sections with H&E and elastic trichromeH&E and elastic trichrome  Microscopic planimetryMicroscopic planimetry and morphology toand morphology to characterize tissue contentcharacterize tissue content Methods of AFIPMethods of AFIP A3 B1 B2 B3 C1
  • 16.
    Plaque CriteriaPlaque Criteria High LipidHigh Lipid  LP / PL ≥ 40%LP / PL ≥ 40%  FIB / PL ≤ 35%FIB / PL ≤ 35%  CAL / PL ≤ 5%CAL / PL ≤ 5%  High FibroticHigh Fibrotic  FIB / PL ≥ 35%FIB / PL ≥ 35%  LP / PL ≤ 35%LP / PL ≤ 35%  CAL / PL ≤ 5%CAL / PL ≤ 5%  High CalcificHigh Calcific  CAL / PL ≥ 20%CAL / PL ≥ 20%  LP / PL ≤ 35%LP / PL ≤ 35%  ≤≤ 35%35%
  • 17.
    Plaque SelectionPlaque Selection DiseaseDisease TypeType SPECIMENSSPECIMENS inModelin Model AORTASAORTAS in Modelin Model LipidLipid 3636 1919 FibroticFibrotic 2525 1515 CalcificCalcific 4444 2020 NormalNormal TissueTissue 4141 4141
  • 18.
    Example Spectra –0 and 3 mmExample Spectra – 0 and 3 mm .5 1 1.5 2 2.5 3 400 600 800 1000 1200 1400 1600 1800 2000 2200 2400 0.0 mm Normal 3.0 mm 0.0 mm Fibrotic 3.0 mm 0.0 mm Lipid Pool 3.0 mm 0.0 mm Calcific 3.0 mm Wavelength (nm) ABS.
  • 19.
    Chemometric ModelChemometric Model -1-0.8-0.6-0.4-0.200.20.40.60.81 ChemometricPrediction Score SPECIFICITYSENSITIVITY -1-0.8-0.6-0.4-0.200.20.40.60.81 Distribution of Lipid- Rich Atheromas at all blood depths Threshold / Criterion Distribution of other tissue types at all blood depths
  • 20.
  • 21.
    Summary Prediction ResultsSummaryPrediction Results NIR (+) NIR (-) Results (a) Lipid Pool (+)Lipid Pool (+) 164164 1616 Sensitivity:Sensitivity: 91%91% No Lipid Pool (-)No Lipid Pool (-) 6666 484484 Specificity:Specificity: 88%88%
  • 22.
    0 mm 0.25mm 0.5 mm 1.0 mm 1.5 mm 2.0 mm 3.0 mm SENSSENS 86%86% 92%92% 92%92% 94%94% 92%92% 83%83% 86%86% SPECSPEC 88%88% 87%87% 87%87% 90%90% 87%87% 85%85% 72%72% Sample-to-Probe Depth PredictionsSample-to-Probe Depth Predictions 0.0 mm 0.25 mm 0.5 mm 1.0 mm 1.5 mm 2.0 mm 3.0 mm SENSSENS SPECSPEC
  • 23.
    ConclusionsConclusions  NIR candiscriminate atherosclerotic plaqueNIR can discriminate atherosclerotic plaque lipid poolslipid pools  through variable blood depthsthrough variable blood depths  with high sensitivity and high specificitywith high sensitivity and high specificity  Study illustrates the potential clinicalStudy illustrates the potential clinical feasibility of near-infrared spectroscopy tofeasibility of near-infrared spectroscopy to detect vulnerable plaque in perfused coronarydetect vulnerable plaque in perfused coronary arteries.arteries.
  • 24.
    Ongoing workOngoing work Reproduce results with ex vivo coronaryReproduce results with ex vivo coronary tissue through bloodtissue through blood  Complete prototype console with 5 msecComplete prototype console with 5 msec spectral acquisitionspectral acquisition  Overcomes motionOvercomes motion  Complete prototype human use catheterComplete prototype human use catheter with 2.5 mm optical penetration depthwith 2.5 mm optical penetration depth  Begin human studies – To discriminateBegin human studies – To discriminate disrupted plaques from normal tissuesdisrupted plaques from normal tissues through bloodthrough blood
  • 25.
    VP.OrgVP.Org November 16, 2002November16, 2002 Mitchell W. Krucoff, MD, FACCMitchell W. Krucoff, MD, FACC Associate Professor Medicine/CardiologyAssociate Professor Medicine/Cardiology Duke University Medical CenterDuke University Medical Center Director, Interventional Devices Clincal TrialsDirector, Interventional Devices Clincal Trials Duke Clinical Research InstituteDuke Clinical Research Institute

Editor's Notes

  • #5 Near Infrared Spectroscopy is performed by shining light on tissue, collecting the returned light, and measuring the absorbance as a function of wavelength. Chemicals each have their own absorbance characteristics. Mixtures of chemicals provide spectra that are convolutions of chemical spectra. Similar tissue types have similar spectral signatures.
  • #6 One tissue sample was measured at two spots – normal and diseased - with no blood. The normal spot was measured twice and the diseased spot was measured twice. Differences between normal and plaque spectra can be seen visually. Spectra of cholesterol and collagen are also shown, and account for some of the differences.
  • #7 One tissue sample was measured at two spots – normal and diseased - with no blood. The normal spot was measured twice and the diseased spot was measured twice. Differences between normal and plaque spectra can be seen visually. Spectra of cholesterol and collagen are also shown, and account for some of the differences.
  • #8 Chemometrics is a powerful tool for detecting subtle differences between spectra and is needed to distinguish TCFA’s from all other plaques and normal tissues through blood. First, a calibration is performed. A database of spectra and histology is created. A correlation is determined and a model is built. Second, the model is applied to new spectra, and histology is predicted.
  • #9 NIR spectroscopy is most appropriate solution to challenge of TCFA detection. NIR spectroscopy can discriminate morphologically similar but chemically distinct tissue types. Chemometrics works because differences in spectra taken at multiple sites are caused by changes in the chemical composition of the target. Chemometric algorithms are developed by correlating changes in spectra with changes in known targets. Chemometric algorithms can be defined to work independently of blood depth, by incorporating spectra with many blood types in the calibration process.