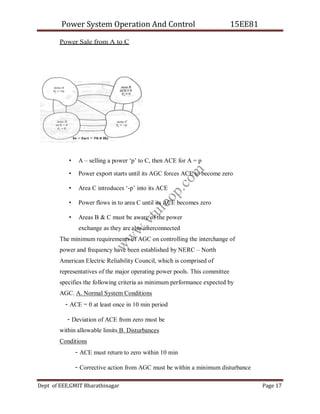
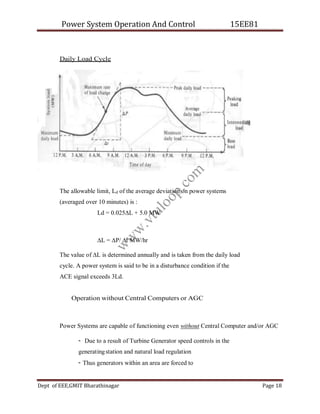
Power System Operation And Control 15EE81
Dept of EEE,GMIT Bharathinagar Page 1
MODULE-1
CONTROL CENTRE OPERATION OF POWERSYSTEMS
General Introduction
Electrical Technology was founded on the remarkable discovery by
Faraday that a changing magnetic flux creates an electric field. Out of that
discovery, grew the largest and most complex engineering achievement of man :
the electric power system. Indeed, life without electricity is now unimaginable.
Electric power systems form the basic infrastructure of a country. Even as we read
this, electrical energy is being produced at rates in excess of hundreds of giga-
watts (1 GW = 1,000,000,000 W). Giant rotors spinning at speeds up to 3000
rotations per minute bring us the energy stored in the potential energy of water, or
in fossil fuels. Yet we notice electricity only when the lights go out!
While the basic features of the electrical power system have remained practically
unchanged in the past century, but there are some significant milestones in the
evolution of electrical power systems.
Introduction to SCADA
• Control Centre
• Digital Computer Configuration
• Automatic Generation Control
• Area Control Error
• Operation Without Central Computers
• Expression for Tie Line Flow
• Parallel Operation of Generators
• Area Lumped Dynamic Model
w
w
w
.
v
t
u
l
o
o
p
.
c
o
m
Power System Operation And Control 15EE81
Dept of EEE,GMIT Bharathinagar Page 2
Introduction
Electrical energy is an essential ingredient for the industrial and all round
development of any country. It is generated centrally in bulk and transmitted
economically over long distances.
Electrical energy is conserved at every step in the process of Generation,
Transmission, Distribution and utilization of electrical energy. The electrical
utility industry is probably the largest and most complex industry in the world and
hence very complex and challenging problems to be handled by power
engineering particularly, in designing future power system to deliver increasing
amounts of electrical energy. This calls for perfect understanding, analysis and
decision making of the system. This power system operation and its control play a
very important task in the world of Electrical Power Engineering.
Power Quality
Power quality is characterized by –
a) Stable AC voltages at near nominal values and at near rated
frequency subject to acceptable minor variations, free from annoying
voltage flicker, voltage sags and frequency fluctuations.
b) Near sinusoidal current and voltage wave forms free from higher
order harmonics
Effects of Poor Power Quality
 Maloperation of control devices, relays etc.
 Extra losses in capacitors, transformers and rotating machines
 Fast ageing of equipments
 Loss of production due to service interruptions
 Electro-magnetic interference due to transients
 power fluctuation not tolerated by power electronic parts
w
w
w
.
v
t
u
l
o
o
p
.
c
o
m
Power System Operation And Control 15EE81
Dept of EEE,GMIT Bharathinagar Page 3
Major causes of Poor Power Quality
 Nonlinear Loads
 Adjustable speed drives
 Traction Drives
 Start of large motor loads
 Arc furnaces
 Intermittent load transients
 Lightning
 Switching Operations
 Fault Occurrences
Steps to address Power Quality issues
 Detailed field measurements
 Monitor electrical parameters at various places to assess the operating
conditions in terms of power quality.
 Detailed studies using a computer model. The accuracy of computer model
is first built to the degree where the observed simulation values matches
with those of the field
 For the purpose of the analysis we may use load flow studies, dynamic
simulations, EMTP simulations, harmonic analysis depending on the
objectives of the studies.
 We also evaluate the effectiveness of harmonic filters through the
computer model built, paying due attention to any reactive power
compensation thatthese filters may provide at fundamental frequency for
normal system operating conditions.
 The equipment ratings will also be addressed to account for harmonic
w
w
w
.
v
t
u
l
o
o
p
.
c
o
m
Power System Operation And Control 15EE81
Dept of EEE,GMIT Bharathinagar Page 4
current flows and consequent overheating.
Power Quality Solutions:
Poor power quality in the form of harmonic distortion or low power factor
increases stress on a facility’s electrical system. Over time this increased electrical
stress will shorten the life expectancy of electrical equipment. In addition to
system degradation, poor power quality can cause nuisance tripping and
unplanned shutdowns within electrical system.
In an increasingly automated electrical world, it is important for a facility to
evaluate power quality. Harmonic distortion, low power factor, and the presence
of other transients can cause severe damage to electrical system equipment. PSE
provides system analysis and evaluation of power quality issues and makes
recommendations for system design solutions
Structure of PowerSystems
Generating Stations, transmission lines and the distribution systems are the
main components of an electric power system. Generating stations and
distribution systems are connected through transmission lines, which also connect
one power system (grid, area) to another. A distribution system connects all the
loads in a particular area to the transmission lines.
For economical technical reasons, individual power systems are organized
in the form of electrically connected areas or regional grids.
As power systems increased in size, so did the number of lines,
substations, transformers, switchgear etc. Their operation and interactions became
more complex and hence it is necessary to monitor this information
simultaneously for the total system at a focal point called as Energy Control
Centre. The fundamental design feature is increase in system reliability and
economic feasibility.
w
w
w
.
v
t
u
l
o
o
p
.
c
o
m
Power System Operation And Control 15EE81
Dept of EEE,GMIT Bharathinagar Page 5
Major Concerns of Power System Design and Operation
 Quality : Continuous at desired frequency and voltage level
 Reliability :Minimum failure rate of components and systems
 Security : Robustness - normal state even after disturbances
 Stability : Maintain synchronism underdisturbances
 Economy : Minimize Capital, running and maintenance Costs
Need for Power System
 Demand for Power
Increasing
No of transmission line, Sub-stations, Transformers, switchgear etc.,
 Operation and Interaction is more and more complex
 Essential to monitor simultaneously for the total system at a focal
point – ENERGY LOAD CENTRE
Components of power system operation and control
Energy Load Centre
The function of energy load centre is to control the function of
coordinating the response in both normal and emergency conditions.
Digital Computers are very effectively used for the purpose. Their
function is to process the data, detect abnormalities, alarm the human
operator by lights, buzzers, screens etc., depending on the severity of the
problem.
Control Centre of a Power System
• Human Machine Interface – equipped with
w
w
w
.
v
t
u
l
o
o
p
.
c
o
m
Power System Operation And Control 15EE81
Dept of EEE,GMIT Bharathinagar Page 6
• CRT presentations
• Keyboards – change parameters
• Special function keyboards- alter transformer taps, switch line capacitors etc.,
• Light-Pen cursor – open or close circuit breakers
• Alarm lights, alarms, dedicated telephone
communications with generating stations and transmission
substations, neighboring power utilities
Control Features – ControlCentre
• System Commands – Mode of control
• Units – base / peak load
• AGC – Automatic Generation Control
• Data Entry
• Alarms – To find source of alarm and necessary action
• Plant/Substation selection
• Special Functions - To send/retrieve data etc.,
• Readout control – Output to CRT/printers etc.,
• CPU control – Selection for the computer
Functions of ControlCentre
• Short, Medium and Long-term Load Forecasting
• System Planning
• Unit Commitment and maintenance Scheduling
• Security Monitoring
• State Estimation
w
w
w
.
v
t
u
l
o
o
p
.
c
o
m
Power System Operation And Control 15EE81
Dept of EEE,GMIT Bharathinagar Page 7
• Economic Dispatch
• Load Frequency Control
SCADA – Supervisory Control and Data Acquisition
One of key processes of SCADA is the ability to monitor an entire system
in real time. This is facilitated by data acquisitions including meter reading,
checking statuses of sensors, etc that are communicated at regular intervals
depending on the system.
A well planned and implemented SCADA system not only helps utilities
deliver power reliably and safely to their customers but it also helps to lower the
costs and achieve higher customer satisfaction and retention.
SCADA – Why do we need it?
 If we did not have SCADA, we would have very inefficient use
of human resources and this would cost us (Rs,Rs,Rs)
 In today’s restructured environment SCADA is critical in handling the
volume of data needed in a timely fashion
 Service restoration would involve travel time and would be significantly higher
 It is essential to maintain reliability
SCADA - Architecture
• Basic elements are sensors which measure the desired quantities
• Current Transformers CTs – measure currents and Potential
Transformers PTs- measure voltages.
w
w
w
.
v
t
u
l
o
o
p
.
c
o
m
Power System Operation And Control 15EE81
Dept of EEE,GMIT Bharathinagar Page 8
• Today there is a whole new breed of Intelligent electronic devices (IEDs)
• This data is fed to a remote terminal unit (RTU)
• The master computer or unit resides at the control center EMS
SCADA - Process
• Master unit scan RTUs for reports, if reports exist, RTU sends
back the data and the master computer places it in memory
• In some new substation architectures there could be significant
local processing of data which could then be sent to the control
center.
• The data is then displayed on CRTs and printed
SCADA - Logging
• The SCADA provides a complete log of the system
• The log could be provided for the entire system or part of the system
• Type of information provided
– Time of event
– Circuit breaker status
– Current measurements, voltage measurements,
calculated flows, energy, etc.
– Line and equipment ratings
SCADA as aSystem
There are many parts of a working SCADA system. A SCADA system
usually includes signal hardware (input and output), controllers, networks, user
interface (HMI), communications equipment and software. All together, the term
SCADA refers to the entire central system. The central system usually monitors
data from various sensors that are either in close proximity or off site (sometimes
w
w
w
.
v
t
u
l
o
o
p
.
c
o
m
Power System Operation And Control 15EE81
Dept of EEE,GMIT Bharathinagar Page 9
miles away).
For the most part, the brains of a SCADA system are
performed by the Remote Terminal Units (sometimes referred to as the RTU).
The Remote Terminal Units consists of a programmable logic converter. The
RTU are usually set to specific requirements, however, most RTU allow
human intervention, for instance, in a factory setting, the RTU might control
the setting of a conveyer belt, and the speed can be changed or overridden at
any time by human intervention. In addition, any changes or errors are usually
automatically logged for and/or displayed. Most often, a SCADA system will
monitor and make slight changes to function optimally; SCADA systems are
considered closed loop systems and run with relatively little human
intervention.
SCADA can be seen as a system with many data elements called points.
Usually each point is a monitor or sensor. Usually points can be either hard or
soft. A hard data point can be an actual monitor; a soft point can be seen as an
application or software calculation. Data elements from hard and soft points are
usually always recorded and logged to create a time stamp or history
User Interface – Human Machine Interface (HMI)
A SCADA system includes a user interface, usually called Human
Machine Interface (HMI). The HMI of a SCADA system is where data is
processed and presented to be viewed and monitored by a human operator. This
interface usually includes controls where the individual can interface with the
SCADA system.
HMI's are an easy way to standardize the facilitation of monitoring
multiple RTU's or PLC's (programmable logic controllers). Usually RTU's or
PLC's will run a pre programmed process, but monitoring each of them
individually can be difficult, usually because they are spread out over the system.
w
w
w
.
v
t
u
l
o
o
p
.
c
o
m
Power System Operation And Control 15EE81
Dept of EEE,GMIT Bharathinagar Page 10
Because RTU's and PLC's historically had no standardized method to display or
present data to an operator, the SCADA system communicates with PLC's
throughout the system network and processes information that is easily
disseminated by the HMI.
HMI's can also be linked to a database, which can use data gathered from
PLC's or RTU's to provide graphs on trends, logistic info, schematics for a
specific sensor or machine or even make troubleshooting guides accessible. In the
last decade, practically all SCADA systems include an integrated HMI and PLC
device making it extremely easy to run and monitor a SCADA system.
Today’s SCADA systems, in response to changing business needs, have added
new functionalities and are aiding strategic advancements towards interactive, self
healing smart grids of the future. A modern SCADA system is also a strategic
investment which is a must-have for utilities of all sizes facing the challenges of
the competitive market and increased levels of real time data exchange that comes
with it (Independent Market Operator, Regional Transmission Operator, Major
C&I establishments etc). A well planned and implemented SCADA system not
only helps utilities deliver power reliably and safely to their customers but it also
helps to lower the costs and achieve higher customer satisfaction and retention.
Modern SCADA systems are already contributing and playing a key role at many
utilities towards achieving :
 New levels in electric grid reliability – increased revenue.
 Proactive problem detection and resolution – higher reliability.
 Meeting the mandated power quality requirements – increased customer
satisfaction.
 Real time strategic decision making – cost reductions and increased revenue
w
w
w
.
v
t
u
l
o
o
p
.
c
o
m
Power System Operation And Control 15EE81
Dept of EEE,GMIT Bharathinagar Page 11
Critical Functions of SCADA
Following functions are carried out every 2 seconds :
• Switchgear Position, Transformer taps, Capacitor banks
• Tie line flows and interchange schedules
• Generator loads, voltage etc.,
• Verification on links between computer and remote equipment
Modern SCADA systems are already contributing and playing a key role
at many utilities towards achieving :
• - New levels in electric grid reliability – increased revenue.
• - Proactive problem detection and resolution – higher reliability.
• - Meeting the mandated power quality requirements –
increased customer satisfaction.
• - Real time strategic decision making – cost reductions and increased revenue.
Digital ComputerConfiguration
Major functions
- Data acquisition control
- Energy Management
- System Security
For best/secured operation 100% redundancy is used – Dual Digital Computers
i) on-line computer – monitors and controls the system
ii) Backup computer – load forecasting or hydro thermal allocations
w
w
w
.
v
t
u
l
o
o
p
.
c
o
m
Power System Operation And Control 15EE81
Dept of EEE,GMIT Bharathinagar Page 12
The digital computers are usually employed in a fixed-cycle operating
mode with priority interrupts wherein the computer periodically performs
a list of operation. The most critical functions have the fastest scan cycle.
Typically the following categoties are scanned every 2 seconds :
• All status points such as switchgear position (open or closed),
substationloads and voltages, transformer tap positions, and
capacitor banks etc.,
• Tie line flows and interchange schedules
• Generator loads, voltage, operating limits and boiler capacity
• Telemetry verificationto detect failures and errors in the bilateral
communication links between the digital computer and the
remote equipment.
Important Areas of Concern in power System
- Automatic Generation Control(AGC)
On-line Computer Control that maintains overall system
frequency and net tie- line load exchange through interconnection
- Economic Load Dispatch
On-line computer control to supply load demand using
all interconnected system’s power in the most economical
manner
AGC is the name given to a control system having three major objectives :
a. To hold system frequency at or very close to a specified
nominal value (50 or 60Hz)
b. To maintain the correct value of interchange power between control areas
c. To maintain each unit’s generation at the most economic value.
w
w
w
.
v
t
u
l
o
o
p
.
c
o
m
Power System Operation And Control 15EE81
Dept of EEE,GMIT Bharathinagar Page 13
To implement an AGC system, the following information is required :
- Unit megawatt output of each committed unit
- Megawatt flow over each tie line to neighboring systems
- System frequency
Usually, neighboring power companies are interconnected by one or more
transmission lines called Tie Lines. The objective is to buy or sell power with
neighboring systems whose operating costs make such transactions profitable.
Also, even if no power is being transmitted over ties to neighboring system, if
one system has a sudden loss of a generating unit, the units throught all the
interconnection will experience a frequency change and can help in restoring
frequency.
Advantages of interconnectedsystem
 Reduces Reserve Capacity – thus reduces installed capacity
 Capital Cost/kW is less for larger Unit
 in India single unit can support >500MW because of interconnection
 Effective Use of Generators
 Optimization of Generation – installed capacity is reduced
 Reliability
Disadvantages of interconnectedsystem
 Fault get Propagated – calls for fast switchgear
 CB rating increases
 Proper management required – EMS and it must be automated –
Economic load dispatch - Base load and Peak Load
w
w
w
.
v
t
u
l
o
o
p
.
c
o
m
Power System Operation And Control 15EE81
Dept of EEE,GMIT Bharathinagar Page 14
National Regional ElectricityBoards
• Northern Regional Electricity Board
• Western Regional Electricity Board
• Southern Regional Electricity Board
• Eastern Regional Electricity Board
• North-east Regional Electricity Board
Goal–TohaveNationalGridtoimproveefficiencyofthe
wholeNational Power Grid
Control Area Concept
All generators are tightly coupled together to form – Coherent Group
- all generators respond to changes in load or speed changer setting
Control Area – frequency is assumed to be constant throughout in
static and dynamic conditions
For the purpose of analysis, a control area can be reduced to a single
speed governor, turbo generator and load system
Interconnected Power System
w
w
w
.
v
t
u
l
o
o
p
.
c
o
m
Power System Operation And Control 15EE81
Dept of EEE,GMIT Bharathinagar Page 15
Functions
- Exchange or sale of power
- Disturbed areas taking other area’s help
- Long distance sale and transfer of power
Area Control Error – ACE
To maintain a net interchange of power with its area neighbors, an AGC
uses real power flow measurements of all tie linesa emanating from the
area and subtracts the scheduled interchange to calculate an error value.
The net power interchange, together with a gain, B (MW/0.1Hz), called
the frequency bias, as a multiplier on the frequency deviation is called the
Area Control Error (ACE) given by,
Pk = Power in Tie lIne -
+ve – out of the area Ps –
Scheduled Power
Interchange
f0 – Base frequency, fact – Actual frequency
+ve ACE indicates flow out of the area.
ACE – Input toAGC
w
w
w
.
v
t
u
l
o
o
p
.
c
o
m
Power System Operation And Control 15EE81
Dept of EEE,GMIT Bharathinagar Page 16
The real power summation of ACE loses information as to the flow of individual
tie lines but is concerned with area net generation. The tie lines transfer power
through the area from one neighbor to the next, called ‘Wheeling Power’. The
wheeling power cancels algebraically in the ACE. Thus one area purchases or
sells blocks of power (MWh) with non-neighbor utilities.
w
w
w
.
v
t
u
l
o
o
p
.
c
o
m
Power System Operation And Control 15EE81
Dept of EEE,GMIT Bharathinagar Page 17
Power Sale from A to C
• A – selling a power ‘p’ to C, then ACE for A = p
• Power export starts until its AGC forces ACE to become zero
• Area C introduces ‘-p’ into its ACE
• Power flows in to area C until its ACE becomes zero
• Areas B & C must be aware of the power
exchange as they are also interconnected
The minimum requirements of AGC on controlling the interchange of
power and frequency have been established by NERC – North
American Electric Reliability Council, which is comprised of
representatives of the major operating power pools. This committee
specifies the following criteria as minimum performance expected by
AGC. A. Normal System Conditions
- ACE = 0 at least once in 10 min period
- Deviation of ACE from zero must be
within allowable limits B. Disturbances
Conditions
- ACE must return to zero within 10 min
- Corrective action from AGC must be within a minimum disturbance
w
w
w
.
v
t
u
l
o
o
p
.
c
o
m
Power System Operation And Control 15EE81
Dept of EEE,GMIT Bharathinagar Page 18
Daily Load Cycle
The allowable limit, Ld of the average deviation on power systems
(averaged over 10 minutes) is :
Ld = 0.025∆L + 5.0 MW
∆L = ∆P/ ∆t MW/hr
The value of ∆L is determined annually and is taken from the daily load
cycle. A power system is said to be in a disturbance condition if the
ACE signal exceeds 3Ld.
Operation without Central Computers or AGC
Power Systems are capable of functioning even without Central Computer and/or AGC
- Due to a result of Turbine Generator speed controls in the
generatingstation and natural load regulation
- Thus generators within an area are forced to
w
w
w
.
v
t
u
l
o
o
p
.
c
o
m
Power System Operation And Control 15EE81
Dept of EEE,GMIT Bharathinagar Page 19
share load and cause interconnected areas to share
load
Generation Frequency CharacteristicCurve
Let there be two independent areas A and B without tie line flow as the
circuit breaker is open. Let there be a sudden change in load occurs in the area D.
Area A is considered as a single operating area representing the remainder of the
interconnection. It is further assumed that the areas share the disturbance in
proportion to their generating capacity and operating characteristics. Let the area
generation- frequency characteristics be represented by the curve GG which is a
composite response curve from all the generators in area A. The characteristic
curve has a negative slope with frequency.
w
w
w
.
v
t
u
l
o
o
p
.
c
o
m
Power System Operation And Control 15EE81
Dept of EEE,GMIT Bharathinagar Page 20
The area connected load is defined by the curve LL as shown. As there
is increase in load the rotating machinery in the area is forced to increase the
speed.
Basic Equations
GA = G0 +10β1 (fact – f0)MW LA = L0 +10β2 (fact – f0)MW
GA = Total Generation, G0 = Base generation
LA = Total Load, L0 = Base load, fact = System frequency,f0 = Base
frequency, β1 = Cotangent of generation-frequency characteristic,
MW/0.1 Hz < 0
β2 = Cotangent of load-frequency characteristic, MW/0.1 Hz > 0
Isolated Operation in A – response to load change
w
w
w
.
v
t
u
l
o
o
p
.
c
o
m
Power System Operation And Control 15EE81
Dept of EEE,GMIT Bharathinagar Page 21
For Steady State Frequency – Total generation = Total
effective load This is defined by the intersection of GG and
LL curves as shown – Io.
Combined characteristic of GG and LL is CC. The composite generation load
frequency characteristics is given by,
GA = G0 +10β1 (fact – f0), LA = L0 +10β2
(fact – f0) GA - LA = G0 +10β1 (fact – f0) -
L0 -10β2 (fact – f0)
Increase in load in ‘A’ moves the load frequency curve to position L’L’. The new
system frequency will now be defined by the intersection labeled as I1 at
49.9Hz.Then it is desired to return the system frequency to 50.0Hz i.e., point I2.
Setting AGC in ‘A’- shifting of GG to G’G’ takes place to meet frequency
demand of 50.0Hz – I2
Resulting combined characteristic is C’C’ In terms of increments,
∆A = GA - G0 + L0 - LA = 10β1 (fact – f0) -10β2 (fact – f0)
= 10BA XA ∆f MW
∆A = GA - G0 + L0 - LA = 10β1 (fact – f0) -10β2 (fact – f0)
= 10BA XA ∆f MW
w
w
w
.
v
t
u
l
o
o
p
.
c
o
m
Power System Operation And Control 15EE81
Dept of EEE,GMIT Bharathinagar Page 22
BA - Natural regulation characteristic - % gen
for 0.1Hz XA – Generating Capacity of A, MW
Frequency deviation = ∆f = ∆A /
10BA XA Hz Considering Tie line
flow, Frequency deviation
∆f = (∆A + ∆TL ) / (10BA XA)Hz
∆A + ∆TL - Net Megawatt change
∆TL = ∆GA - ∆LA
Effect of Tie Line Flow - Interconnectedoperation
Let two areas A and B are interconnected through a Tie Line. Thus both
Generation and Load frequency are equal to 50.0 Hz. There is no initial Tie Line
Power Flow.
- Disturbance occur at B causing frequency to drop to 49.9Hz
- Area generation does not match with effective load in A
w
w
w
.
v
t
u
l
o
o
p
.
c
o
m
Power System Operation And Control 15EE81
Dept of EEE,GMIT Bharathinagar Page 23
- Difference between I1 and I2 – difference between generation
and load – net excess power in the area – flows out of A
towards B
- Contributory effects in A are decrease in load power
∆L and increase in generation ∆G
- Tie Line Flow from A to B = ∆TL = (∆GA - ∆LA ) MW
- If area A has AGC, tie line flows increases – ∆TL’ and ∆TL’’
representing increased amounts of bias due to AGC.
Frequency change due to disturbance ∆B for a tie line power flow from A to B is
∆f = ∆B - ∆TL / (10BB XB) Hz
∆TL = (10BA XA) ∆AB / (10BA XA +10BB XB) MW
Net power change in B is
= ∆AB - ∆TL
= (10BB XB) ∆AB / (10BA XA +10BB XB)
∆AB = (10BA XA+ 10BB XB )∆f
Hence, ∆f / ∆AB = 1/(10BA XA+ 10BB XB )
Example
Two areas A and B are interconnected. Generating capacity of A is
36,000Mw with regulating characteristic of 1.5%/0.1Hz. B has 4000MW with
1%/0.1Hz. Find each area’s share of +400MW disturbance (load increase)
occurring in B and resulting tie line flow.
∆f = ∆AB / (10 BAXA + 10 BBXB = 400 / -10(0.015)(36,000) – 10(0.01)(4000)
= -0.06896 Hz
w
w
w
.
v
t
u
l
o
o
p
.
c
o
m
Power System Operation And Control 15EE81
Dept of EEE,GMIT Bharathinagar Page 24
Tie Line flow = ∆TL = (10BA XA) ∆AB / (10BA XA +10BB XB) = 5400*400/4800
= 372.4MW
Smallersystemneedonly
27.6MW Frequency
regulationismuchbetter
Parallel Operation of Generators
Tie line flows and frequency droop described for interconnected power
areas are composite characteristics based on parallel operation of generators.
Each area could maintain its speed w = 2 f, then aload common to both areas, by
superposition have
the terminal voltage,
Vload = V1sinw1t + V2sinw2t, Where, 1&2 represents areas and ‘t’ time in secs.
Generator speed versus load characteristics is a function of the type of the
governor used on the prime mover- type 0 – for a speed droop system and type 1
– forconstant speed system.
Parallel operation of generator with infinite bus
The generator characteristic is such that it is loaded to 50% of its capacity
when paralleled to the bus.
Therefore, Unit speed regulation = R = ∆f(pu)/∆P(pu)
w
w
w
.
v
t
u
l
o
o
p
.
c
o
m
Power System Operation And Control 15EE81
Dept of EEE,GMIT Bharathinagar Page 25
=
If it is desired to increase the load on the generator, the prime mover torque is
increased, which results in a shift of the speed-droop curve as shown below. The
real power flow is given by, P = V1V2 sin(θ1 - θ2) / X , where X = synchronous
reactance
Parallel operation of two identical units
Load
w
w
w
.
v
t
u
l
o
o
p
.
c
o
m
Power System Operation And Control 15EE81
Dept of EEE,GMIT Bharathinagar Page 26
Two generators paralleled have different governor-speed-droop characteristics.
Because they are in parallel, power exchange between them forces them to
synchronize at a common frequency. Since the two units are of equal capacity
having equal regulation are initially operating at 1.0 base speed as shown above.
If unit is operated at point A1 satisfies 25% of the total load and unit 2 at point A2
supplies 75%. If the total load is increased to 150%, the frequency decreases to f1.
Since the droop curves are linear, unit 1 will increase its load to 50% of rating and
unit 2 to be overloaded.
Parallel operation of two units with different capacity and regulation
The case when two units of different frequency and regulation
characteristics are operated in parallel is as shown below. The regulation
characteristics are
R1 = ∆f(pu) / ∆P1 (pu), R2 = ∆f(pu) / ∆P2 (pu)
Initial Loads - P1 and P2, change in load
∆L = ∆P1 + ∆P2 =
Equivalent System Regulation = ∆f / ∆L =
w
w
w
.
v
t
u
l
o
o
p
.
c
o
m
Power System Operation And Control 15EE81
Dept of EEE,GMIT Bharathinagar Page 27
Area Lumped DynamicModel
The model discussed so far is one macroscopic behavior because there is
no effort made to indicate instantaneous power flow within the system due to a tie
line disturbance, magnitudes of the internal line flows, the time history of
generator phase angles and so on. The power system macro model may be
described by means of a block diagram as shown in the block diagram.
w
w
w
.
v
t
u
l
o
o
p
.
c
o
m
Power System Operation And Control 15EE81
Dept of EEE,GMIT Bharathinagar Page 28
HA = Effective Inertia of rotating
machinery loads Β2 = Load frequency
characteristics, MW/0.1Hz Pirate =
Rated power output of Gen ‘i’
∆Pi = Power Increment for gen ‘i’
1/Ri = Droop characteristic of gen ‘i’, Hz/MW
Analysis – Isolated Power Area without Tie Lines
Steady State value of Frequency deviation ∆f for a load change ∆L
= ∆A/S
Hence,
w
w
w
.
v
t
u
l
o
o
p
.
c
o
m
Power System Operation And Control 15EE81
Dept of EEE,GMIT Bharathinagar Page 29
∆f/ ∆A = 1/(10β1 - 10 β2)
Combining droop characteristics of M gen,
Analysis - Isolated Power Area with AGC
w
w
w
.
v
t
u
l
o
o
p
.
c
o
m
Power System Operation And Control 15EE81
Dept of EEE,GMIT Bharathinagar Page 30
CONSTRAINTS IN ECONOMIC OPERATION OF POWER
SYSTEMS:
Various constraints are imposed on the problem of economic
operation of power systems as listed below:
Primary constraints (equality constraints):
Power balance equations:
Pi - PDi - Pl =0; Qi - QDi - Ql =0; i=buses of the system(5) where,Pl=
Σ‖ViVjYij‖ cos (δij-θij);
Ql= Σ‖ViVjYij‖ sin (δij-θij);
j = 1,2,….n, are the power flow to the neighboring system.(6)
w
w
w
.
v
t
u
l
o
o
p
.
c
o
m
Power System Operation And Control 15EE81
Dept of EEE,GMIT Bharathinagar Page 31
i
The above constraints arise due to the need for the system to balance
the generation and load demand of the system.
Secondary constraints (inequality constraints):
These arise due to physical and operational limitations of the units and components.
Pi
min ≤ Pi ≤ P max
Qi
min ≤ Qi ≤ Qi
max
i = 1,2,….n, the number of generating units in the system. (7)
Spare Capacity Constraints:
These are used to account for the errors in load prediction, any
sudden or fast change in load demand, inadvertent loss of scheduled
generation, etc. Here, the total generation available at any time should
be in excess of the total anticipated load demand and any system loss
by an amount not less than a specified minimum spare capacity, PSP
(called the Spinning Reserve) given by:
PlG (Generation) ≥ Σ Pl (Losses) + PSP + PDj (Load)(8)
Thermal Constraints:
For transmission lines of the given system:
- Si
min
≤ Sbi ≤ Si
max
i = 1,2,….nb, the number of branches,
where, Sbi is the branch transfer MVA. (9)
Bus voltage and Bus angle Constraints:
Bus voltage and Bus angle Constraints are needed to maintain a
flat bus voltage profile and to limit the overloading respectively.
- Vi
min
≤ Vi ≤ Vi
max
i = 1,2,….n
- δij
min
≤ δij ≤ δij
max
i =
1,2,….n1,2,….m(10) where, n is the number of nodes
and m is the number of nodes neighboring each node
with interconnecting branches.
w
w
w
.
v
t
u
l
o
o
p
.
c
o
m
Power System Operation And Control 15EE81
Dept of EEE,GMIT Bharathinagar Page 32
i
Other Constraints:
In case of transformer taps, during optimization, it is required to satisfy
the constraint: Ti
min
≤ Ti ≤ T max
(11)
where Ti is the percentage tap setting of the tap changing
transformer used. In case of phase shifting transformers, it is
required to satisfy the constraint:
PSi
min
≤PSi≤PSi
max
(12)
where PSi is the phase shift obtained from the phase shifting transformer used.
SPINNING RESERVE
Spinning reserve (SR) is the term used to describe the total amount of
generation available from all the synchronized (spinning) units of the
system minus the present load plus the losses being supplied. i.e.,
Sp.Res., PSP = {Total generation, Σ PlG} - { Σ PDj(load) + Σ Pl (losses)} (13)
The SR must be made available in the system so that the loss of
one or more units does not cause a large drop in system frequency. SR
must be allocated to different units based on typical Council rules.
One such rule is as follows:
Reserves must be spread around the system to avoid the
problem of ‘bottling of reserves’ and to allow for the various parts of
the system to run as ‘islands’, whenever they become electrically
disconnected
{Qn.: Write a brief note on the following: Spinning Reserve,
constraints in economic operation, performance curves}
w
w
w
.
v
t
u
l
o
o
p
.
c
o
m
Power System Operation And Control 15EE81
Dept of EEE,GMIT Bharathinagar Page 33
w
w
w
.
v
t
u
l
o
o
p
.
c
o
m

15ee81 module1[www.vtuloop.com].pdf

  • 1.
    Power System OperationAnd Control 15EE81 Dept of EEE,GMIT Bharathinagar Page 1 MODULE-1 CONTROL CENTRE OPERATION OF POWERSYSTEMS General Introduction Electrical Technology was founded on the remarkable discovery by Faraday that a changing magnetic flux creates an electric field. Out of that discovery, grew the largest and most complex engineering achievement of man : the electric power system. Indeed, life without electricity is now unimaginable. Electric power systems form the basic infrastructure of a country. Even as we read this, electrical energy is being produced at rates in excess of hundreds of giga- watts (1 GW = 1,000,000,000 W). Giant rotors spinning at speeds up to 3000 rotations per minute bring us the energy stored in the potential energy of water, or in fossil fuels. Yet we notice electricity only when the lights go out! While the basic features of the electrical power system have remained practically unchanged in the past century, but there are some significant milestones in the evolution of electrical power systems. Introduction to SCADA • Control Centre • Digital Computer Configuration • Automatic Generation Control • Area Control Error • Operation Without Central Computers • Expression for Tie Line Flow • Parallel Operation of Generators • Area Lumped Dynamic Model w w w . v t u l o o p . c o m
  • 2.
    Power System OperationAnd Control 15EE81 Dept of EEE,GMIT Bharathinagar Page 2 Introduction Electrical energy is an essential ingredient for the industrial and all round development of any country. It is generated centrally in bulk and transmitted economically over long distances. Electrical energy is conserved at every step in the process of Generation, Transmission, Distribution and utilization of electrical energy. The electrical utility industry is probably the largest and most complex industry in the world and hence very complex and challenging problems to be handled by power engineering particularly, in designing future power system to deliver increasing amounts of electrical energy. This calls for perfect understanding, analysis and decision making of the system. This power system operation and its control play a very important task in the world of Electrical Power Engineering. Power Quality Power quality is characterized by – a) Stable AC voltages at near nominal values and at near rated frequency subject to acceptable minor variations, free from annoying voltage flicker, voltage sags and frequency fluctuations. b) Near sinusoidal current and voltage wave forms free from higher order harmonics Effects of Poor Power Quality  Maloperation of control devices, relays etc.  Extra losses in capacitors, transformers and rotating machines  Fast ageing of equipments  Loss of production due to service interruptions  Electro-magnetic interference due to transients  power fluctuation not tolerated by power electronic parts w w w . v t u l o o p . c o m
  • 3.
    Power System OperationAnd Control 15EE81 Dept of EEE,GMIT Bharathinagar Page 3 Major causes of Poor Power Quality  Nonlinear Loads  Adjustable speed drives  Traction Drives  Start of large motor loads  Arc furnaces  Intermittent load transients  Lightning  Switching Operations  Fault Occurrences Steps to address Power Quality issues  Detailed field measurements  Monitor electrical parameters at various places to assess the operating conditions in terms of power quality.  Detailed studies using a computer model. The accuracy of computer model is first built to the degree where the observed simulation values matches with those of the field  For the purpose of the analysis we may use load flow studies, dynamic simulations, EMTP simulations, harmonic analysis depending on the objectives of the studies.  We also evaluate the effectiveness of harmonic filters through the computer model built, paying due attention to any reactive power compensation thatthese filters may provide at fundamental frequency for normal system operating conditions.  The equipment ratings will also be addressed to account for harmonic w w w . v t u l o o p . c o m
  • 4.
    Power System OperationAnd Control 15EE81 Dept of EEE,GMIT Bharathinagar Page 4 current flows and consequent overheating. Power Quality Solutions: Poor power quality in the form of harmonic distortion or low power factor increases stress on a facility’s electrical system. Over time this increased electrical stress will shorten the life expectancy of electrical equipment. In addition to system degradation, poor power quality can cause nuisance tripping and unplanned shutdowns within electrical system. In an increasingly automated electrical world, it is important for a facility to evaluate power quality. Harmonic distortion, low power factor, and the presence of other transients can cause severe damage to electrical system equipment. PSE provides system analysis and evaluation of power quality issues and makes recommendations for system design solutions Structure of PowerSystems Generating Stations, transmission lines and the distribution systems are the main components of an electric power system. Generating stations and distribution systems are connected through transmission lines, which also connect one power system (grid, area) to another. A distribution system connects all the loads in a particular area to the transmission lines. For economical technical reasons, individual power systems are organized in the form of electrically connected areas or regional grids. As power systems increased in size, so did the number of lines, substations, transformers, switchgear etc. Their operation and interactions became more complex and hence it is necessary to monitor this information simultaneously for the total system at a focal point called as Energy Control Centre. The fundamental design feature is increase in system reliability and economic feasibility. w w w . v t u l o o p . c o m
  • 5.
    Power System OperationAnd Control 15EE81 Dept of EEE,GMIT Bharathinagar Page 5 Major Concerns of Power System Design and Operation  Quality : Continuous at desired frequency and voltage level  Reliability :Minimum failure rate of components and systems  Security : Robustness - normal state even after disturbances  Stability : Maintain synchronism underdisturbances  Economy : Minimize Capital, running and maintenance Costs Need for Power System  Demand for Power Increasing No of transmission line, Sub-stations, Transformers, switchgear etc.,  Operation and Interaction is more and more complex  Essential to monitor simultaneously for the total system at a focal point – ENERGY LOAD CENTRE Components of power system operation and control Energy Load Centre The function of energy load centre is to control the function of coordinating the response in both normal and emergency conditions. Digital Computers are very effectively used for the purpose. Their function is to process the data, detect abnormalities, alarm the human operator by lights, buzzers, screens etc., depending on the severity of the problem. Control Centre of a Power System • Human Machine Interface – equipped with w w w . v t u l o o p . c o m
  • 6.
    Power System OperationAnd Control 15EE81 Dept of EEE,GMIT Bharathinagar Page 6 • CRT presentations • Keyboards – change parameters • Special function keyboards- alter transformer taps, switch line capacitors etc., • Light-Pen cursor – open or close circuit breakers • Alarm lights, alarms, dedicated telephone communications with generating stations and transmission substations, neighboring power utilities Control Features – ControlCentre • System Commands – Mode of control • Units – base / peak load • AGC – Automatic Generation Control • Data Entry • Alarms – To find source of alarm and necessary action • Plant/Substation selection • Special Functions - To send/retrieve data etc., • Readout control – Output to CRT/printers etc., • CPU control – Selection for the computer Functions of ControlCentre • Short, Medium and Long-term Load Forecasting • System Planning • Unit Commitment and maintenance Scheduling • Security Monitoring • State Estimation w w w . v t u l o o p . c o m
  • 7.
    Power System OperationAnd Control 15EE81 Dept of EEE,GMIT Bharathinagar Page 7 • Economic Dispatch • Load Frequency Control SCADA – Supervisory Control and Data Acquisition One of key processes of SCADA is the ability to monitor an entire system in real time. This is facilitated by data acquisitions including meter reading, checking statuses of sensors, etc that are communicated at regular intervals depending on the system. A well planned and implemented SCADA system not only helps utilities deliver power reliably and safely to their customers but it also helps to lower the costs and achieve higher customer satisfaction and retention. SCADA – Why do we need it?  If we did not have SCADA, we would have very inefficient use of human resources and this would cost us (Rs,Rs,Rs)  In today’s restructured environment SCADA is critical in handling the volume of data needed in a timely fashion  Service restoration would involve travel time and would be significantly higher  It is essential to maintain reliability SCADA - Architecture • Basic elements are sensors which measure the desired quantities • Current Transformers CTs – measure currents and Potential Transformers PTs- measure voltages. w w w . v t u l o o p . c o m
  • 8.
    Power System OperationAnd Control 15EE81 Dept of EEE,GMIT Bharathinagar Page 8 • Today there is a whole new breed of Intelligent electronic devices (IEDs) • This data is fed to a remote terminal unit (RTU) • The master computer or unit resides at the control center EMS SCADA - Process • Master unit scan RTUs for reports, if reports exist, RTU sends back the data and the master computer places it in memory • In some new substation architectures there could be significant local processing of data which could then be sent to the control center. • The data is then displayed on CRTs and printed SCADA - Logging • The SCADA provides a complete log of the system • The log could be provided for the entire system or part of the system • Type of information provided – Time of event – Circuit breaker status – Current measurements, voltage measurements, calculated flows, energy, etc. – Line and equipment ratings SCADA as aSystem There are many parts of a working SCADA system. A SCADA system usually includes signal hardware (input and output), controllers, networks, user interface (HMI), communications equipment and software. All together, the term SCADA refers to the entire central system. The central system usually monitors data from various sensors that are either in close proximity or off site (sometimes w w w . v t u l o o p . c o m
  • 9.
    Power System OperationAnd Control 15EE81 Dept of EEE,GMIT Bharathinagar Page 9 miles away). For the most part, the brains of a SCADA system are performed by the Remote Terminal Units (sometimes referred to as the RTU). The Remote Terminal Units consists of a programmable logic converter. The RTU are usually set to specific requirements, however, most RTU allow human intervention, for instance, in a factory setting, the RTU might control the setting of a conveyer belt, and the speed can be changed or overridden at any time by human intervention. In addition, any changes or errors are usually automatically logged for and/or displayed. Most often, a SCADA system will monitor and make slight changes to function optimally; SCADA systems are considered closed loop systems and run with relatively little human intervention. SCADA can be seen as a system with many data elements called points. Usually each point is a monitor or sensor. Usually points can be either hard or soft. A hard data point can be an actual monitor; a soft point can be seen as an application or software calculation. Data elements from hard and soft points are usually always recorded and logged to create a time stamp or history User Interface – Human Machine Interface (HMI) A SCADA system includes a user interface, usually called Human Machine Interface (HMI). The HMI of a SCADA system is where data is processed and presented to be viewed and monitored by a human operator. This interface usually includes controls where the individual can interface with the SCADA system. HMI's are an easy way to standardize the facilitation of monitoring multiple RTU's or PLC's (programmable logic controllers). Usually RTU's or PLC's will run a pre programmed process, but monitoring each of them individually can be difficult, usually because they are spread out over the system. w w w . v t u l o o p . c o m
  • 10.
    Power System OperationAnd Control 15EE81 Dept of EEE,GMIT Bharathinagar Page 10 Because RTU's and PLC's historically had no standardized method to display or present data to an operator, the SCADA system communicates with PLC's throughout the system network and processes information that is easily disseminated by the HMI. HMI's can also be linked to a database, which can use data gathered from PLC's or RTU's to provide graphs on trends, logistic info, schematics for a specific sensor or machine or even make troubleshooting guides accessible. In the last decade, practically all SCADA systems include an integrated HMI and PLC device making it extremely easy to run and monitor a SCADA system. Today’s SCADA systems, in response to changing business needs, have added new functionalities and are aiding strategic advancements towards interactive, self healing smart grids of the future. A modern SCADA system is also a strategic investment which is a must-have for utilities of all sizes facing the challenges of the competitive market and increased levels of real time data exchange that comes with it (Independent Market Operator, Regional Transmission Operator, Major C&I establishments etc). A well planned and implemented SCADA system not only helps utilities deliver power reliably and safely to their customers but it also helps to lower the costs and achieve higher customer satisfaction and retention. Modern SCADA systems are already contributing and playing a key role at many utilities towards achieving :  New levels in electric grid reliability – increased revenue.  Proactive problem detection and resolution – higher reliability.  Meeting the mandated power quality requirements – increased customer satisfaction.  Real time strategic decision making – cost reductions and increased revenue w w w . v t u l o o p . c o m
  • 11.
    Power System OperationAnd Control 15EE81 Dept of EEE,GMIT Bharathinagar Page 11 Critical Functions of SCADA Following functions are carried out every 2 seconds : • Switchgear Position, Transformer taps, Capacitor banks • Tie line flows and interchange schedules • Generator loads, voltage etc., • Verification on links between computer and remote equipment Modern SCADA systems are already contributing and playing a key role at many utilities towards achieving : • - New levels in electric grid reliability – increased revenue. • - Proactive problem detection and resolution – higher reliability. • - Meeting the mandated power quality requirements – increased customer satisfaction. • - Real time strategic decision making – cost reductions and increased revenue. Digital ComputerConfiguration Major functions - Data acquisition control - Energy Management - System Security For best/secured operation 100% redundancy is used – Dual Digital Computers i) on-line computer – monitors and controls the system ii) Backup computer – load forecasting or hydro thermal allocations w w w . v t u l o o p . c o m
  • 12.
    Power System OperationAnd Control 15EE81 Dept of EEE,GMIT Bharathinagar Page 12 The digital computers are usually employed in a fixed-cycle operating mode with priority interrupts wherein the computer periodically performs a list of operation. The most critical functions have the fastest scan cycle. Typically the following categoties are scanned every 2 seconds : • All status points such as switchgear position (open or closed), substationloads and voltages, transformer tap positions, and capacitor banks etc., • Tie line flows and interchange schedules • Generator loads, voltage, operating limits and boiler capacity • Telemetry verificationto detect failures and errors in the bilateral communication links between the digital computer and the remote equipment. Important Areas of Concern in power System - Automatic Generation Control(AGC) On-line Computer Control that maintains overall system frequency and net tie- line load exchange through interconnection - Economic Load Dispatch On-line computer control to supply load demand using all interconnected system’s power in the most economical manner AGC is the name given to a control system having three major objectives : a. To hold system frequency at or very close to a specified nominal value (50 or 60Hz) b. To maintain the correct value of interchange power between control areas c. To maintain each unit’s generation at the most economic value. w w w . v t u l o o p . c o m
  • 13.
    Power System OperationAnd Control 15EE81 Dept of EEE,GMIT Bharathinagar Page 13 To implement an AGC system, the following information is required : - Unit megawatt output of each committed unit - Megawatt flow over each tie line to neighboring systems - System frequency Usually, neighboring power companies are interconnected by one or more transmission lines called Tie Lines. The objective is to buy or sell power with neighboring systems whose operating costs make such transactions profitable. Also, even if no power is being transmitted over ties to neighboring system, if one system has a sudden loss of a generating unit, the units throught all the interconnection will experience a frequency change and can help in restoring frequency. Advantages of interconnectedsystem  Reduces Reserve Capacity – thus reduces installed capacity  Capital Cost/kW is less for larger Unit  in India single unit can support >500MW because of interconnection  Effective Use of Generators  Optimization of Generation – installed capacity is reduced  Reliability Disadvantages of interconnectedsystem  Fault get Propagated – calls for fast switchgear  CB rating increases  Proper management required – EMS and it must be automated – Economic load dispatch - Base load and Peak Load w w w . v t u l o o p . c o m
  • 14.
    Power System OperationAnd Control 15EE81 Dept of EEE,GMIT Bharathinagar Page 14 National Regional ElectricityBoards • Northern Regional Electricity Board • Western Regional Electricity Board • Southern Regional Electricity Board • Eastern Regional Electricity Board • North-east Regional Electricity Board Goal–TohaveNationalGridtoimproveefficiencyofthe wholeNational Power Grid Control Area Concept All generators are tightly coupled together to form – Coherent Group - all generators respond to changes in load or speed changer setting Control Area – frequency is assumed to be constant throughout in static and dynamic conditions For the purpose of analysis, a control area can be reduced to a single speed governor, turbo generator and load system Interconnected Power System w w w . v t u l o o p . c o m
  • 15.
    Power System OperationAnd Control 15EE81 Dept of EEE,GMIT Bharathinagar Page 15 Functions - Exchange or sale of power - Disturbed areas taking other area’s help - Long distance sale and transfer of power Area Control Error – ACE To maintain a net interchange of power with its area neighbors, an AGC uses real power flow measurements of all tie linesa emanating from the area and subtracts the scheduled interchange to calculate an error value. The net power interchange, together with a gain, B (MW/0.1Hz), called the frequency bias, as a multiplier on the frequency deviation is called the Area Control Error (ACE) given by, Pk = Power in Tie lIne - +ve – out of the area Ps – Scheduled Power Interchange f0 – Base frequency, fact – Actual frequency +ve ACE indicates flow out of the area. ACE – Input toAGC w w w . v t u l o o p . c o m
  • 16.
    Power System OperationAnd Control 15EE81 Dept of EEE,GMIT Bharathinagar Page 16 The real power summation of ACE loses information as to the flow of individual tie lines but is concerned with area net generation. The tie lines transfer power through the area from one neighbor to the next, called ‘Wheeling Power’. The wheeling power cancels algebraically in the ACE. Thus one area purchases or sells blocks of power (MWh) with non-neighbor utilities. w w w . v t u l o o p . c o m
  • 17.
    Power System OperationAnd Control 15EE81 Dept of EEE,GMIT Bharathinagar Page 17 Power Sale from A to C • A – selling a power ‘p’ to C, then ACE for A = p • Power export starts until its AGC forces ACE to become zero • Area C introduces ‘-p’ into its ACE • Power flows in to area C until its ACE becomes zero • Areas B & C must be aware of the power exchange as they are also interconnected The minimum requirements of AGC on controlling the interchange of power and frequency have been established by NERC – North American Electric Reliability Council, which is comprised of representatives of the major operating power pools. This committee specifies the following criteria as minimum performance expected by AGC. A. Normal System Conditions - ACE = 0 at least once in 10 min period - Deviation of ACE from zero must be within allowable limits B. Disturbances Conditions - ACE must return to zero within 10 min - Corrective action from AGC must be within a minimum disturbance w w w . v t u l o o p . c o m
  • 18.
    Power System OperationAnd Control 15EE81 Dept of EEE,GMIT Bharathinagar Page 18 Daily Load Cycle The allowable limit, Ld of the average deviation on power systems (averaged over 10 minutes) is : Ld = 0.025∆L + 5.0 MW ∆L = ∆P/ ∆t MW/hr The value of ∆L is determined annually and is taken from the daily load cycle. A power system is said to be in a disturbance condition if the ACE signal exceeds 3Ld. Operation without Central Computers or AGC Power Systems are capable of functioning even without Central Computer and/or AGC - Due to a result of Turbine Generator speed controls in the generatingstation and natural load regulation - Thus generators within an area are forced to w w w . v t u l o o p . c o m
  • 19.
    Power System OperationAnd Control 15EE81 Dept of EEE,GMIT Bharathinagar Page 19 share load and cause interconnected areas to share load Generation Frequency CharacteristicCurve Let there be two independent areas A and B without tie line flow as the circuit breaker is open. Let there be a sudden change in load occurs in the area D. Area A is considered as a single operating area representing the remainder of the interconnection. It is further assumed that the areas share the disturbance in proportion to their generating capacity and operating characteristics. Let the area generation- frequency characteristics be represented by the curve GG which is a composite response curve from all the generators in area A. The characteristic curve has a negative slope with frequency. w w w . v t u l o o p . c o m
  • 20.
    Power System OperationAnd Control 15EE81 Dept of EEE,GMIT Bharathinagar Page 20 The area connected load is defined by the curve LL as shown. As there is increase in load the rotating machinery in the area is forced to increase the speed. Basic Equations GA = G0 +10β1 (fact – f0)MW LA = L0 +10β2 (fact – f0)MW GA = Total Generation, G0 = Base generation LA = Total Load, L0 = Base load, fact = System frequency,f0 = Base frequency, β1 = Cotangent of generation-frequency characteristic, MW/0.1 Hz < 0 β2 = Cotangent of load-frequency characteristic, MW/0.1 Hz > 0 Isolated Operation in A – response to load change w w w . v t u l o o p . c o m
  • 21.
    Power System OperationAnd Control 15EE81 Dept of EEE,GMIT Bharathinagar Page 21 For Steady State Frequency – Total generation = Total effective load This is defined by the intersection of GG and LL curves as shown – Io. Combined characteristic of GG and LL is CC. The composite generation load frequency characteristics is given by, GA = G0 +10β1 (fact – f0), LA = L0 +10β2 (fact – f0) GA - LA = G0 +10β1 (fact – f0) - L0 -10β2 (fact – f0) Increase in load in ‘A’ moves the load frequency curve to position L’L’. The new system frequency will now be defined by the intersection labeled as I1 at 49.9Hz.Then it is desired to return the system frequency to 50.0Hz i.e., point I2. Setting AGC in ‘A’- shifting of GG to G’G’ takes place to meet frequency demand of 50.0Hz – I2 Resulting combined characteristic is C’C’ In terms of increments, ∆A = GA - G0 + L0 - LA = 10β1 (fact – f0) -10β2 (fact – f0) = 10BA XA ∆f MW ∆A = GA - G0 + L0 - LA = 10β1 (fact – f0) -10β2 (fact – f0) = 10BA XA ∆f MW w w w . v t u l o o p . c o m
  • 22.
    Power System OperationAnd Control 15EE81 Dept of EEE,GMIT Bharathinagar Page 22 BA - Natural regulation characteristic - % gen for 0.1Hz XA – Generating Capacity of A, MW Frequency deviation = ∆f = ∆A / 10BA XA Hz Considering Tie line flow, Frequency deviation ∆f = (∆A + ∆TL ) / (10BA XA)Hz ∆A + ∆TL - Net Megawatt change ∆TL = ∆GA - ∆LA Effect of Tie Line Flow - Interconnectedoperation Let two areas A and B are interconnected through a Tie Line. Thus both Generation and Load frequency are equal to 50.0 Hz. There is no initial Tie Line Power Flow. - Disturbance occur at B causing frequency to drop to 49.9Hz - Area generation does not match with effective load in A w w w . v t u l o o p . c o m
  • 23.
    Power System OperationAnd Control 15EE81 Dept of EEE,GMIT Bharathinagar Page 23 - Difference between I1 and I2 – difference between generation and load – net excess power in the area – flows out of A towards B - Contributory effects in A are decrease in load power ∆L and increase in generation ∆G - Tie Line Flow from A to B = ∆TL = (∆GA - ∆LA ) MW - If area A has AGC, tie line flows increases – ∆TL’ and ∆TL’’ representing increased amounts of bias due to AGC. Frequency change due to disturbance ∆B for a tie line power flow from A to B is ∆f = ∆B - ∆TL / (10BB XB) Hz ∆TL = (10BA XA) ∆AB / (10BA XA +10BB XB) MW Net power change in B is = ∆AB - ∆TL = (10BB XB) ∆AB / (10BA XA +10BB XB) ∆AB = (10BA XA+ 10BB XB )∆f Hence, ∆f / ∆AB = 1/(10BA XA+ 10BB XB ) Example Two areas A and B are interconnected. Generating capacity of A is 36,000Mw with regulating characteristic of 1.5%/0.1Hz. B has 4000MW with 1%/0.1Hz. Find each area’s share of +400MW disturbance (load increase) occurring in B and resulting tie line flow. ∆f = ∆AB / (10 BAXA + 10 BBXB = 400 / -10(0.015)(36,000) – 10(0.01)(4000) = -0.06896 Hz w w w . v t u l o o p . c o m
  • 24.
    Power System OperationAnd Control 15EE81 Dept of EEE,GMIT Bharathinagar Page 24 Tie Line flow = ∆TL = (10BA XA) ∆AB / (10BA XA +10BB XB) = 5400*400/4800 = 372.4MW Smallersystemneedonly 27.6MW Frequency regulationismuchbetter Parallel Operation of Generators Tie line flows and frequency droop described for interconnected power areas are composite characteristics based on parallel operation of generators. Each area could maintain its speed w = 2 f, then aload common to both areas, by superposition have the terminal voltage, Vload = V1sinw1t + V2sinw2t, Where, 1&2 represents areas and ‘t’ time in secs. Generator speed versus load characteristics is a function of the type of the governor used on the prime mover- type 0 – for a speed droop system and type 1 – forconstant speed system. Parallel operation of generator with infinite bus The generator characteristic is such that it is loaded to 50% of its capacity when paralleled to the bus. Therefore, Unit speed regulation = R = ∆f(pu)/∆P(pu) w w w . v t u l o o p . c o m
  • 25.
    Power System OperationAnd Control 15EE81 Dept of EEE,GMIT Bharathinagar Page 25 = If it is desired to increase the load on the generator, the prime mover torque is increased, which results in a shift of the speed-droop curve as shown below. The real power flow is given by, P = V1V2 sin(θ1 - θ2) / X , where X = synchronous reactance Parallel operation of two identical units Load w w w . v t u l o o p . c o m
  • 26.
    Power System OperationAnd Control 15EE81 Dept of EEE,GMIT Bharathinagar Page 26 Two generators paralleled have different governor-speed-droop characteristics. Because they are in parallel, power exchange between them forces them to synchronize at a common frequency. Since the two units are of equal capacity having equal regulation are initially operating at 1.0 base speed as shown above. If unit is operated at point A1 satisfies 25% of the total load and unit 2 at point A2 supplies 75%. If the total load is increased to 150%, the frequency decreases to f1. Since the droop curves are linear, unit 1 will increase its load to 50% of rating and unit 2 to be overloaded. Parallel operation of two units with different capacity and regulation The case when two units of different frequency and regulation characteristics are operated in parallel is as shown below. The regulation characteristics are R1 = ∆f(pu) / ∆P1 (pu), R2 = ∆f(pu) / ∆P2 (pu) Initial Loads - P1 and P2, change in load ∆L = ∆P1 + ∆P2 = Equivalent System Regulation = ∆f / ∆L = w w w . v t u l o o p . c o m
  • 27.
    Power System OperationAnd Control 15EE81 Dept of EEE,GMIT Bharathinagar Page 27 Area Lumped DynamicModel The model discussed so far is one macroscopic behavior because there is no effort made to indicate instantaneous power flow within the system due to a tie line disturbance, magnitudes of the internal line flows, the time history of generator phase angles and so on. The power system macro model may be described by means of a block diagram as shown in the block diagram. w w w . v t u l o o p . c o m
  • 28.
    Power System OperationAnd Control 15EE81 Dept of EEE,GMIT Bharathinagar Page 28 HA = Effective Inertia of rotating machinery loads Β2 = Load frequency characteristics, MW/0.1Hz Pirate = Rated power output of Gen ‘i’ ∆Pi = Power Increment for gen ‘i’ 1/Ri = Droop characteristic of gen ‘i’, Hz/MW Analysis – Isolated Power Area without Tie Lines Steady State value of Frequency deviation ∆f for a load change ∆L = ∆A/S Hence, w w w . v t u l o o p . c o m
  • 29.
    Power System OperationAnd Control 15EE81 Dept of EEE,GMIT Bharathinagar Page 29 ∆f/ ∆A = 1/(10β1 - 10 β2) Combining droop characteristics of M gen, Analysis - Isolated Power Area with AGC w w w . v t u l o o p . c o m
  • 30.
    Power System OperationAnd Control 15EE81 Dept of EEE,GMIT Bharathinagar Page 30 CONSTRAINTS IN ECONOMIC OPERATION OF POWER SYSTEMS: Various constraints are imposed on the problem of economic operation of power systems as listed below: Primary constraints (equality constraints): Power balance equations: Pi - PDi - Pl =0; Qi - QDi - Ql =0; i=buses of the system(5) where,Pl= Σ‖ViVjYij‖ cos (δij-θij); Ql= Σ‖ViVjYij‖ sin (δij-θij); j = 1,2,….n, are the power flow to the neighboring system.(6) w w w . v t u l o o p . c o m
  • 31.
    Power System OperationAnd Control 15EE81 Dept of EEE,GMIT Bharathinagar Page 31 i The above constraints arise due to the need for the system to balance the generation and load demand of the system. Secondary constraints (inequality constraints): These arise due to physical and operational limitations of the units and components. Pi min ≤ Pi ≤ P max Qi min ≤ Qi ≤ Qi max i = 1,2,….n, the number of generating units in the system. (7) Spare Capacity Constraints: These are used to account for the errors in load prediction, any sudden or fast change in load demand, inadvertent loss of scheduled generation, etc. Here, the total generation available at any time should be in excess of the total anticipated load demand and any system loss by an amount not less than a specified minimum spare capacity, PSP (called the Spinning Reserve) given by: PlG (Generation) ≥ Σ Pl (Losses) + PSP + PDj (Load)(8) Thermal Constraints: For transmission lines of the given system: - Si min ≤ Sbi ≤ Si max i = 1,2,….nb, the number of branches, where, Sbi is the branch transfer MVA. (9) Bus voltage and Bus angle Constraints: Bus voltage and Bus angle Constraints are needed to maintain a flat bus voltage profile and to limit the overloading respectively. - Vi min ≤ Vi ≤ Vi max i = 1,2,….n - δij min ≤ δij ≤ δij max i = 1,2,….n1,2,….m(10) where, n is the number of nodes and m is the number of nodes neighboring each node with interconnecting branches. w w w . v t u l o o p . c o m
  • 32.
    Power System OperationAnd Control 15EE81 Dept of EEE,GMIT Bharathinagar Page 32 i Other Constraints: In case of transformer taps, during optimization, it is required to satisfy the constraint: Ti min ≤ Ti ≤ T max (11) where Ti is the percentage tap setting of the tap changing transformer used. In case of phase shifting transformers, it is required to satisfy the constraint: PSi min ≤PSi≤PSi max (12) where PSi is the phase shift obtained from the phase shifting transformer used. SPINNING RESERVE Spinning reserve (SR) is the term used to describe the total amount of generation available from all the synchronized (spinning) units of the system minus the present load plus the losses being supplied. i.e., Sp.Res., PSP = {Total generation, Σ PlG} - { Σ PDj(load) + Σ Pl (losses)} (13) The SR must be made available in the system so that the loss of one or more units does not cause a large drop in system frequency. SR must be allocated to different units based on typical Council rules. One such rule is as follows: Reserves must be spread around the system to avoid the problem of ‘bottling of reserves’ and to allow for the various parts of the system to run as ‘islands’, whenever they become electrically disconnected {Qn.: Write a brief note on the following: Spinning Reserve, constraints in economic operation, performance curves} w w w . v t u l o o p . c o m
  • 33.
    Power System OperationAnd Control 15EE81 Dept of EEE,GMIT Bharathinagar Page 33 w w w . v t u l o o p . c o m