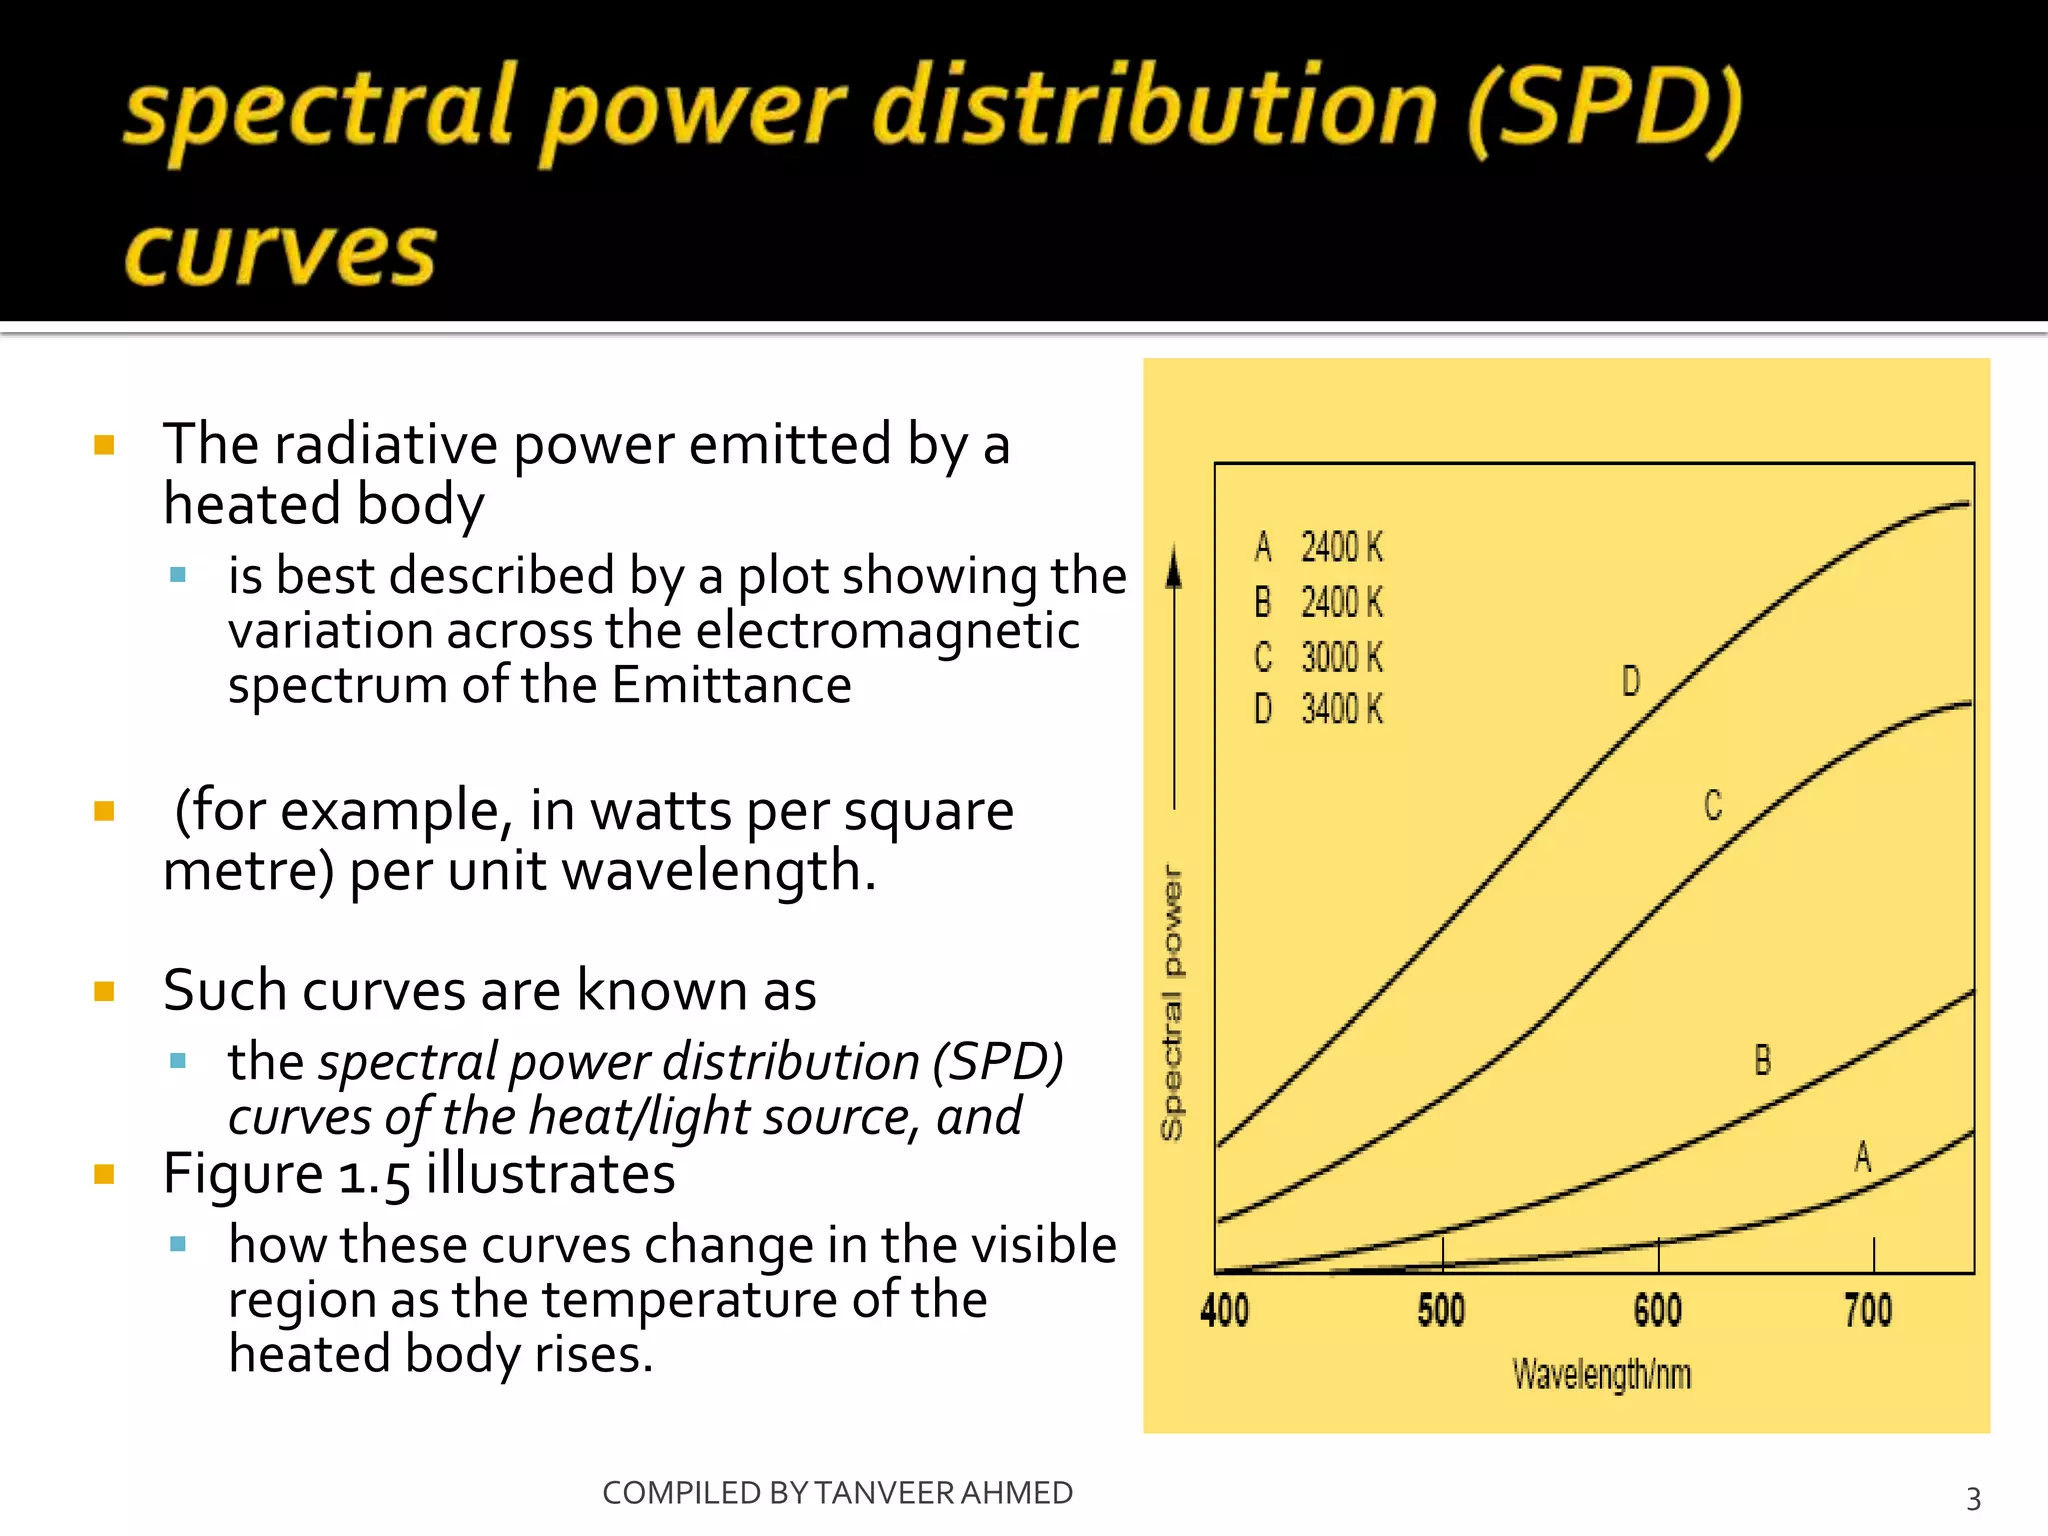
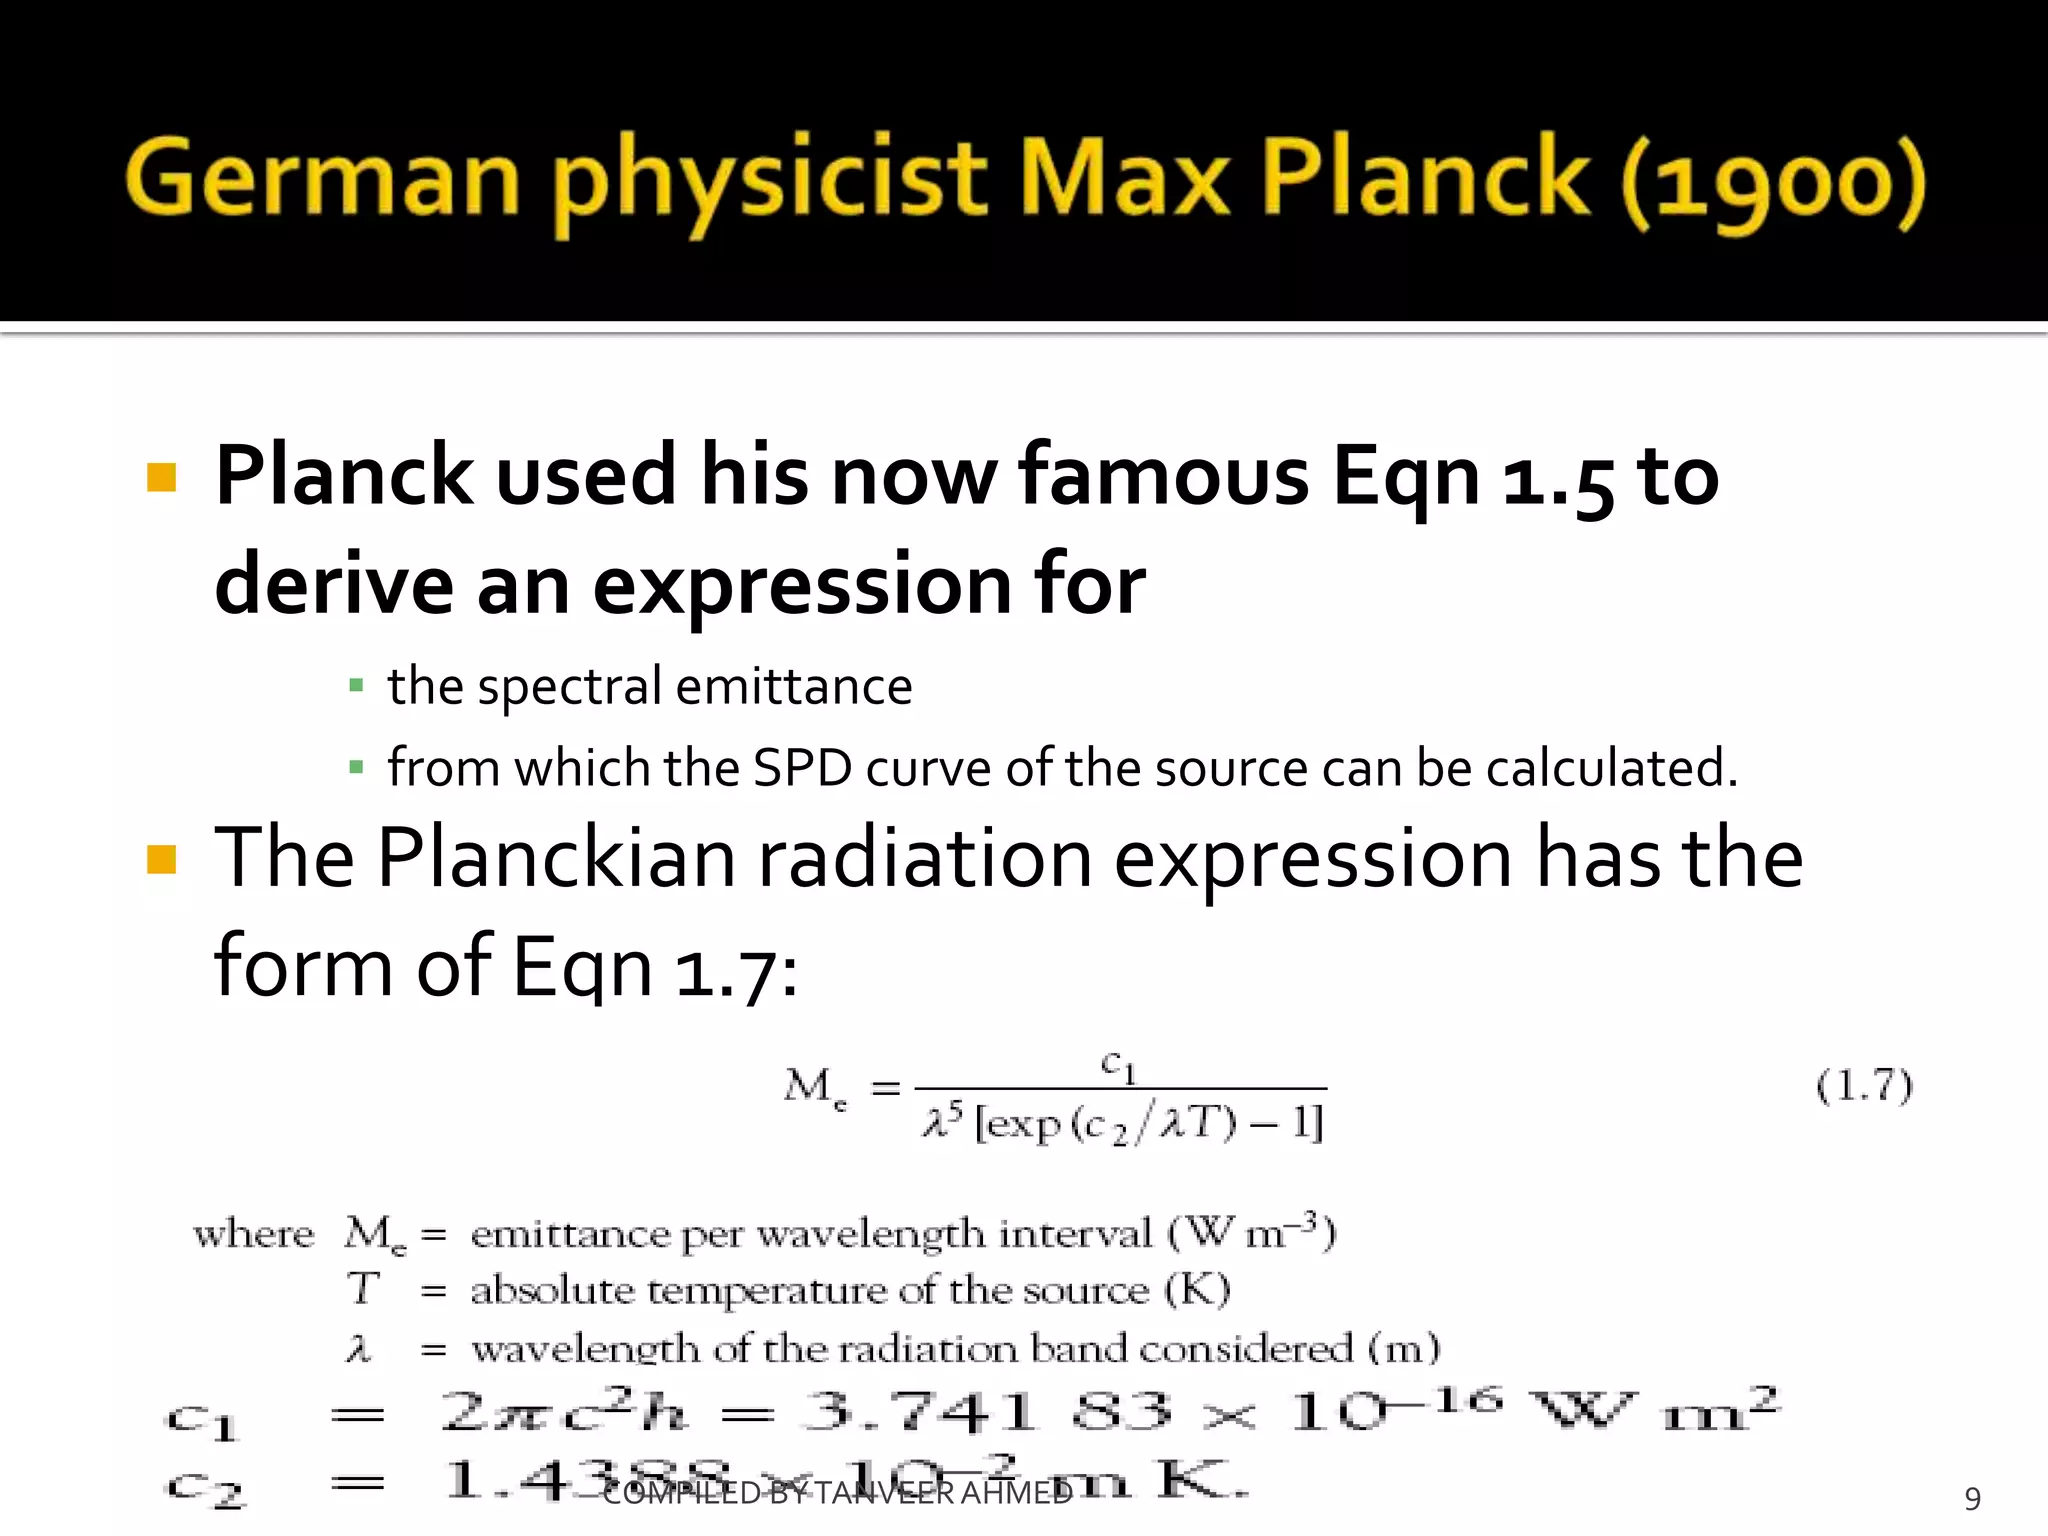
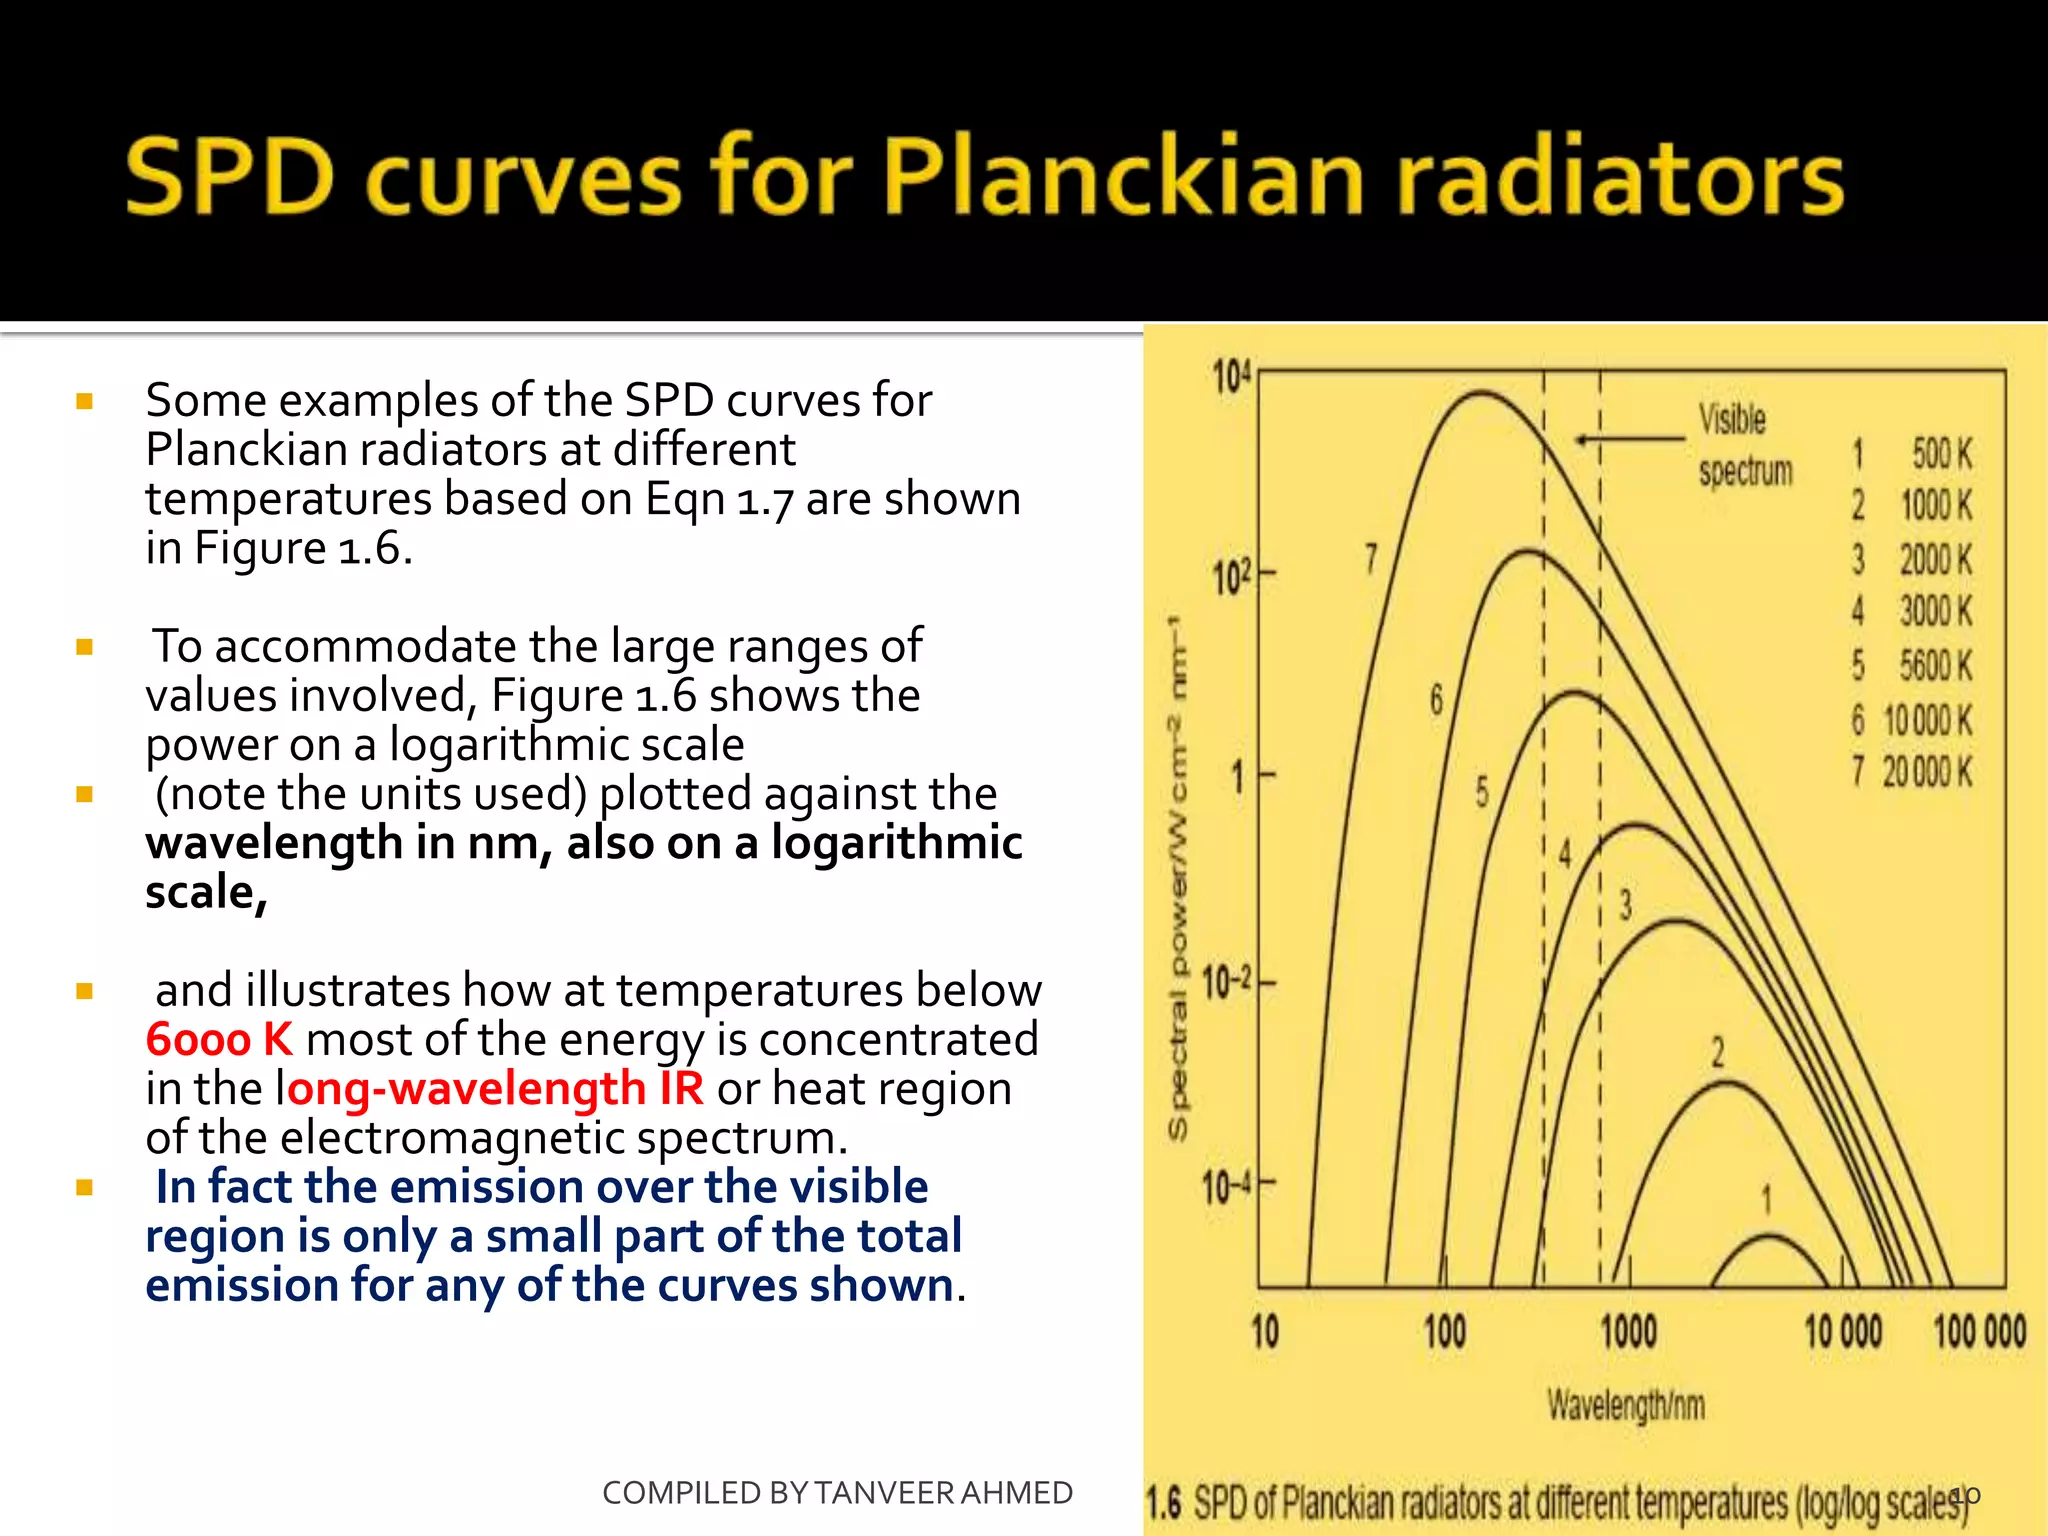
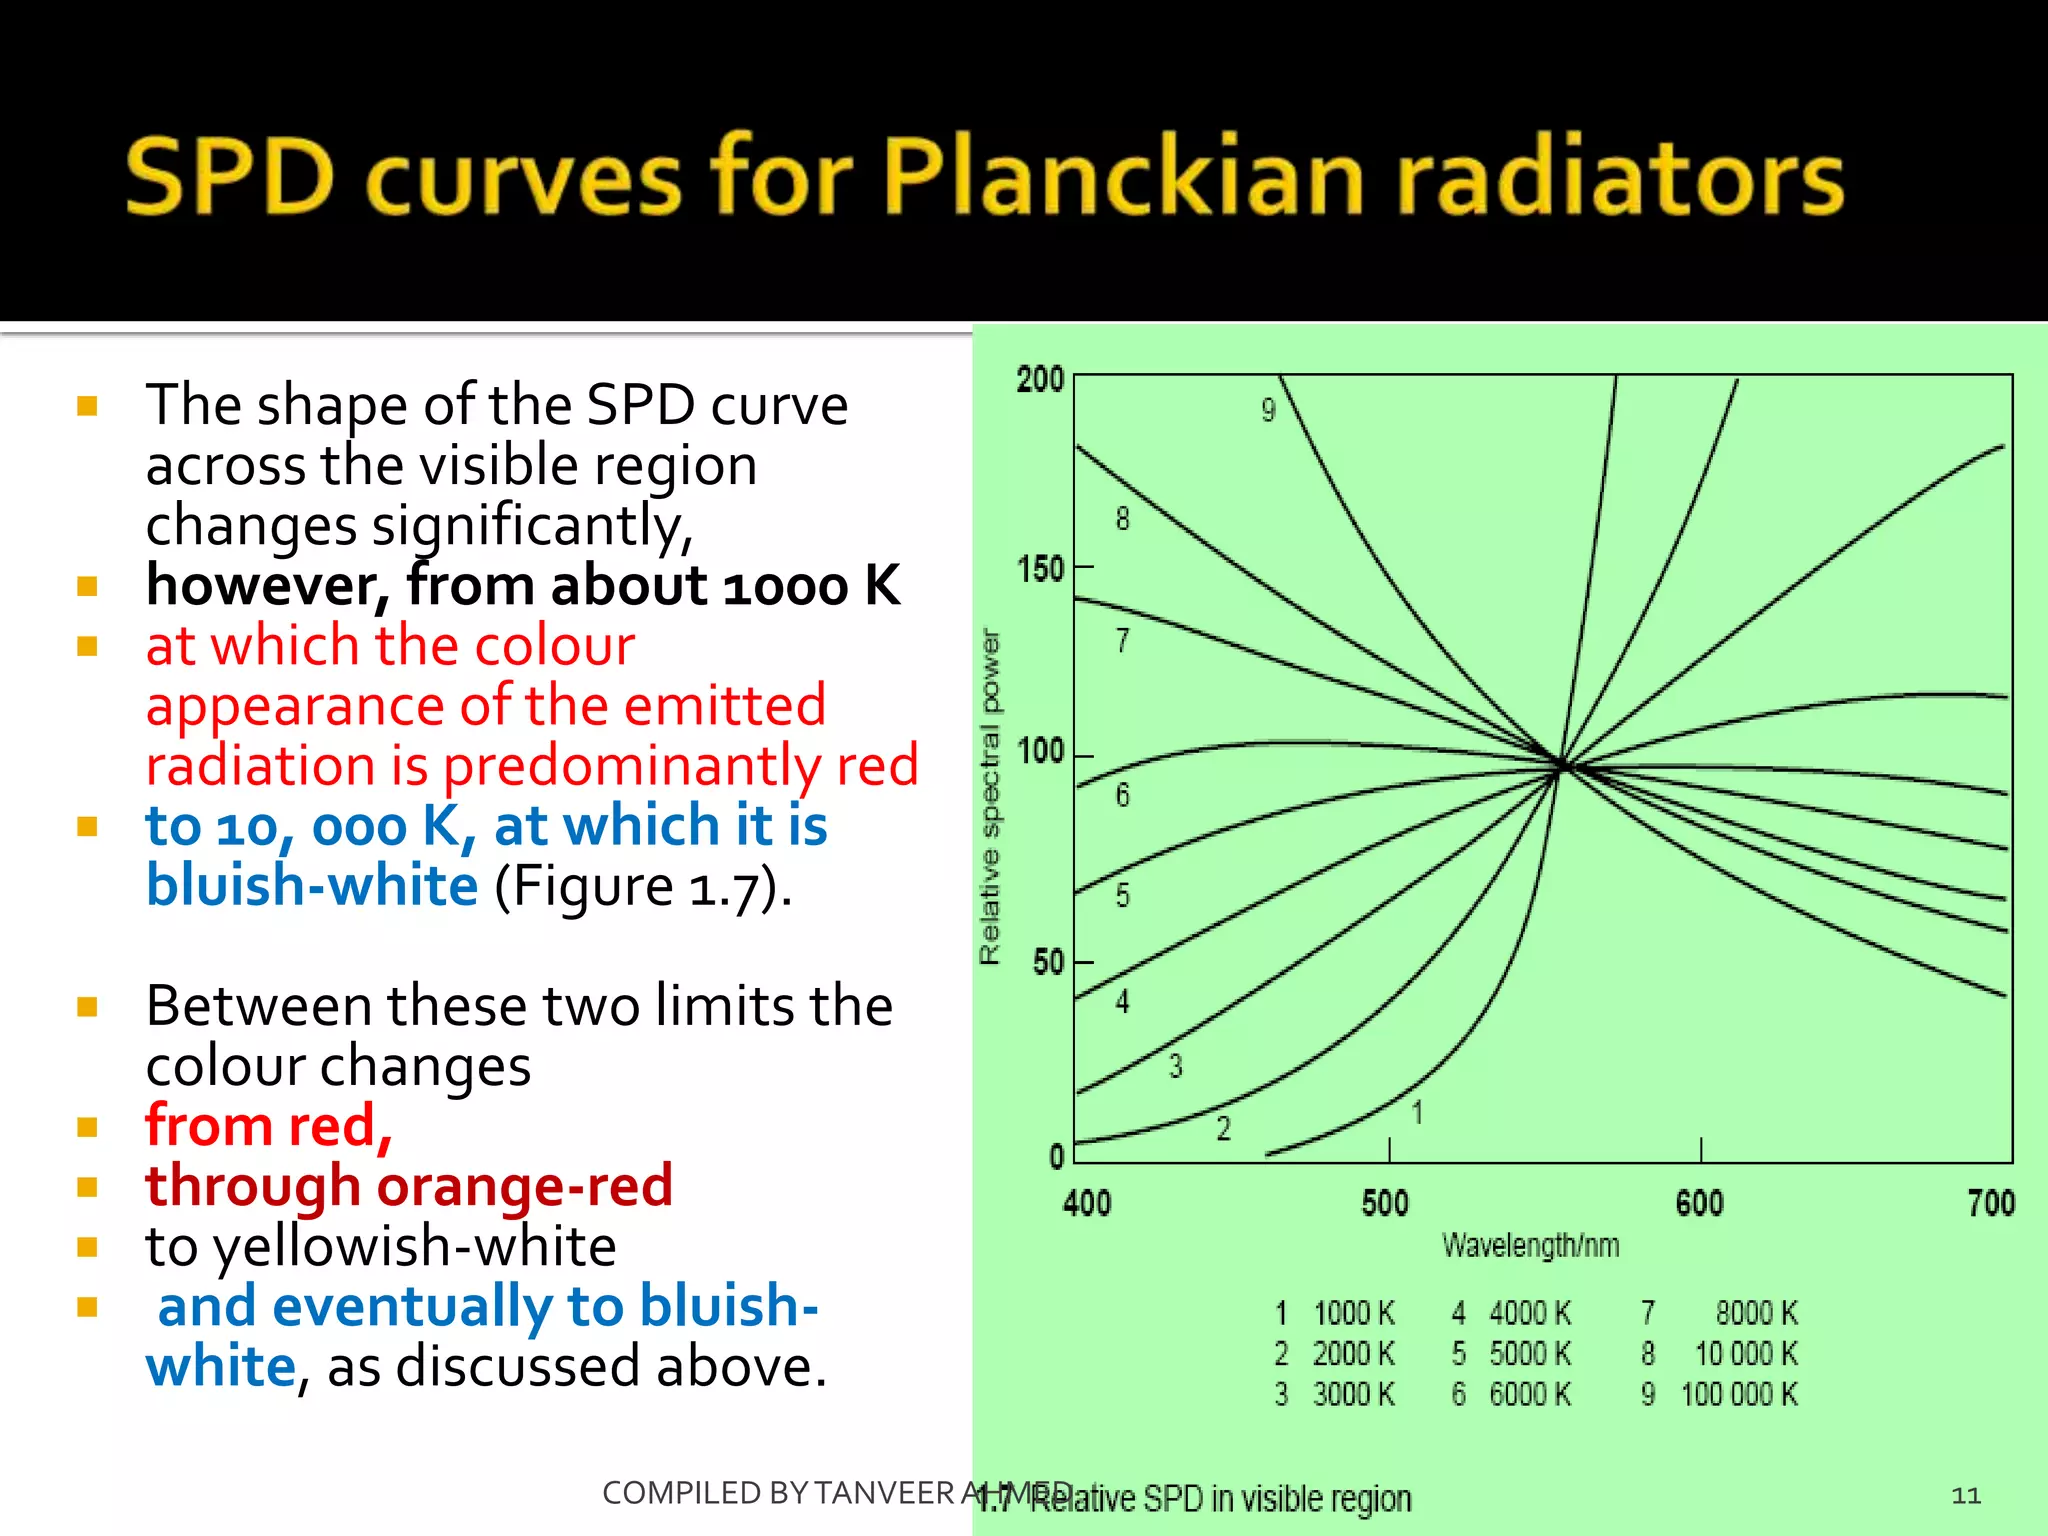
spectral power distribution (SPD) curves of the heat/light source,


                   COMPILED BY TANVEER AHMED                         1
   When a coal fire is lit
   (or when the bar of an electric fire is switched
    on), it first of all
       ▪ glows a dull red,
       ▪ then orange-red,
       ▪ then yellow;
   eventually it approaches the ‘white-hot’ stage
    as the temperature rises.
   At the same time the total amount of energy
    emitted rises (the fire gets steadily hotter).

                  COMPILED BY TANVEER AHMED            2
   The radiative power emitted by a
    heated body
     is best described by a plot showing the
      variation across the electromagnetic
      spectrum of the Emittance

   (for example, in watts per square
    metre) per unit wavelength.
   Such curves are known as
     the spectral power distribution (SPD)
      curves of the heat/light source, and
   Figure 1.5 illustrates
     how these curves change in the visible
      region as the temperature of the
      heated body rises.

                      COMPILED BY TANVEER AHMED   3
   A Planckian or black body radiator is an
    idealised radiation source consisting of a
      ▪ heated enclosure from which radiation escapes through
        an opening whose area is small
      ▪ compared to the total internal surface area of the
        enclosure
   (in practice approximated to by a small hole
    in the side of a large furnace).


                COMPILED BY TANVEER AHMED                       4
   The term ‘black body’ was originally used in
    recognition that
       ▪   such a model source would radiate energy perfectly
       ▪    and conversely would absorb light perfectly,
       ▪   without reflecting any of it away,
       ▪   in the manner of an ideal black object.


   Nowadays such a model source is referred to
    as an ideal, full or Planckian radiator.
                   COMPILED BY TANVEER AHMED                    5
   The Austrian physicist Josef Stefan showed
    in 1879 that
     the total radiation emitted
     by such a heated body
     depended only on its temperature


   and was independent of
      ▪ the nature of the material from which it was
        constructed.

                 COMPILED BY TANVEER AHMED             6
   Considerable debate about the spectral
    distribution from these
       ▪ so-called black bodies ensued,
    in which many of the world’s leading
    theoretical and practical physicists joined:
    these included
       ▪ Wien,
       ▪ Jeans
       ▪ and Lord Rayleigh.


                 COMPILED BY TANVEER AHMED         7
   In 1900, however, the German physicist Max Planck
    developed a theoretical treatment that
      ▪ correctly predicted the form of the spectral power distribution curves
      ▪ for different temperatures

   (it took the support of Einstein in 1905 to convince the
    sceptics).
   Planck’s breakthrough came through the assumption
   that
      ▪ radiation was not emitted continuously
      ▪ but only in small packets or quanta,
      ▪ With the energy of the quantum being directly proportional to the
        frequency of the radiation involved


                    COMPILED BY TANVEER AHMED                                    8
   Planck used his now famous Eqn 1.5 to
    derive an expression for
       ▪ the spectral emittance
       ▪ from which the SPD curve of the source can be calculated.
   The Planckian radiation expression has the
    form of Eqn 1.7:


                 COMPILED BY TANVEER AHMED                           9
   Some examples of the SPD curves for
    Planckian radiators at different
    temperatures based on Eqn 1.7 are shown
    in Figure 1.6.
 To accommodate the large ranges of
  values involved, Figure 1.6 shows the
  power on a logarithmic scale
 (note the units used) plotted against the
  wavelength in nm, also on a logarithmic
  scale,
  and illustrates how at temperatures below
  6000 K most of the energy is concentrated
  in the long-wavelength IR or heat region
  of the electromagnetic spectrum.
 In fact the emission over the visible
  region is only a small part of the total
  emission for any of the curves shown.


                        COMPILED BY TANVEER AHMED   10
 The shape of the SPD curve
  across the visible region
  changes significantly,
 however, from about 1000 K
 at which the colour
  appearance of the emitted
  radiation is predominantly red
 to 10, 000 K, at which it is
  bluish-white (Figure 1.7).
   Between these two limits the
    colour changes
   from red,
   through orange-red
   to yellowish-white
    and eventually to bluish-
    white, as discussed above.
                     COMPILED BY TANVEER AHMED   11
   The closest approach to the
   ideal equi-energy (ideal white light) source
    with constant emittance
     ▪ across the visible spectrum
     ▪ occurs somewhere between 5000 and 6000 K.
   Thus we can associate the colour appearance
    of the source with the temperature
       ▪ at which a Planckian radiator will give approximately the same
         colour appearance.


                 COMPILED BY TANVEER AHMED                                12
   The precise connection between
        ▪ colour temperature
        ▪ and Planckian radiator temperature
        ▪ (and that of correlated colour temperature)
   is best discussed through a plot of
        ▪ the colour coordinates of the Planckian radiators on a suitable CIE
          chromaticity diagram
   The typical 100 W domestic tungsten light bulb has a
        ▪ colour temperature of about 2800 K.
   That of a tungsten–halogen projector bulb
        ▪ is about 3100 K,
   whilst that of average daylight from an overcast sky
        ▪ is about 6500 K.

                   COMPILED BY TANVEER AHMED                                    13

1.3 planckian radiators and colour temperature

  • 1.
    spectral power distribution(SPD) curves of the heat/light source, COMPILED BY TANVEER AHMED 1
  • 2.
    When a coal fire is lit  (or when the bar of an electric fire is switched on), it first of all ▪ glows a dull red, ▪ then orange-red, ▪ then yellow;  eventually it approaches the ‘white-hot’ stage as the temperature rises.  At the same time the total amount of energy emitted rises (the fire gets steadily hotter). COMPILED BY TANVEER AHMED 2
  • 3.
    The radiative power emitted by a heated body  is best described by a plot showing the variation across the electromagnetic spectrum of the Emittance  (for example, in watts per square metre) per unit wavelength.  Such curves are known as  the spectral power distribution (SPD) curves of the heat/light source, and  Figure 1.5 illustrates  how these curves change in the visible region as the temperature of the heated body rises. COMPILED BY TANVEER AHMED 3
  • 4.
    A Planckian or black body radiator is an idealised radiation source consisting of a ▪ heated enclosure from which radiation escapes through an opening whose area is small ▪ compared to the total internal surface area of the enclosure  (in practice approximated to by a small hole in the side of a large furnace). COMPILED BY TANVEER AHMED 4
  • 5.
    The term ‘black body’ was originally used in recognition that ▪ such a model source would radiate energy perfectly ▪ and conversely would absorb light perfectly, ▪ without reflecting any of it away, ▪ in the manner of an ideal black object.  Nowadays such a model source is referred to as an ideal, full or Planckian radiator. COMPILED BY TANVEER AHMED 5
  • 6.
    The Austrian physicist Josef Stefan showed in 1879 that  the total radiation emitted  by such a heated body  depended only on its temperature  and was independent of ▪ the nature of the material from which it was constructed. COMPILED BY TANVEER AHMED 6
  • 7.
    Considerable debate about the spectral distribution from these ▪ so-called black bodies ensued,  in which many of the world’s leading theoretical and practical physicists joined: these included ▪ Wien, ▪ Jeans ▪ and Lord Rayleigh. COMPILED BY TANVEER AHMED 7
  • 8.
    In 1900, however, the German physicist Max Planck developed a theoretical treatment that ▪ correctly predicted the form of the spectral power distribution curves ▪ for different temperatures  (it took the support of Einstein in 1905 to convince the sceptics).  Planck’s breakthrough came through the assumption  that ▪ radiation was not emitted continuously ▪ but only in small packets or quanta, ▪ With the energy of the quantum being directly proportional to the frequency of the radiation involved COMPILED BY TANVEER AHMED 8
  • 9.
    Planck used his now famous Eqn 1.5 to derive an expression for ▪ the spectral emittance ▪ from which the SPD curve of the source can be calculated.  The Planckian radiation expression has the form of Eqn 1.7: COMPILED BY TANVEER AHMED 9
  • 10.
    Some examples of the SPD curves for Planckian radiators at different temperatures based on Eqn 1.7 are shown in Figure 1.6.  To accommodate the large ranges of values involved, Figure 1.6 shows the power on a logarithmic scale  (note the units used) plotted against the wavelength in nm, also on a logarithmic scale,  and illustrates how at temperatures below 6000 K most of the energy is concentrated in the long-wavelength IR or heat region of the electromagnetic spectrum.  In fact the emission over the visible region is only a small part of the total emission for any of the curves shown. COMPILED BY TANVEER AHMED 10
  • 11.
     The shapeof the SPD curve across the visible region changes significantly,  however, from about 1000 K  at which the colour appearance of the emitted radiation is predominantly red  to 10, 000 K, at which it is bluish-white (Figure 1.7).  Between these two limits the colour changes  from red,  through orange-red  to yellowish-white  and eventually to bluish- white, as discussed above. COMPILED BY TANVEER AHMED 11
  • 12.
    The closest approach to the  ideal equi-energy (ideal white light) source with constant emittance ▪ across the visible spectrum ▪ occurs somewhere between 5000 and 6000 K.  Thus we can associate the colour appearance of the source with the temperature ▪ at which a Planckian radiator will give approximately the same colour appearance. COMPILED BY TANVEER AHMED 12
  • 13.
    The precise connection between ▪ colour temperature ▪ and Planckian radiator temperature ▪ (and that of correlated colour temperature)  is best discussed through a plot of ▪ the colour coordinates of the Planckian radiators on a suitable CIE chromaticity diagram  The typical 100 W domestic tungsten light bulb has a ▪ colour temperature of about 2800 K.  That of a tungsten–halogen projector bulb ▪ is about 3100 K,  whilst that of average daylight from an overcast sky ▪ is about 6500 K. COMPILED BY TANVEER AHMED 13