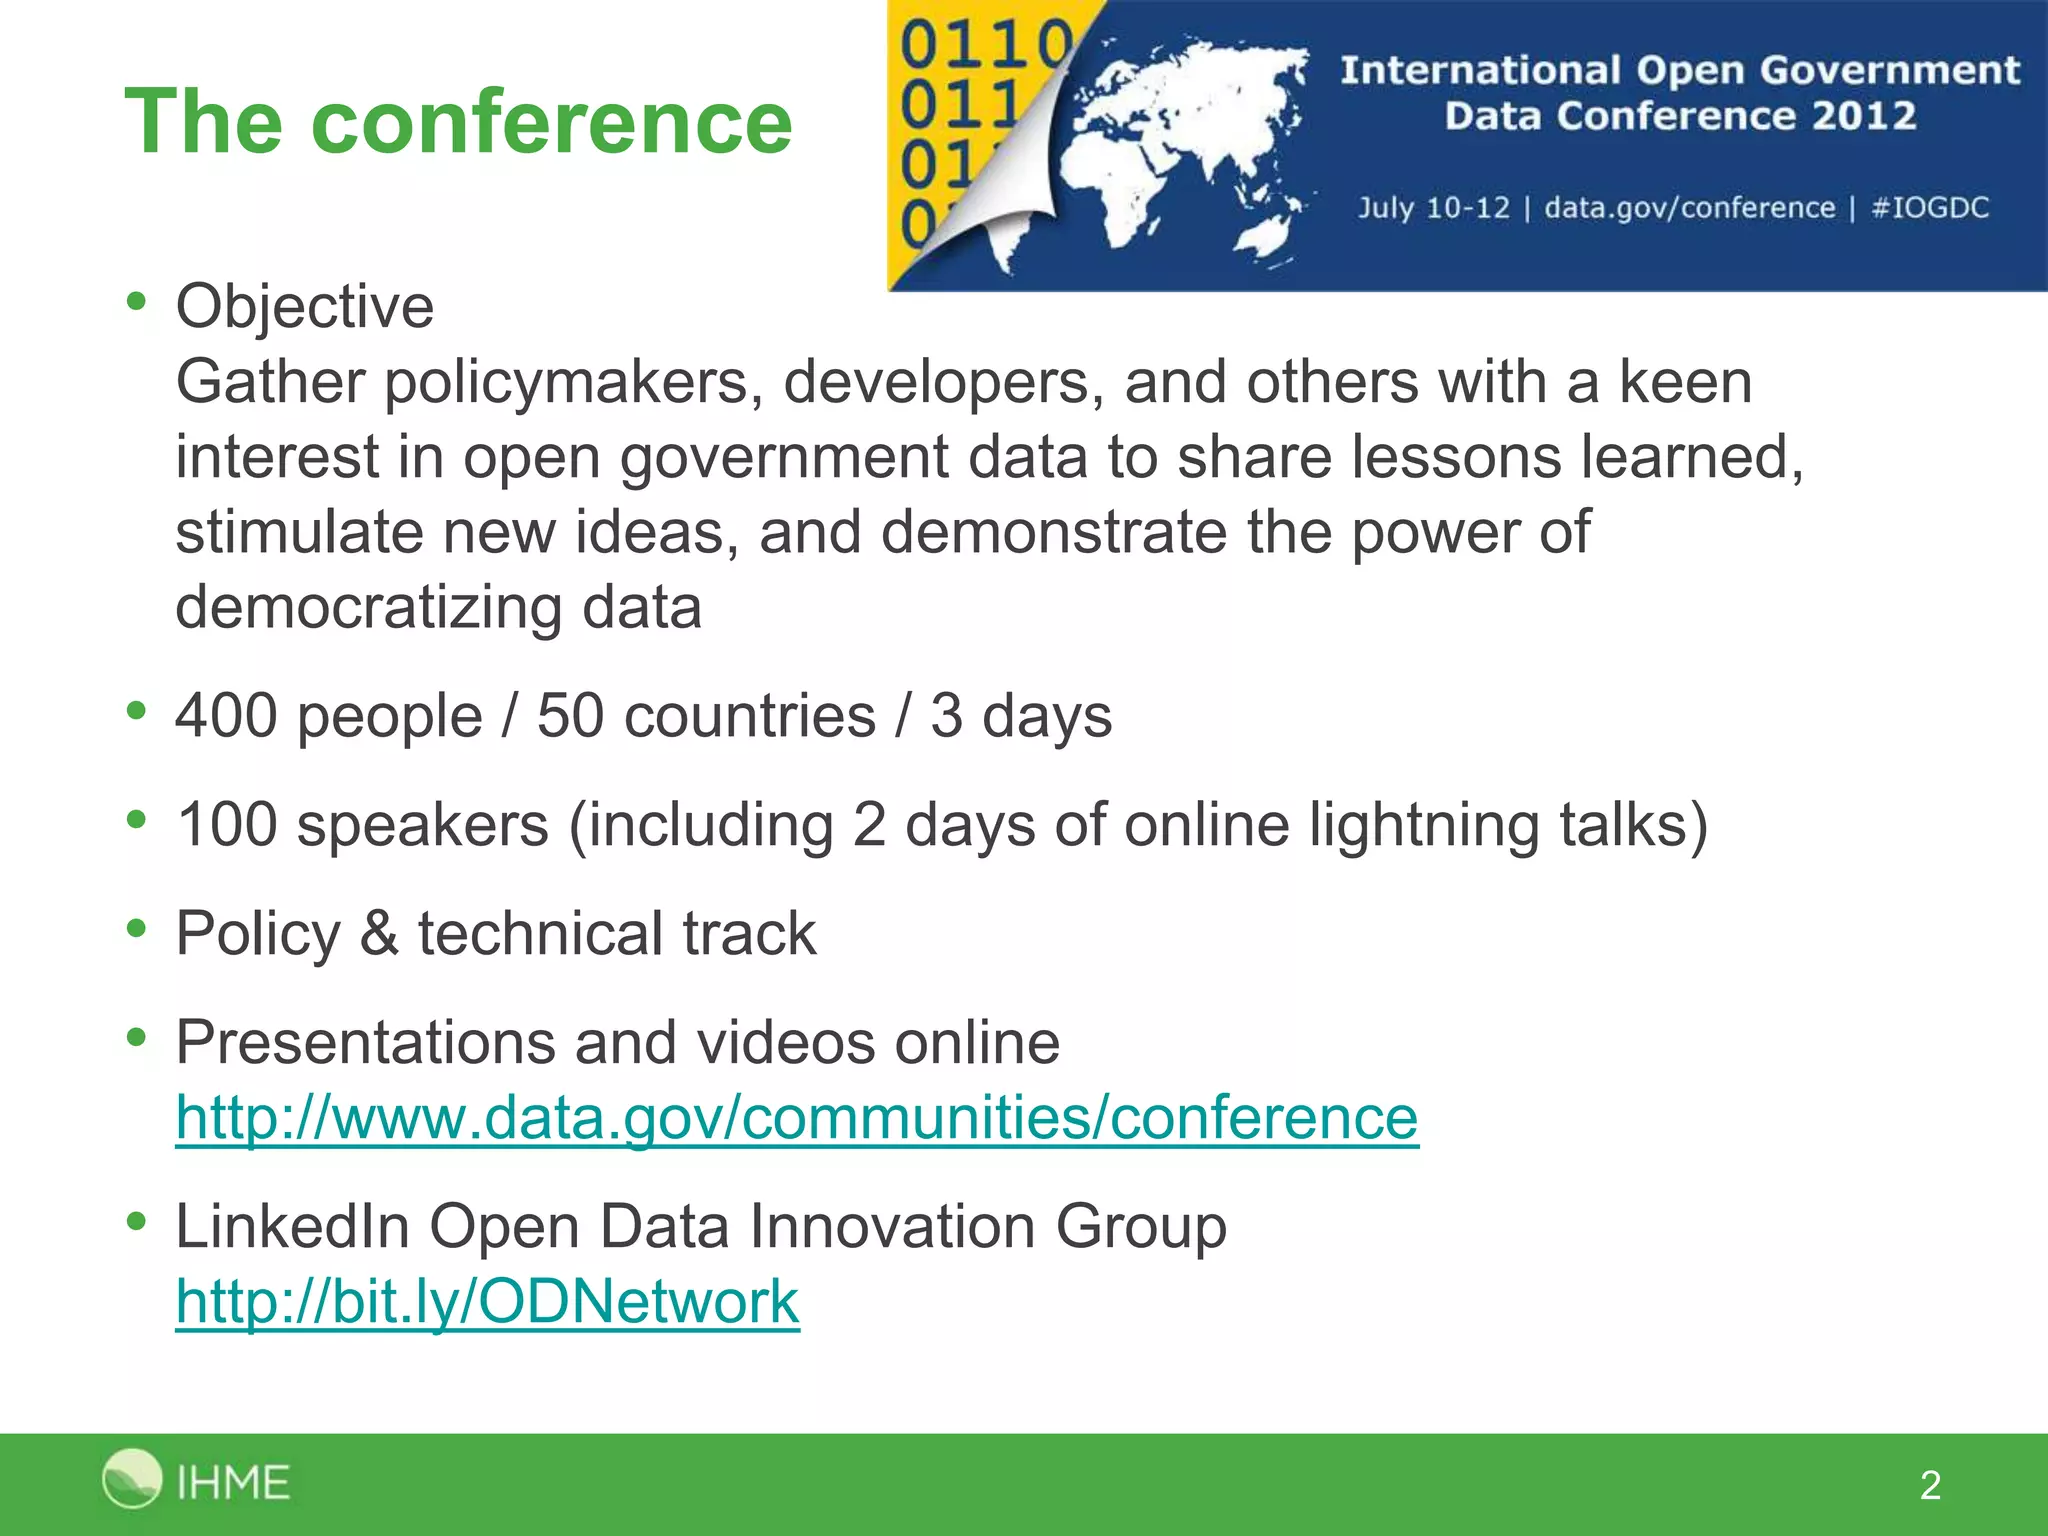
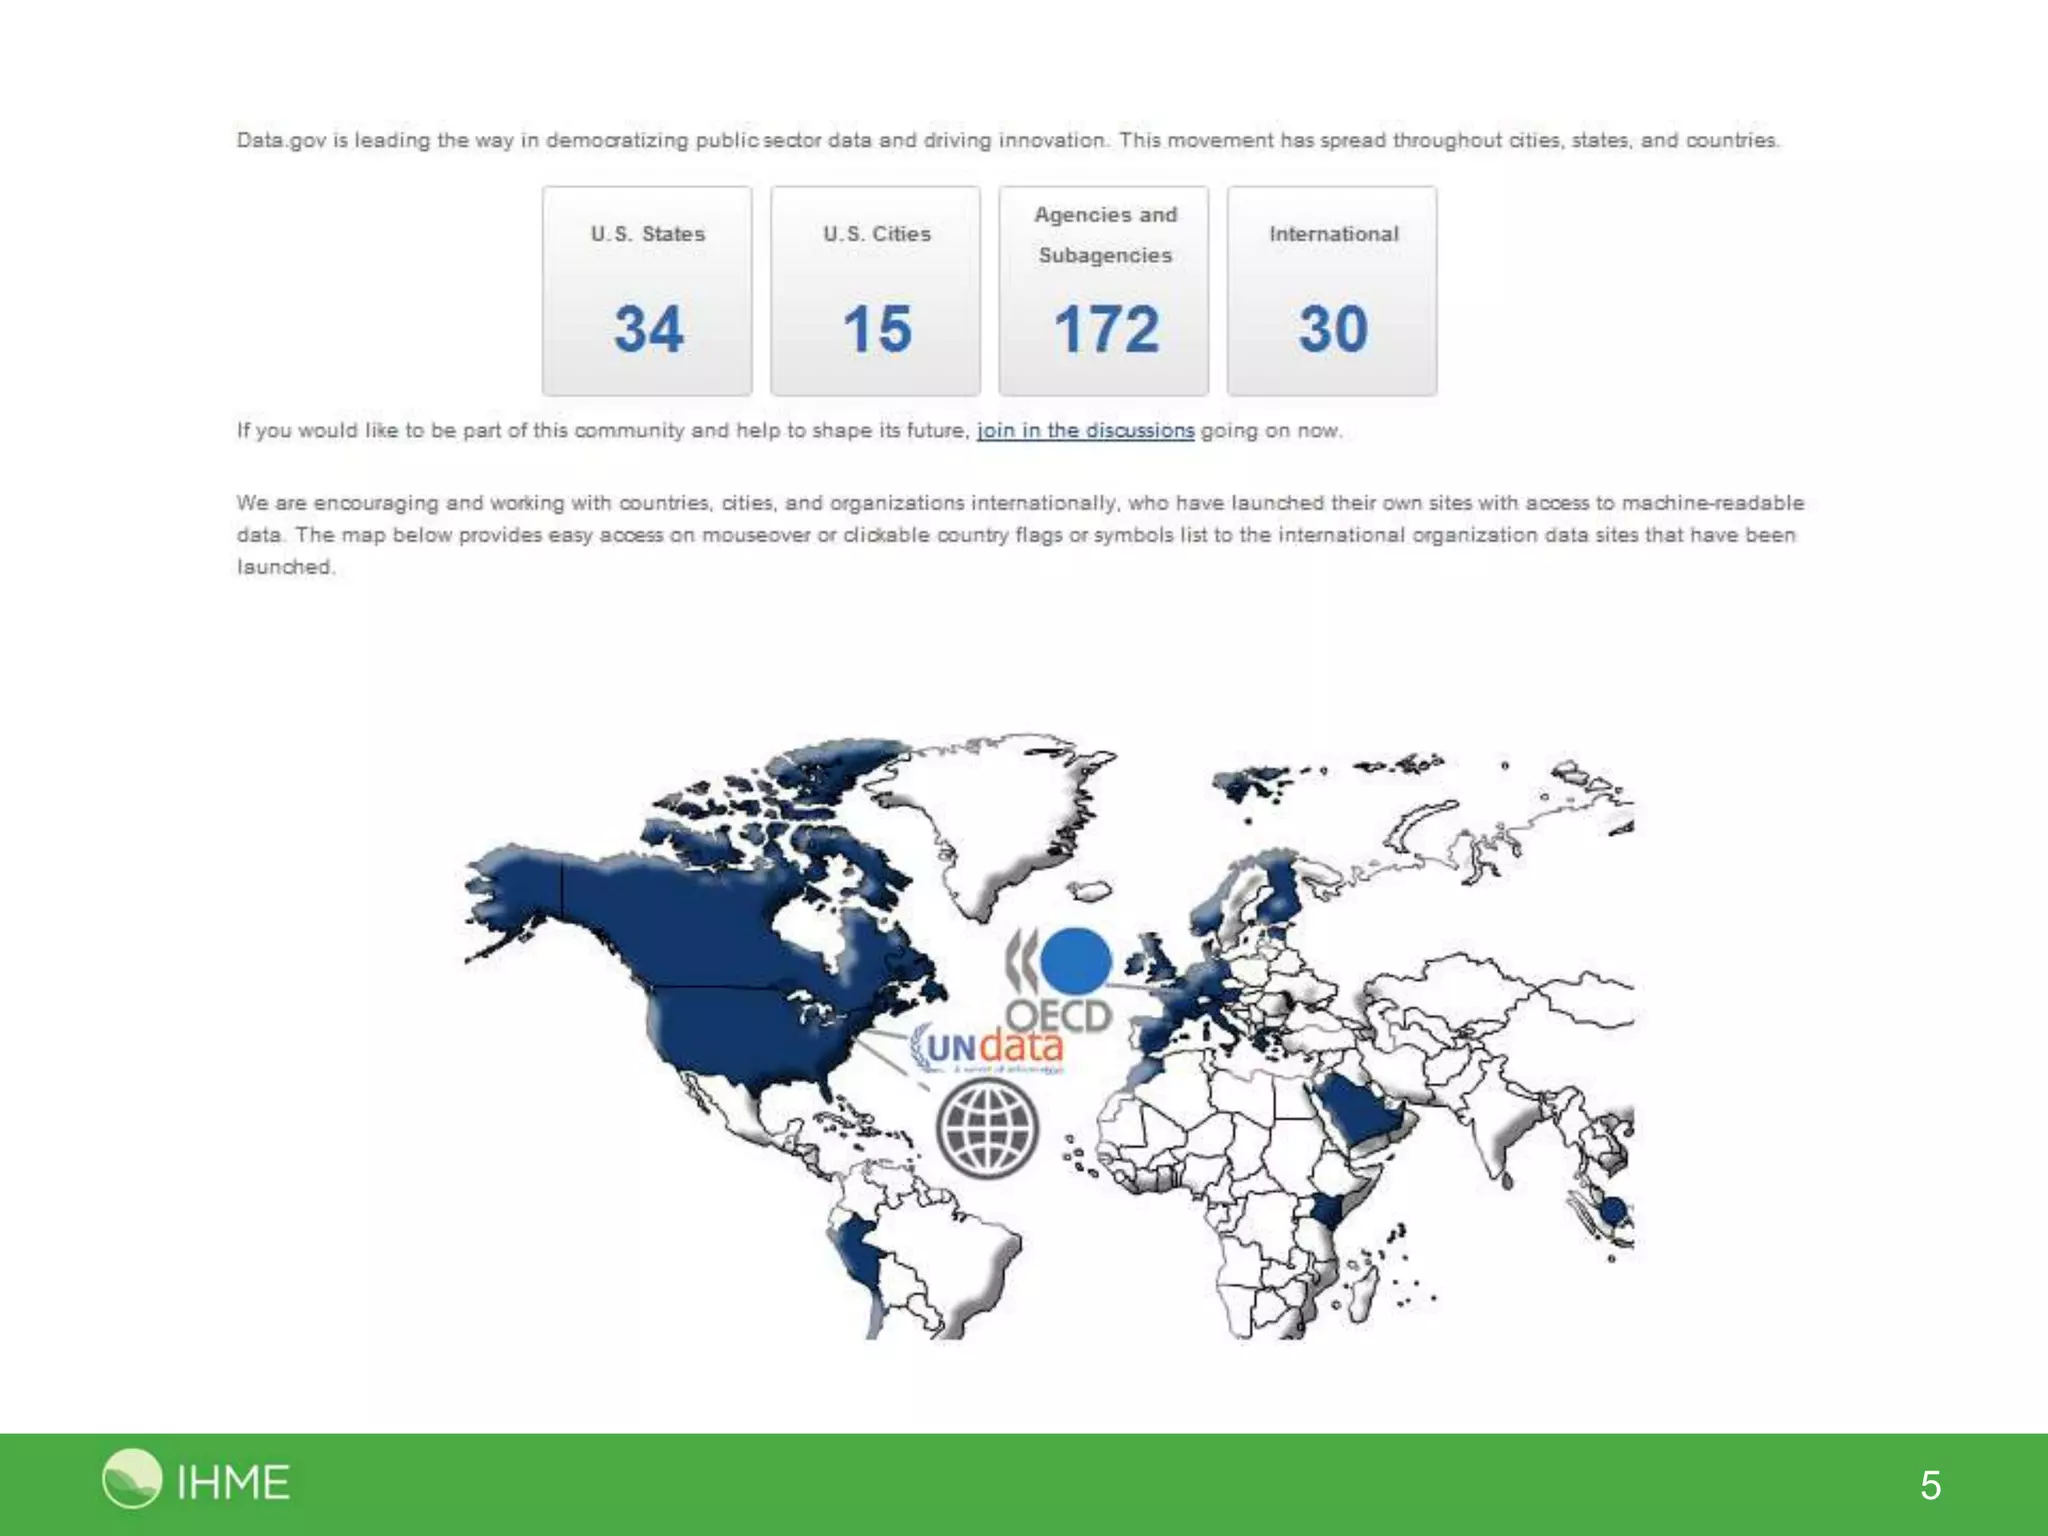
Presentation on Open Data delivered by Paul Wilkinson at the COMIT Community Day held on September 8th at Hemel Hempstead, hosted by Sir Robert McAlpine
1. The document discusses how sharing and openness can drive innovation through things like Creative Commons, which provides legal and technical tools to enable controlled levels of sharing.
2. It argues that sharing at different layers, like the knowledge layer, can lead to explosive innovation if enough sharing is obtained. Creative Commons aims to provide infrastructure for sharing to build a sustainable society respecting the law.
3. Sharing takes different forms like sharing content, data, knowledge and software, and can be a business strategy, customer demand, or way to more efficiently use resources through mechanisms like the Web and TCP/IP protocols.
Creative Commons is a non-profit organization that provides legal and technical tools to enable sharing content with some or no rights reserved through copyright licenses. They have over 100 global affiliate institutions and their tools allow for effective "some rights reserved" and "no rights reserved" cultures. Their licenses like BY-NC-SA allow reproduction and distribution of content as long as the creator is attributed and derivatives are shared under identical terms.
The document summarizes key points from the International Open Government Data Conference. It discusses the objectives of the conference, which was to share lessons learned about open government data and demonstrate its power. It also outlines some of the benefits of open data, such as improving accountability and creating economic opportunities. Finally, it emphasizes that successfully implementing open government data requires focusing on creating an ecosystem around the data through activities like skills training, prototyping, and scaling successful projects.
This document outlines an agenda for a data visualization workshop. It discusses why visualizing data is important for exploring patterns, communicating results, and telling stories. Examples are given of historical visualizations that helped identify cholera outbreaks and military campaigns. The main steps for visualizing data are introduced: being clear on objectives, preparing the data, building visualizations using appropriate tools, and ensuring success. Global Burden of Disease visualizations are presented as examples for research settings. The document concludes with encouraging questions and further resources.
Presentation from David Simoes-Brown, Strategy Partner at 100%Open on: The Do's and Dont's of Opening Up Data.
Seminar summary slide.
Presented at Ordnance Survey hosted Science and Innovation 2010 Seminar: Underpinning innovation with geography, launching this year's GeoVation Challenge - "How can Britain feed itself?"
Leave it to the Experts: Leveraging Archive.org and Creative Commons for PEG ...Mike Linksvayer
This document summarizes a presentation about leveraging Archive.org and Creative Commons for public, educational, and government (PEG) licensing. It introduces Creative Commons as a nonprofit that provides legal and technical tools to allow for some or no copyright restrictions. It also discusses how open licensing policies can be determined by copyright holders, institutions, funders, or default public policy, and notes the trend of publicly funded research and cultural works being made freely accessible.
Open data policy for scientists as citizens and for citizen scienceMike Linksvayer
This document discusses open data policies for citizen science and scientists as citizens. It addresses how open data allows non-scientists to contribute to scientific processes through citizen science and helps scientists be more cognizant of their work's impact on society. The document also examines the role of open data and mass collaboration projects, and considers important policy aspects like licensing, governance, and promoting the public good.
- Nigel Shadbolt and Tim Berners-Lee were appointed in 2009 to create data.gov.uk and promote open government data.
- Open government data is now being released by governments, local authorities, and cities as it provides benefits such as increased transparency, accountability, and opportunities for economic and social gains.
- Key datasets are being released with open licenses and standards to encourage app development and public use of the data.
Government Linked Data: A Tipping Point for the Semantic WebNigel Shadbolt
This document summarizes a presentation on government linked data and open data. It discusses how the semantic web has simplified over time with micro principles like identifying entities with URIs and linking data. It outlines accomplishments in releasing open government data through sites like data.gov.uk and the power of open data to fuel apps. Principles of public data are presented, like being machine readable and in reusable form. Early examples of apps using open government data are shown. The concept of 5-star linked open data is introduced. Benefits of open government data are that it increases transparency, accountability, and public engagement.
The presentation was held by Mr. Oleg Petrov, TTL, Moldova Governance eTransformation Project, during a workshop on the role of Open Government Data (OGD) in developing countries organized by the World Bank and the World Wide Web Foundation in the US. (October 2011)
The document discusses the transition from the traditional web (Web 1.0) to the semantic web (Web 3.0) through Web 2.0. It outlines the key principles of linking data on the web in a way that is machine-readable and outlines progress made in publishing linked open government data through the UK's data.gov.uk portal, which has released over 1500 datasets from government departments. The document argues that linked open data can drive transparency, economic and social value, and improvements to public services.
Professor Rob Kitchin from the Programmable City and Maynooth University presents the possible pitfalls to opening data in addition to the costs associated with this practice.
This document summarizes the potential for government use of data virtual reality (VR) to make open, public data more accessible, useful, and impactful. It discusses establishing open data policies and principles, aligning data to open standards, and tapping into citizen knowledge through open data and connectivity. The document argues that pattern recognition through data VR could improve public policy, service delivery, government accountability, and citizen engagement by making complex data visually accessible. However, it notes challenges around resources, legacy systems, data ownership, and measurable outcomes. Opportunities include evidence-based policy, operational efficiency, cross-sector collaboration, and improved data quality and services.
Talk delivered at London Natural History Museum's "Informatics Horizons for the Natural History Museum" video and programme here
http://scratchpads.eu/NHMInformaticsday
20yrs:1998 Society of Archivists ConferenceNeil Beagrie
This document summarizes current methods for preserving digital collections and ongoing research in the field. It discusses the growth of electronic records and need for digital preservation. A strategic policy framework is presented that is based on the lifecycle of digital resources, from creation to use. Case studies are described from various institutions implementing digital preservation. The document advocates for proactive programs, collaboration, and new technical approaches like migration and emulation. It also addresses legal issues and provides information on where to find further resources.
Executive Summary: Mobilsing the Data Revolution for Sustainable DevelopmentDr Lendy Spires
This document provides an executive summary of recommendations for mobilizing data to support sustainable development goals (SDGs). It recommends that the UN establish a global consensus on data principles, a network to share technology and innovations, and new funding to develop data capacity. A UN-led global partnership is proposed to coordinate these actions and mobilize the data revolution for sustainable development, monitoring progress, and holding governments accountable. Quick wins on SDG data are also recommended such as an SDG data lab and dashboard.
Software Eats the (Commons/Public Licensing) World (It Should!)Mike Linksvayer
The document discusses how software is poised to take over large parts of the economy and knowledge commons through open licensing and collaboration. It argues that free/libre and open source software and principles should be adopted more widely in other domains like publishing, scientific research, and education. A unified interoperable commons across all domains using standardized open content licenses could maximize collaboration and innovation.
Why Everyone Needs an Open Data StrategyJeni Tennison
This document outlines key considerations for developing an open data strategy, including identifying sources of open data, sustaining its supply, enhancing your brand through openness, leveraging open data for innovation, and better communicating with stakeholders. It provides examples of how companies have successfully incorporated open data and transparency into their business strategies. The overall message is that developing a thoughtful open data strategy can provide opportunities for new insights, partnerships, and ways to engage with customers and suppliers.
This document discusses understanding and improving the uptake and utilization of open data. It aims to present the state of open data programs, highlight opportunities in open data adoption, and identify issues and challenges.
The document provides background on the continued interest in open data and the growing adoption by institutions. It summarizes findings from recent surveys that show over 380 open data catalogs globally and over 150 in Europe. The 2013 Open Data Barometer is discussed, which ranks countries' open data readiness, implementation, and impact. The UK ranks as most advanced while few datasets are truly open with accessible licenses and formats.
Issues and challenges to open data uptake include few high-value datasets, lack of access to information laws, and limited training
The challenges of building a strong data infrastructureJeni Tennison
In the 21st century, data is infrastructure for our economy, just like roads. In this session, Jeni will talk about the big challenges of building a strong data infrastructure: challenges of equality of access, challenges of privacy and trust, and the technical challenges of discovery and interoperability.
The document discusses the importance of building the digital commons to ensure future digital freedom. It identifies threats such as censorship, surveillance and loss of innovation that could undermine digital freedom. It argues that increasing use of free software, free culture and peer production can help address these threats by improving security, transparency and access. The key message is that supporting creative commons now through contributing to open knowledge and technologies is critical for maintaining digital rights in the future.
Presentatie Carl Esposti KJO9- CrowdsourcingMediamatic
Crowdsourcing involves tapping into online communities to utilize their expertise, knowledge, or time to achieve specific goals. There are several models of crowdsourcing including managed knowledge discovery, distributed human intelligence tasking, broadcast search, and peer vetted creative production. Common applications include crowdfunding, collective creativity, collective knowledge, community building, civic engagement, cloud labor, and open innovation. The document outlines seven habits for successful crowdsourcing including enterprise crowdsourcing, crowd powered business, open innovation, community building, and cloud labor.
Population health measurement - key takeaways from Global Burden of Disease s...Peter Speyer
Overview of the Global Burden of Disease study along with 8 key insights from turning 50K data sources into comparable measurements of health loss by country, age and sex. Insights range from finding, managing, and wrangling/prepping to analyzing and visualizing the results.
Big Data in Global Health: Steps to get data to audiencesPeter Speyer
The Global Burden of Disease Study systematically analyzes a wide variety of health data sources to quantify the global burden of diseases, injuries, and risk factors. It involves 4 steps: 1) accessing data from various sources like surveys and medical records, 2) preparing the data for analysis by extracting, correcting biases, and cross-walking between coding schemes, 3) analyzing the data using modeling and reviewing by experts, and 4) translating the results into academic papers, reports, data visualizations and search tools to share the findings.
Florence Nightingale used data visualization to communicate public health data and drive policy change in the mid-19th century. She partnered with a statistician to analyze mortality data from the Crimean War, which showed that most soldier deaths were from preventable diseases, not combat wounds. Nightingale created "coxcomb" diagrams to visually depict the data in a clear, compelling way. Her data storytelling had a significant impact, improving sanitary conditions in military hospitals. Today, effective communication of data requires identifying the right audience and tailoring the amount, format and delivery of data to meet their needs.
The document discusses the benefits of exercise for mental health. Regular physical activity can help reduce anxiety and depression and improve mood and cognitive functioning. Exercise causes chemical changes in the brain that may help protect against mental illness and improve symptoms.
This document discusses how spatial analysis and mapping can inform global health decision making. It describes the Global Burden of Disease study which quantifies health loss from diseases, injuries, and risk factors in 187 countries. Spatial challenges include managing data from different geographies over time and addressing missing data. The Global Health Data Exchange provides access to health data. Maps of risk factors like air pollution are shown. Spatial regression models capture information over time, age, and space. Small area estimation is used to analyze health patterns at subnational levels with limited data. Remaining tasks involve adding more spatial covariates and conducting subnational burden studies.
Gerald Sarmiento is a senior graphic and UI designer with over 10 years of experience in design. He has strong skills in Adobe tools like Photoshop, Illustrator, and InDesign. As a senior designer at Smoov, he leads a team and is responsible for concepting and executing marketing materials. He also designs user interfaces through wireframes, flows and visual design. Previously, he worked as a multimedia artist and video editor. He holds a Bachelor's degree in Multimedia Arts from De La Salle University.
Chart Makeover: A Women's Nutrition Bar ChartAmanda Makulec
One of the most common requests I receive is to review charts and graphs and provide insight around how to improve them by using the formatting tools available in Excel.
This example shows the process of redesigning the chart to better facilitate comparison within regions of the trend towards a greater percent of women falling into the overweight and obese categories (from 1980 to 2008).
August Designstorm: Alternative Reporting FormatsAmanda Makulec
Monthly brainstorm and idea sharing session at JSI around data visualization. The August deck focuses on alternative reporting formats and questions to think through to reach various audiences, including tools like interactive timelines, interactive graphics and dashboards (Tableau & others), scrolling/parallax webpages, and key design principles.
Interactive, clickable session highlighting how to apply design principles to Excel graphs to make a data story sing. Originally hosted as a brown-bag lunch presentation at JSI. For more detailed resources on designing various chart types in Excel, check out Ann Emery's Excel series and slide decks http://www.slideshare.net/annkemery/presentations.
Building Capacity in Partner Countries: Training and Tools and ResourcesMEASURE Evaluation
The document summarizes the progress made over the past 5 years in building capacity for geographic information systems (GIS) training, tools, and resources in partner countries. It outlines where the field was lacking 5 years ago with no standard GIS curriculum or open source training. It then details the various resources and trainings now available at beginner and advanced levels, including face-to-face workshops, an open source GIS curriculum, online mapping and data tools, guidance documents, reports, and academic publications. The goal is to build sustainable capacity for using spatial data and methods for monitoring and evaluation and global health.
Highlights from three different speakers on the actual use of dashboards for decisionmaking.
MEASURE Evaluation shares the results of a landscape analysis looking for specific examples of dashboards prompting action. BroadReach shares an example of how their Vantage platform is making HIV data accessible in South Africa. JSI shares an example of low-tech but high-impact dashboard development and coaching that has transformed districts in Zimbabwe.
A short workshop from MERL Tech 2016 on how we can think more purposefully about telling stories with our data and designing visualizations to bring those stories to life in global health and development.
Presented on May 7, 2015 to the TechChange Technology for M&E course. The aim of the presentation was to highlight key considerations in designing visualizations as part of international development programs, and includes both challenges of visualization in development programs and six things to consider when designing visualizations.
Population Health - Data & Visualizations for Decision MakingPeter Speyer
Measurement is key for population health management. Global Burden of Disease provides data on burden by disease, injury and risk factor in countries around the world.
Summary deck from our monthly JSI design-storm (design + brainstorm), highlighting the key features of Piktochart for designing visualizations to make information accessible.
Data visualization is about transforming numbers into knowledge, making information meaningful. I was one of 50 contributors to this free, Creative Commons licensed eBook, which provides a comprehensive overview of how to approach, develop, design, and publish great data visualizations.
Learn more about the project, interact with the eBook online, and get involved in future iterations at https://infoactive.co/data-design
Data Visualization Design Best Practices WorkshopAmanda Makulec
Presentation shared at the #MA4Health Data Visualization workshop cofacilitated with my colleague Tahmid Chowdhury. Our aim was to empower participants with simple principles they can apply to any graph or chart to improve its effectiveness in communicating information, and to share resources on viz design relevant to global health practitioners.
1) The document discusses how open data and interoperability can drive innovation by empowering people and communities through access to government data.
2) Key points include how open data can meet regulatory needs, communicate with citizens, and spur new economic development and innovation.
3) An open data ecosystem is created by gathering and connecting data, infrastructure, developers, and communities to empower choices and change behavior.
Open data provides opportunities for transparency, innovation, and participatory governance. There are technical challenges to making data open, from simple formats to linked data. While open data is often implemented by volunteers and the public sector, its long term success requires involvement from commercial organizations who can analyze and add value to data at larger scales. Ensuring public interests are protected as more commercial actors become involved will also be important going forward.
Intro to Open data - presentation made as part of Food and Agriculture Organization meeting with Statistician Generals from around Nigeria + other government reps. **References are in the ppt notes
1. The document describes a study that aimed to develop an open government data (OGD) platform that integrates OGD and social media features to better stimulate value generation from OGD.
2. Researchers designed a prototype platform with features like data processing, feedback/collaboration, data quality ratings, and grouping/interaction capabilities.
3. An evaluation of the prototype found that users appreciated the novel social media-inspired features and found them useful for collaborating around OGD.
This slide set examines the contention that opening data is an inherently good thing - that the case for open data is an open and shut case. It sets out a contrary view that whilst open data is desirable, much more critical thinking is required as to what this means in practice and the possible negative implications of opening data, and calls for a wider debate about the relative merits and politics of open data and how we go about opening data.
B2: Open Up: Open Data in the Public SectorMarieke Guy
Parallel session [B2: Open Up: Open Data in the Public Sector] run at the Institutional Web Management Workshop 2013 (IWMW 2013) event, University of Bath on 26 - 28th June 2013.
ODI Node Vienna: Best Practise Beispiele für: Open Innovation mittels Open DataMartin Kaltenböck
Vortrag im Rahmen des Data Pioneers Workshop am 10.10.2016 am BMVIT zum Thema Open Innovation und Open Data (Open Innovation mittels Open Data) seitens Elmar Kiesling (TU Wien) und Martin Kaltenböck (SWC) für den ODI (Open Data Institute) Node Vienna.
Government agencies are using the power of analytics to understand government performance as well as analyze key trends, catch fraud, and drive better citizen engagement. In this session, you will learn tips on using data to effectively do your job better. Learn key analytical strategies that will help you become an analytical star within your agency or organization.
This document presents an overview of open data and Socrata's open data platform. Some key points:
- Socrata is the most widely adopted open data platform, used by many governments and organizations.
- It provides an accessible, cloud-based platform for publishing and experiencing data through various channels and devices.
- The platform aims to make data easier to find, explore, use and visualize in order to enhance engagement and foster innovation.
A call to librarians to use their library powers in the community beyond the walls of their institutions as the open data folks need their knowledge!
Title:
Open Sesame: Open Data, Data Liberation and New Opportunities for Libraries
Abstract:
Cities and data producers are quickly embracing Open Data, albeit unevenly. The Data Liberation Initiative (DLI) has been a pioneer in broadening access to data for nearly two decades. This session will examine the relevance of Data Liberation in terms of Open Data and explore how librarians can step up to the plate to make Open Data/Open Government as successful as DLI.
Speakers:
- Wendy Watkins, Data Librarian, Carleton University
- Ernie Boyko, Adjunct Data Librarian, Carleton University
- Tracey P. Lauriault, Post Doctoral Fellow, Carleton University (tlauriau@gmail.com)
- Margaret Haines, University Librarian, Carleton University
The document discusses New Zealand's leadership in open data. It defines open data and explains why data should be freely available. New Zealand has developed a common licensing framework called NZGOAL that uses Creative Commons licenses as the default for government data. New Zealand also launched a government data catalog called Data.govt.nz that currently lists 401 datasets from 58 agencies. The country is working to increase community contribution around open data resources.
The document discusses the goals and progress of Data.gov, a US government platform that provides access to government data. It aims to 1) gather data from agencies and make it openly available, 2) connect developers, scientists and citizens to find solutions, 3) provide infrastructure based on standards, and 4) encourage apps and visualizations using the data. Since 2009, Data.gov has grown from 47 to over 400,000 datasets and driven the creation of hundreds of applications and visualizations that have improved lives. The document outlines plans to further open data internationally and drive innovation.
NAPHSIS Keynote: Vital Records - Vital Input for Population Health MeasurementPeter Speyer
The document discusses vital records and their importance as inputs for measuring population health. It describes the Institute for Health Metrics and Evaluation's work on the Global Burden of Disease study, which uses over 600 million vital registration records from 1980 to the present to measure causes of death. The study develops models to redistribute "garbage codes" or poorly specified causes of death. Looking ahead, the Institute aims to measure disease burden at the county level in the United States through partnerships with states.
Global Burden of Disease at Wolfram Data SummitPeter Speyer
The document discusses the Global Burden of Disease study conducted by the Institute for Health Metrics and Evaluation. The study analyzes big data on global health to quantify the comparative magnitude of health loss from diseases, injuries, and risk factors by age, sex, geography, and time. It involved collaboration with hundreds of individuals from over 50 countries. The study was published in 2012 and analyzed data from 187 countries for 1990, 2005, and 2010 on 291 causes of death, 66 risk factors, and key health metrics.
Managing and Analyzing Health Data (VLDB Conference)Peter Speyer
This document summarizes the work of the Institute for Health Metrics and Evaluation (IHME) in managing and analyzing global health data. IHME aims to improve global health by providing independent health measurements and evaluations. It faces challenges in finding, accessing, using, and disseminating the large quantities of diverse health data from various sources. IHME develops solutions like statistical computing infrastructure and the Global Health Data Exchange, a data catalog and repository that aims to increase transparency, access, and sharing of health information.
Health Data Innovation (Wolfram Data Summit)Peter Speyer
Brief overview of the work of the Institute for Health Metrics and Evaluation (IHME), the Global Health Data Exchange (GHDx), and innovation happening in the health data space, ranging from Health Data Initiative to health apps, patient engagement, new tools and real-time data collection
The document introduces the launch of the Global Health Data Exchange (GHDx), an open data catalog and repository that aims to improve global health by providing access to population health data. GHDx addresses the challenge of finding and accessing health-related data from various sources by creating a centralized catalog of over 4,300 public datasets with standardized descriptions and links to download data. The catalog is built on open-source platforms to allow sharing of data and the platform itself to encourage transparency and reuse of health information.
“An Outlook of the Ongoing and Future Relationship between Blockchain Technologies and Process-aware Information Systems.” Invited talk at the joint workshop on Blockchain for Information Systems (BC4IS) and Blockchain for Trusted Data Sharing (B4TDS), co-located with with the 36th International Conference on Advanced Information Systems Engineering (CAiSE), 3 June 2024, Limassol, Cyprus.
Ocean lotus Threat actors project by John Sitima 2024 (1).pptxSitimaJohn
Ocean Lotus cyber threat actors represent a sophisticated, persistent, and politically motivated group that poses a significant risk to organizations and individuals in the Southeast Asian region. Their continuous evolution and adaptability underscore the need for robust cybersecurity measures and international cooperation to identify and mitigate the threats posed by such advanced persistent threat groups.
Building Production Ready Search Pipelines with Spark and MilvusZilliz
Spark is the widely used ETL tool for processing, indexing and ingesting data to serving stack for search. Milvus is the production-ready open-source vector database. In this talk we will show how to use Spark to process unstructured data to extract vector representations, and push the vectors to Milvus vector database for search serving.
For the full video of this presentation, please visit: https://www.edge-ai-vision.com/2024/06/building-and-scaling-ai-applications-with-the-nx-ai-manager-a-presentation-from-network-optix/
Robin van Emden, Senior Director of Data Science at Network Optix, presents the “Building and Scaling AI Applications with the Nx AI Manager,” tutorial at the May 2024 Embedded Vision Summit.
In this presentation, van Emden covers the basics of scaling edge AI solutions using the Nx tool kit. He emphasizes the process of developing AI models and deploying them globally. He also showcases the conversion of AI models and the creation of effective edge AI pipelines, with a focus on pre-processing, model conversion, selecting the appropriate inference engine for the target hardware and post-processing.
van Emden shows how Nx can simplify the developer’s life and facilitate a rapid transition from concept to production-ready applications.He provides valuable insights into developing scalable and efficient edge AI solutions, with a strong focus on practical implementation.
In the rapidly evolving landscape of technologies, XML continues to play a vital role in structuring, storing, and transporting data across diverse systems. The recent advancements in artificial intelligence (AI) present new methodologies for enhancing XML development workflows, introducing efficiency, automation, and intelligent capabilities. This presentation will outline the scope and perspective of utilizing AI in XML development. The potential benefits and the possible pitfalls will be highlighted, providing a balanced view of the subject.
We will explore the capabilities of AI in understanding XML markup languages and autonomously creating structured XML content. Additionally, we will examine the capacity of AI to enrich plain text with appropriate XML markup. Practical examples and methodological guidelines will be provided to elucidate how AI can be effectively prompted to interpret and generate accurate XML markup.
Further emphasis will be placed on the role of AI in developing XSLT, or schemas such as XSD and Schematron. We will address the techniques and strategies adopted to create prompts for generating code, explaining code, or refactoring the code, and the results achieved.
The discussion will extend to how AI can be used to transform XML content. In particular, the focus will be on the use of AI XPath extension functions in XSLT, Schematron, Schematron Quick Fixes, or for XML content refactoring.
The presentation aims to deliver a comprehensive overview of AI usage in XML development, providing attendees with the necessary knowledge to make informed decisions. Whether you’re at the early stages of adopting AI or considering integrating it in advanced XML development, this presentation will cover all levels of expertise.
By highlighting the potential advantages and challenges of integrating AI with XML development tools and languages, the presentation seeks to inspire thoughtful conversation around the future of XML development. We’ll not only delve into the technical aspects of AI-powered XML development but also discuss practical implications and possible future directions.
Programming Foundation Models with DSPy - Meetup SlidesZilliz
Prompting language models is hard, while programming language models is easy. In this talk, I will discuss the state-of-the-art framework DSPy for programming foundation models with its powerful optimizers and runtime constraint system.
Full-RAG: A modern architecture for hyper-personalizationZilliz
Mike Del Balso, CEO & Co-Founder at Tecton, presents "Full RAG," a novel approach to AI recommendation systems, aiming to push beyond the limitations of traditional models through a deep integration of contextual insights and real-time data, leveraging the Retrieval-Augmented Generation architecture. This talk will outline Full RAG's potential to significantly enhance personalization, address engineering challenges such as data management and model training, and introduce data enrichment with reranking as a key solution. Attendees will gain crucial insights into the importance of hyperpersonalization in AI, the capabilities of Full RAG for advanced personalization, and strategies for managing complex data integrations for deploying cutting-edge AI solutions.
Fueling AI with Great Data with Airbyte WebinarZilliz
This talk will focus on how to collect data from a variety of sources, leveraging this data for RAG and other GenAI use cases, and finally charting your course to productionalization.
AI 101: An Introduction to the Basics and Impact of Artificial IntelligenceIndexBug
Imagine a world where machines not only perform tasks but also learn, adapt, and make decisions. This is the promise of Artificial Intelligence (AI), a technology that's not just enhancing our lives but revolutionizing entire industries.
Infrastructure Challenges in Scaling RAG with Custom AI modelsZilliz
Building Retrieval-Augmented Generation (RAG) systems with open-source and custom AI models is a complex task. This talk explores the challenges in productionizing RAG systems, including retrieval performance, response synthesis, and evaluation. We’ll discuss how to leverage open-source models like text embeddings, language models, and custom fine-tuned models to enhance RAG performance. Additionally, we’ll cover how BentoML can help orchestrate and scale these AI components efficiently, ensuring seamless deployment and management of RAG systems in the cloud.
Essentials of Automations: The Art of Triggers and Actions in FMESafe Software
In this second installment of our Essentials of Automations webinar series, we’ll explore the landscape of triggers and actions, guiding you through the nuances of authoring and adapting workspaces for seamless automations. Gain an understanding of the full spectrum of triggers and actions available in FME, empowering you to enhance your workspaces for efficient automation.
We’ll kick things off by showcasing the most commonly used event-based triggers, introducing you to various automation workflows like manual triggers, schedules, directory watchers, and more. Plus, see how these elements play out in real scenarios.
Whether you’re tweaking your current setup or building from the ground up, this session will arm you with the tools and insights needed to transform your FME usage into a powerhouse of productivity. Join us to discover effective strategies that simplify complex processes, enhancing your productivity and transforming your data management practices with FME. Let’s turn complexity into clarity and make your workspaces work wonders!
Have you ever been confused by the myriad of choices offered by AWS for hosting a website or an API?
Lambda, Elastic Beanstalk, Lightsail, Amplify, S3 (and more!) can each host websites + APIs. But which one should we choose?
Which one is cheapest? Which one is fastest? Which one will scale to meet our needs?
Join me in this session as we dive into each AWS hosting service to determine which one is best for your scenario and explain why!
Cosa hanno in comune un mattoncino Lego e la backdoor XZ?Speck&Tech
ABSTRACT: A prima vista, un mattoncino Lego e la backdoor XZ potrebbero avere in comune il fatto di essere entrambi blocchi di costruzione, o dipendenze di progetti creativi e software. La realtà è che un mattoncino Lego e il caso della backdoor XZ hanno molto di più di tutto ciò in comune.
Partecipate alla presentazione per immergervi in una storia di interoperabilità, standard e formati aperti, per poi discutere del ruolo importante che i contributori hanno in una comunità open source sostenibile.
BIO: Sostenitrice del software libero e dei formati standard e aperti. È stata un membro attivo dei progetti Fedora e openSUSE e ha co-fondato l'Associazione LibreItalia dove è stata coinvolta in diversi eventi, migrazioni e formazione relativi a LibreOffice. In precedenza ha lavorato a migrazioni e corsi di formazione su LibreOffice per diverse amministrazioni pubbliche e privati. Da gennaio 2020 lavora in SUSE come Software Release Engineer per Uyuni e SUSE Manager e quando non segue la sua passione per i computer e per Geeko coltiva la sua curiosità per l'astronomia (da cui deriva il suo nickname deneb_alpha).
In his public lecture, Christian Timmerer provides insights into the fascinating history of video streaming, starting from its humble beginnings before YouTube to the groundbreaking technologies that now dominate platforms like Netflix and ORF ON. Timmerer also presents provocative contributions of his own that have significantly influenced the industry. He concludes by looking at future challenges and invites the audience to join in a discussion.
Driving Business Innovation: Latest Generative AI Advancements & Success StorySafe Software
Are you ready to revolutionize how you handle data? Join us for a webinar where we’ll bring you up to speed with the latest advancements in Generative AI technology and discover how leveraging FME with tools from giants like Google Gemini, Amazon, and Microsoft OpenAI can supercharge your workflow efficiency.
During the hour, we’ll take you through:
Guest Speaker Segment with Hannah Barrington: Dive into the world of dynamic real estate marketing with Hannah, the Marketing Manager at Workspace Group. Hear firsthand how their team generates engaging descriptions for thousands of office units by integrating diverse data sources—from PDF floorplans to web pages—using FME transformers, like OpenAIVisionConnector and AnthropicVisionConnector. This use case will show you how GenAI can streamline content creation for marketing across the board.
Ollama Use Case: Learn how Scenario Specialist Dmitri Bagh has utilized Ollama within FME to input data, create custom models, and enhance security protocols. This segment will include demos to illustrate the full capabilities of FME in AI-driven processes.
Custom AI Models: Discover how to leverage FME to build personalized AI models using your data. Whether it’s populating a model with local data for added security or integrating public AI tools, find out how FME facilitates a versatile and secure approach to AI.
We’ll wrap up with a live Q&A session where you can engage with our experts on your specific use cases, and learn more about optimizing your data workflows with AI.
This webinar is ideal for professionals seeking to harness the power of AI within their data management systems while ensuring high levels of customization and security. Whether you're a novice or an expert, gain actionable insights and strategies to elevate your data processes. Join us to see how FME and AI can revolutionize how you work with data!
Removing Uninteresting Bytes in Software FuzzingAftab Hussain
Imagine a world where software fuzzing, the process of mutating bytes in test seeds to uncover hidden and erroneous program behaviors, becomes faster and more effective. A lot depends on the initial seeds, which can significantly dictate the trajectory of a fuzzing campaign, particularly in terms of how long it takes to uncover interesting behaviour in your code. We introduce DIAR, a technique designed to speedup fuzzing campaigns by pinpointing and eliminating those uninteresting bytes in the seeds. Picture this: instead of wasting valuable resources on meaningless mutations in large, bloated seeds, DIAR removes the unnecessary bytes, streamlining the entire process.
In this work, we equipped AFL, a popular fuzzer, with DIAR and examined two critical Linux libraries -- Libxml's xmllint, a tool for parsing xml documents, and Binutil's readelf, an essential debugging and security analysis command-line tool used to display detailed information about ELF (Executable and Linkable Format). Our preliminary results show that AFL+DIAR does not only discover new paths more quickly but also achieves higher coverage overall. This work thus showcases how starting with lean and optimized seeds can lead to faster, more comprehensive fuzzing campaigns -- and DIAR helps you find such seeds.
- These are slides of the talk given at IEEE International Conference on Software Testing Verification and Validation Workshop, ICSTW 2022.
1. Open Government Data
Insights from the International Open
Government Data Conference
September 17, 2012
Peter Speyer
Director of Data Development
2. The conference
• Objective
Gather policymakers, developers, and others with a keen
interest in open government data to share lessons learned,
stimulate new ideas, and demonstrate the power of
democratizing data
• 400 people / 50 countries / 3 days
• 100 speakers (including 2 days of online lightning talks)
• Policy & technical track
• Presentations and videos online
http://www.data.gov/communities/conference
• LinkedIn Open Data Innovation Group
http://bit.ly/ODNetwork
2
3. Organizers
• Launched in May 2009 • Launched in April 2010
• “The purpose of Data.gov is to • “Bringing global economic and
increase public access to high development data to the web for
value, machine readable datasets the world to use”
generated by the Executive Branch
• Centered around
of the Federal Government”
data.worldbank.org
• More than 450,000 datasets • Indicators, data catalog, microdata
• Several communities & community • Next frontier for open data at World
features
Bank: help governments open up
• Launch of Open Government (Jim Yong Kim)
Platform (OGPL) in May 2012 o Mapping aid funded projects:
Malawi done, 13 countries to follow
3
4. Benefits of open government data
• Outsource creativity to improve public services:
most of the world’s smartest people don’t work for you
(Sun co-founder Bill Joy)
• Improve accountability of government
• Increase trust in government through transparency
• Save time / expenditure of answering citizens’ data requests
• Enable government to use own data
• Create economic opportunity, e.g. $100B weather data market
• Show gaps in data collected
4
6. Critical considerations
• Release of irrelevant data to
demonstrate commitment to open
data
• Release of open data to heed off
demands for more press freedom
• Valid reasons not to share / open Photo: stevendepolo via flickr
up data
o National security
o Privacy
o Creating inequality, e.g. due to
digital divide (information is power)
6
7. Creating an open data ecosystem
• Only the first step: launch and grow an open data portal
• Market the data to potential data users
• Build community catalyst groups and embed change agents,
e.g. inside media houses
• Build skills (boot camps, master classes, university classes)
• Create proof of concept (e.g. via code-a-thons, data paloozas,
challenges, seed funding)
• Enable rapid prototyping (e.g. in
incubator spaces)
• Scale success (venture funds)
Examples at OIGDC: Kenya, Brazil, Mexico, Moldova
Photo: thinkpanama via flickr
7
8. Keys to success
• Focus on bigger agenda than just launching a portal
• Involve all data owners & stakeholders early on
• Engage data users (entrepreneurs, developers, journalists)
and citizens to encourage the use of data
• Use standardization carefully: can be useful or straight jacket
• Consider open source software
• Launching a platform is easy, the real work is making it
sustainable and creating an ecosystem around it
9. Role of the data user
• Create new and innovative uses for data
• Improve access for others via software/portal
• Re-distribute data to specific audiences, e.g. mywarming.org
from opendata.org
• Collect complementary data
• Request sharing / opening of Photo: edbury via flickr
additional data
• Overcome challenges
o Understand data
o Find partners
o Get funding
o Achieve financial sustainability
9
10. Key learnings
• Focus of open data discussions will have to
shift from data publishing to data use
• The best validator of open data is usage
• Open data should be optimized for
consumption, not for business/process
• Sustainability of open data depends on
creation of ecosystems around them
• Biggest obstacle for governments to open
data is not doing something
Photo: Erik Moberg via flickr
10
Editor's Notes
WelcomeThanks for coming, I’m sure you are all here because of the Global Health Data Exchange, not because there is food