The poll findings showed:
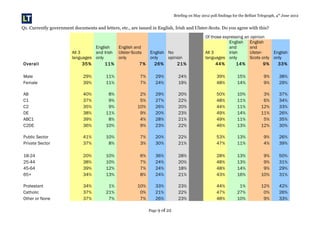
- 65% refused to answer whether they would encourage a close relative to join the PSNI, indicating lingering fears about policing.
- Support for public spending cuts over tax increases to address budget shortfalls, with majority support across demographic groups.
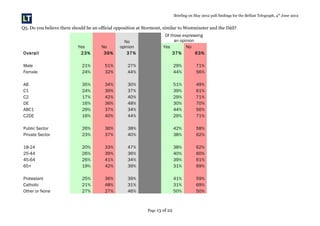
- Mixed views on reforms to Stormont, with broad support for reducing MLAs but rejection of an official opposition.
- Catholics tended to be more skeptical of changes to the 1998 agreements than other groups.
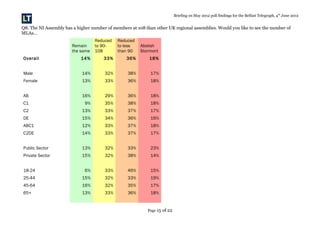
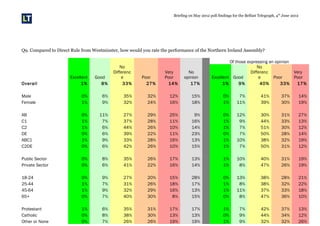
- Low ratings of the Northern Ireland Assembly's performance but also low support for abolishing Stormont.
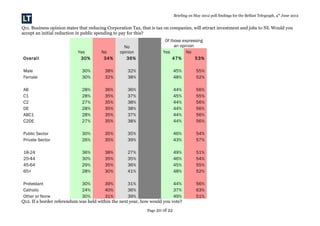
- Majority opposition to an immediate unfunded cut to corporation tax that required initial spending reductions.
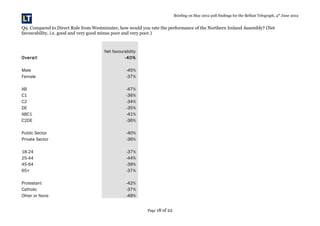
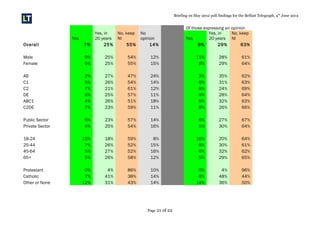
- Clear majority preference for