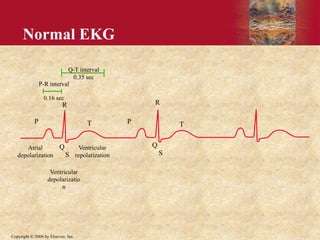
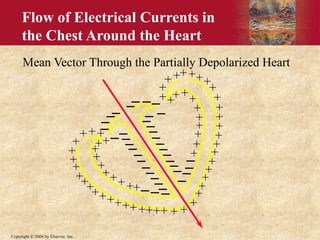
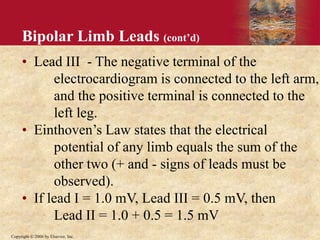
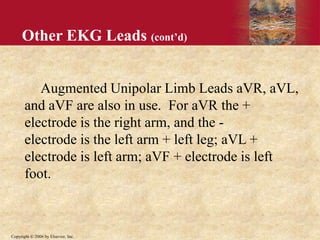
U N I T III
Textbook of Medical Physiology, 11th Edition
GUYTON & HALL
Copyright © 2006 by Elsevier, Inc.
Chapter 11:
The Normal Electrocardiogram
Slides by R. Davis Manning, Jr., PhD
Copyright © 2006 by Elsevier, Inc.
P-R interval
0.16 sec
P T
R
Q
S
Q-T interval
0.35 sec
Atrial
depolarization
Ventricular
depolarizatio
n
Ventricular
repolarization
P
R
Q
S
T
Normal EKG
Copyright © 2006 by Elsevier, Inc.
EKG Concepts
• The P wave immediately precedes atrial
contraction.
• The QRS complex immediately precedes
ventricular contraction.
• The ventricles remain contracted until a few
milliseconds after the end of the T
repolarization wave.
• The atria remain contracted until the atria are
repolarized, but an atrial repolarization wave
cannot be seen on the electrocardiogram
because it is obscured by the QRS wave.
Copyright © 2006 by Elsevier, Inc.
EKG Concepts (cont’d)
• The P-Q or P-R interval on the
electrocardiogram has a normal value of 0.16
seconds and is the duration of time between
the beginning of the P wave and the
beginning of the QRS wave; this represents
the time between the beginning of atrial
contraction and the beginning of ventricular
contraction.
Copyright © 2006 by Elsevier, Inc.
EKG Concepts (cont’d)
• The Q-T interval has a normal value of 0.35
seconds and is the duration of time from the
beginning of the Q wave to the end of the T
wave; this approximates the time of
ventricular contraction.
• The heart rate can be determined with the
reciprocal of the time interval between each
heartbeat.
Copyright © 2006 by Elsevier, Inc.
Standardized EKG’s
• Time and voltage calibrations are
standardized as shown on figure 11-1.
Figure 11-1; Guyton & Hall
Copyright © 2006 by Elsevier, Inc.
Depolarization and Repolarization Waves
• Note that no potential is recorded when the
ventricular muscle is either completely depolarized
or repolarized. (Fig. 11-2)
Figure 11-2;
Guyton & Hall
Copyright © 2006 by Elsevier, Inc.
Heart Rate Calculation
• R-R interval = 0.83 sec
• Heart rate = (60 sec)/(0.83 sec) = 72 beats/min
min beat
Copyright © 2006 by Elsevier, Inc.
Flow of Electrical Currents in
the Chest Around the Heart
_
_
_
_ _
_
_
_
_
_
_
_
_
_
_
_
_
_
_
_
__
__
__
_ _
_
_
_
_
_
_
_
__
_
_
+
+
+
+
+
+
+
+
+
+
+
+
+
+
+
+
+
+
+
+ +
+
++++
+
+
+
+
+
+
+
+
+
+
+
+
+
+
+
+
+
+
++++
+
++
+
+
+
+
+
+
+
++
++++
Mean Vector Through the Partially Depolarized Heart
Copyright © 2006 by Elsevier, Inc.
Flow of Electrical Currents in the
Chest Around the Heart (cont’d)
• Ventricular depolarization starts at the
ventricular septum and the endocardial
surfaces of the heart.
• The average current flows positively from the
base of the heart to the apex.
• At the very end of depolarization the current
reverses from 1/100 second and flows
toward the outer walls of the ventricles
near the base (S wave).
Copyright © 2006 by Elsevier, Inc.
Bipolar Limb Leads
• Bipolar means that the
EKG is recorded from
two electrodes on the
body.
Figure 11-6; Guyton & Hall
Copyright © 2006 by Elsevier, Inc.
Bipolar Limb Leads (cont’d)
• Lead I - The negative terminal of the
electrocardiogram is connected to the right
arm, and the positive terminal is connected to
the left arm.
• Lead II - The negative terminal of the
electrocardiogram is connected to the right
arm, and the positive terminal is connected
to the left leg.
Copyright © 2006 by Elsevier, Inc.
Bipolar Limb Leads (cont’d)
• Lead III - The negative terminal of the
electrocardiogram is connected to the left arm,
and the positive terminal is connected to the
left leg.
• Einthoven’s Law states that the electrical
potential of any limb equals the sum of the
other two (+ and - signs of leads must be
observed).
• If lead I = 1.0 mV, Lead III = 0.5 mV, then
Lead II = 1.0 + 0.5 = 1.5 mV
Copyright © 2006 by Elsevier, Inc.
Bipolar Limb Leads (cont’d)
Figure 11-7; Guyton & Hall
0.5 mV
1.2 mV
0.7 mV
Copyright © 2006 by Elsevier, Inc.
Other EKG Leads
• Chest Leads (Precordial Leads) known as V1-
V6 are very sensitive to electrical potential
changes underneath the electrode.
Figure 11-9; Guyton & Hall
Copyright © 2006 by Elsevier, Inc.
Other EKG Leads (cont’d)
Augmented Unipolar Limb Leads aVR, aVL,
and aVF are also in use. For aVR the +
electrode is the right arm, and the -
electrode is the left arm + left leg; aVL +
electrode is left arm; aVF + electrode is left
foot.
Copyright © 2006 by Elsevier, Inc.
Chapter 11 Objectives
1. Understand the different “waves” in a normal
electrocardiogram.
2. Learn the normal P-R and Q-T interval time
of the QRS wave.
3. Learn the difference in depolarization and
repolarization waves.
Copyright © 2006 by Elsevier, Inc.
Chapter 11 Objectives
4. Learn the voltage and time calibration of an
electrocardiogram chart.
5. Learn the arrangement of electrodes in the
bipolar limb leads, chest leads, and unipolar
leads.
6. Understand Einthoven’s law.

11.The normal electrocardiogram.ppt

  • 1.
    U N IT III Textbook of Medical Physiology, 11th Edition GUYTON & HALL Copyright © 2006 by Elsevier, Inc. Chapter 11: The Normal Electrocardiogram Slides by R. Davis Manning, Jr., PhD
  • 2.
    Copyright © 2006by Elsevier, Inc. P-R interval 0.16 sec P T R Q S Q-T interval 0.35 sec Atrial depolarization Ventricular depolarizatio n Ventricular repolarization P R Q S T Normal EKG
  • 3.
    Copyright © 2006by Elsevier, Inc. EKG Concepts • The P wave immediately precedes atrial contraction. • The QRS complex immediately precedes ventricular contraction. • The ventricles remain contracted until a few milliseconds after the end of the T repolarization wave. • The atria remain contracted until the atria are repolarized, but an atrial repolarization wave cannot be seen on the electrocardiogram because it is obscured by the QRS wave.
  • 4.
    Copyright © 2006by Elsevier, Inc. EKG Concepts (cont’d) • The P-Q or P-R interval on the electrocardiogram has a normal value of 0.16 seconds and is the duration of time between the beginning of the P wave and the beginning of the QRS wave; this represents the time between the beginning of atrial contraction and the beginning of ventricular contraction.
  • 5.
    Copyright © 2006by Elsevier, Inc. EKG Concepts (cont’d) • The Q-T interval has a normal value of 0.35 seconds and is the duration of time from the beginning of the Q wave to the end of the T wave; this approximates the time of ventricular contraction. • The heart rate can be determined with the reciprocal of the time interval between each heartbeat.
  • 6.
    Copyright © 2006by Elsevier, Inc. Standardized EKG’s • Time and voltage calibrations are standardized as shown on figure 11-1. Figure 11-1; Guyton & Hall
  • 7.
    Copyright © 2006by Elsevier, Inc. Depolarization and Repolarization Waves • Note that no potential is recorded when the ventricular muscle is either completely depolarized or repolarized. (Fig. 11-2) Figure 11-2; Guyton & Hall
  • 8.
    Copyright © 2006by Elsevier, Inc. Heart Rate Calculation • R-R interval = 0.83 sec • Heart rate = (60 sec)/(0.83 sec) = 72 beats/min min beat
  • 9.
    Copyright © 2006by Elsevier, Inc. Flow of Electrical Currents in the Chest Around the Heart _ _ _ _ _ _ _ _ _ _ _ _ _ _ _ _ _ _ _ _ __ __ __ _ _ _ _ _ _ _ _ _ __ _ _ + + + + + + + + + + + + + + + + + + + + + + ++++ + + + + + + + + + + + + + + + + + + ++++ + ++ + + + + + + + ++ ++++ Mean Vector Through the Partially Depolarized Heart
  • 10.
    Copyright © 2006by Elsevier, Inc. Flow of Electrical Currents in the Chest Around the Heart (cont’d) • Ventricular depolarization starts at the ventricular septum and the endocardial surfaces of the heart. • The average current flows positively from the base of the heart to the apex. • At the very end of depolarization the current reverses from 1/100 second and flows toward the outer walls of the ventricles near the base (S wave).
  • 11.
    Copyright © 2006by Elsevier, Inc. Bipolar Limb Leads • Bipolar means that the EKG is recorded from two electrodes on the body. Figure 11-6; Guyton & Hall
  • 12.
    Copyright © 2006by Elsevier, Inc. Bipolar Limb Leads (cont’d) • Lead I - The negative terminal of the electrocardiogram is connected to the right arm, and the positive terminal is connected to the left arm. • Lead II - The negative terminal of the electrocardiogram is connected to the right arm, and the positive terminal is connected to the left leg.
  • 13.
    Copyright © 2006by Elsevier, Inc. Bipolar Limb Leads (cont’d) • Lead III - The negative terminal of the electrocardiogram is connected to the left arm, and the positive terminal is connected to the left leg. • Einthoven’s Law states that the electrical potential of any limb equals the sum of the other two (+ and - signs of leads must be observed). • If lead I = 1.0 mV, Lead III = 0.5 mV, then Lead II = 1.0 + 0.5 = 1.5 mV
  • 14.
    Copyright © 2006by Elsevier, Inc. Bipolar Limb Leads (cont’d) Figure 11-7; Guyton & Hall 0.5 mV 1.2 mV 0.7 mV
  • 15.
    Copyright © 2006by Elsevier, Inc. Other EKG Leads • Chest Leads (Precordial Leads) known as V1- V6 are very sensitive to electrical potential changes underneath the electrode. Figure 11-9; Guyton & Hall
  • 16.
    Copyright © 2006by Elsevier, Inc. Other EKG Leads (cont’d) Augmented Unipolar Limb Leads aVR, aVL, and aVF are also in use. For aVR the + electrode is the right arm, and the - electrode is the left arm + left leg; aVL + electrode is left arm; aVF + electrode is left foot.
  • 17.
    Copyright © 2006by Elsevier, Inc. Chapter 11 Objectives 1. Understand the different “waves” in a normal electrocardiogram. 2. Learn the normal P-R and Q-T interval time of the QRS wave. 3. Learn the difference in depolarization and repolarization waves.
  • 18.
    Copyright © 2006by Elsevier, Inc. Chapter 11 Objectives 4. Learn the voltage and time calibration of an electrocardiogram chart. 5. Learn the arrangement of electrodes in the bipolar limb leads, chest leads, and unipolar leads. 6. Understand Einthoven’s law.