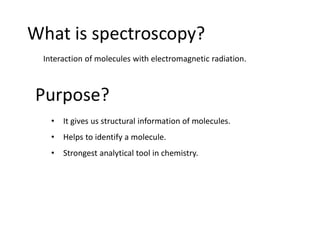
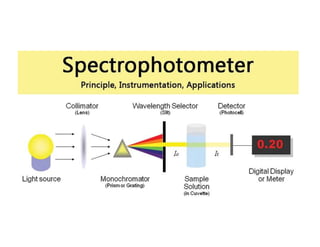
What is spectroscopy?
Purpose?
Interactionof molecules with electromagnetic radiation.
• It gives us structural information of molecules.
• Helps to identify a molecule.
• Strongest analytical tool in chemistry.
3.
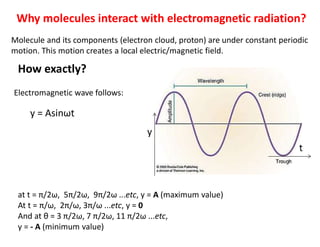
Why molecules interactwith electromagnetic radiation?
How exactly?
Molecule and its components (electron cloud, proton) are under constant periodic
motion. This motion creates a local electric/magnetic field.
y = Asinωt
y
t
Electromagnetic wave follows:
at t = π/2ω, 5π/2ω, 9π/2ω ...etc, y = A (maximum value)
At t = π/ω, 2π/ω, 3π/ω ...etc, y = 0
And at θ = 3 π/2ω, 7 π/2ω, 11 π/2ω ...etc,
y = - A (minimum value)
4.
-
+
-
+
-
+
- +
-
+
x
y
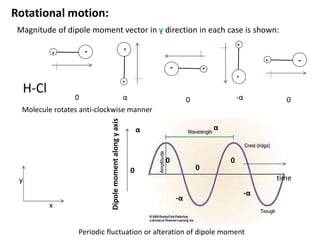
Magnitude ofdipole moment vector in y direction in each case is shown:
-α
0 α 0 0
0
α
0
-α
time
Dipole
moment
along
y
axis
α
-α
0
0
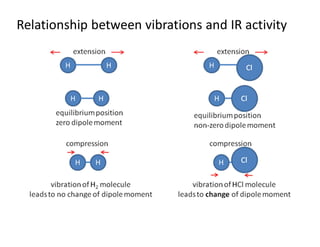
Molecule rotates anti-clockwise manner
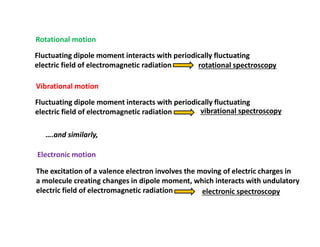
Rotational motion:
Periodic fluctuation or alteration of dipole moment
H-Cl
Rotational motion
Fluctuating dipolemoment interacts with periodically fluctuating
electric field of electromagnetic radiation
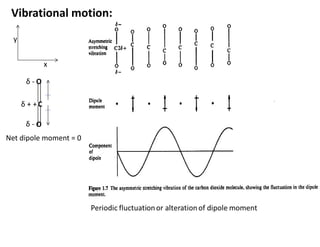
Vibrational motion
Fluctuating dipole moment interacts with periodically fluctuating
electric field of electromagnetic radiation
Electronic motion
The excitation of a valence electron involves the moving of electric charges in
a molecule creating changes in dipole moment, which interacts with undulatory
electric field of electromagnetic radiation
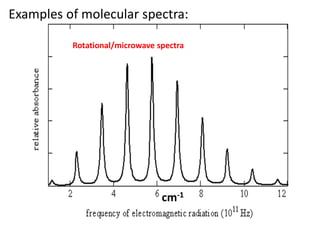
rotational spectroscopy
vibrational spectroscopy
electronic spectroscopy
….and similarly,
7.
Region of spectrum:
E= hν, c = νλ, E = hc/λ or, E = hcλ-1 = hcν [ where ν
stands for ‘nu bar’, wave number]
γ-ray
X-ray
Visible &
Ultra violet
Infra red
Micro wave
Radio
wave
100 pm -
onwards
10 nm – 100 pm
0.8 μm – 10 nm
100 μm – 0.8 μm
1 cm - 100 μm
10 m – 1 cm
λ =
Longer λ
Lower energy
Lower frequency
Shorter λ
Higher energy
Higher frequency
8.
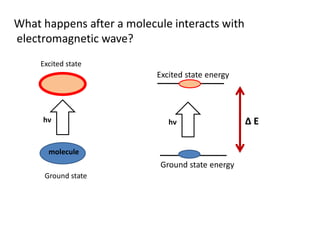
What happens aftera molecule interacts with
electromagnetic wave?
molecule
Ground state
hν
Excited state
Ground state energy
Excited state energy
hν Δ E
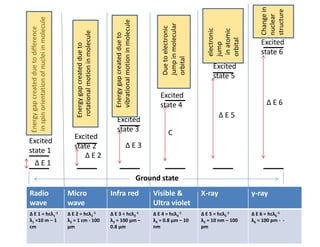
9.
Ground state
Excited
state 1
Excited
state2
Excited
state 3
Excited
state 4
Excited
state 5
Excited
state 6
Δ E 2
Δ E 1
Δ E 3
C
Δ E 5
Δ E 6
Energy
gap
created
due
to
difference
in
spin
orientation
of
nuclei
in
molecule
Energy
gap
created
due
to
rotational
motion
in
molecule
Energy
gap
created
due
to
vibrational
motion
in
molecule
Due
to
electronic
jump
in
molecular
orbital
electronic
jump
in
atomic
orbital
Change
in
nuclear
structure
γ-ray
X-ray
Visible &
Ultra violet
Infra red
Micro
wave
Radio
wave
Δ E 6 = hcλ6
-1
λ6 = 100 pm - -
Δ E 5 = hcλ5
-1
λ5 = 10 nm – 100
pm
Δ E 4 = hcλ4
-1
λ4 = 0.8 μm – 10
nm
Δ E 3 = hcλ3
-1
λ3 = 100 μm –
0.8 μm
Δ E 2 = hcλ2
-1
λ2 = 1 cm - 100
μm
Δ E 1 = hcλ1
-1
λ1 =10 m – 1
cm
10.
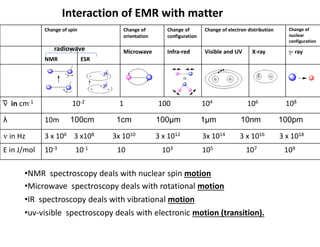
Interaction of EMRwith matter
Change of
nuclear
configuration
Change of electron distribution
Change of
configuration
Change of
orientation
Change of spin
- ray
X-ray
Visible and UV
Infra-red
Microwave
ESR
NMR
10-2 1 100 104 106 108
͞ in cm-1
10m 100cm 1cm 100μm 1μm 10nm 100pm
λ
3 x 10⁶ 3 x10⁸ 3x 10¹⁰ 3 x 10¹² 3x 10¹⁴ 3 x 10¹⁶ 3 x 10¹⁸
in Hz
10-3 10-1 10 103 105 107 109
E in J/mol
Or
radiowave
•NMR spectroscopy deals with nuclear spin motion
•Microwave spectroscopy deals with rotational motion
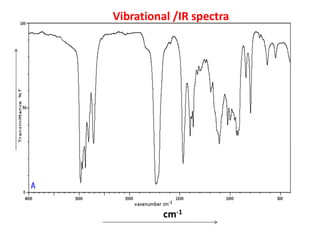
•IR spectroscopy deals with vibrational motion
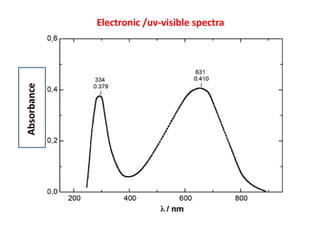
•uv-visible spectroscopy deals with electronic motion (transition).
What are commonin the last 3 examples?
•These are nothing but graph plots.
•There are peaks of curves as well as sharp lines.
•In the ‘y’ axis, either ‘absorbance’ or ‘transmittance’ is plotted
•in ‘x’ axis parameters of an electromagnetic radiation
(wave numbers or wavelength) have been plotted.
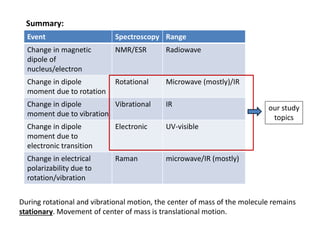
15.
Range
Spectroscopy
Event
Radiowave
NMR/ESR
Change in magnetic
dipoleof
nucleus/electron
Microwave (mostly)/IR
Rotational
Change in dipole
moment due to rotation
IR
Vibrational
Change in dipole
moment due to vibration
UV-visible
Electronic
Change in dipole
moment due to
electronic transition
microwave/IR (mostly)
Raman
Change in electrical
polarizability due to
rotation/vibration
our study
topics
Summary:
During rotational and vibrational motion, the center of mass of the molecule remains
stationary. Movement of center of mass is translational motion.
v
m1
r1
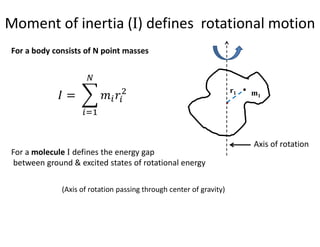
Moment of inertia(I) defines rotational motion
Axis of rotation
For a body consists of N point masses
For a molecule I defines the energy gap
between ground & excited states of rotational energy
(Axis of rotation passing through center of gravity)
18.
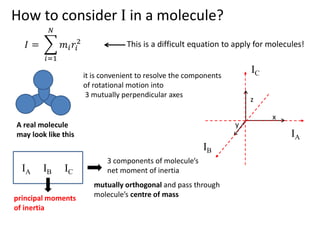
How to considerI in a molecule?
This is a difficult equation to apply for molecules!
A real molecule
may look like this
it is convenient to resolve the components
of rotational motion into
3 mutually perpendicular axes
z
x
y
IA
IC
IB
IA IB IC
3 components of molecule’s
net moment of inertia
mutually orthogonal and pass through
molecule’s centre of mass
principal moments
of inertia
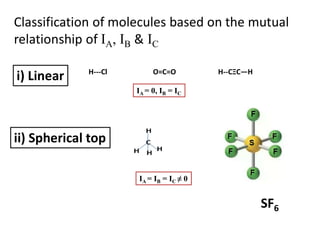
19.
Classification of moleculesbased on the mutual
relationship of IA, IB & IC
i) Linear H---Cl O=C=O H--CΞC—H
IA = 0, IB = IC
ii) Spherical top
IA = IB = IC ≠ 0
SF6
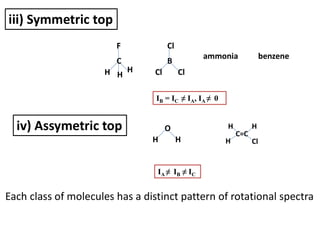
20.
iii) Symmetric top
IB= IC ≠ IA, IA ≠ 0
iv) Assymetric top
IA ≠ IB ≠ IC
O
H
H
C=C
H
H
H Cl
C
F
H
H
H
B
Cl
Cl
Cl
ammonia benzene
Each class of molecules has a distinct pattern of rotational spectra
21.
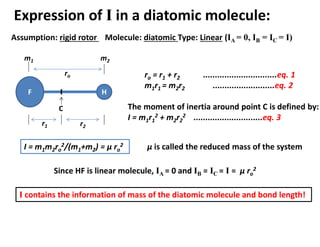
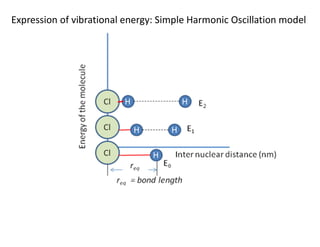
Expression of Iin a diatomic molecule:
Assumption: rigid rotor Molecule: diatomic Type: Linear (IA = 0, IB = IC = I)
H
F
m1 m2
ro
C
r1 r2
ro = r1 + r2 ...............................eq. 1
m1r1 = m2r2 ..........................eq. 2
The moment of inertia around point C is defined by:
I = m1r1
2 + m2r2
2 .............................eq. 3
I = m1m2ro
2/(m1+m2) = μ ro
2 μ is called the reduced mass of the system
Since HF is linear molecule, IA = 0 and IB = IC = I = μ ro
2
I contains the information of mass of the diatomic molecule and bond length!
22.
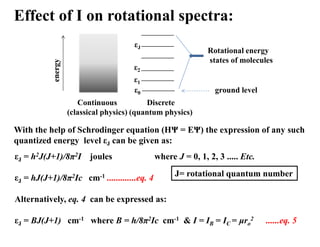
Effect of Ion rotational spectra:
energy
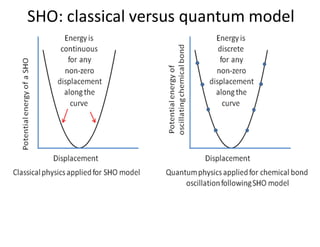
Continuous
(classical physics)
Discrete
(quantum physics)
ground level
ε0
ε1
ε2
εJ
Rotational energy
states of molecules
εJ = h2J(J+1)/8π2I joules where J = 0, 1, 2, 3 ..... Etc.
εJ = hJ(J+1)/8π2Ic cm-1 .............eq. 4
Alternatively, eq. 4 can be expressed as:
εJ = BJ(J+1) cm-1 where B = h/8π2Ic cm-1 & I = IB = IC = μro
2 ......eq. 5
With the help of Schrodinger equation (HΨ = EΨ) the expression of any such
quantized energy level εJ can be given as:
J= rotational quantum number
23.
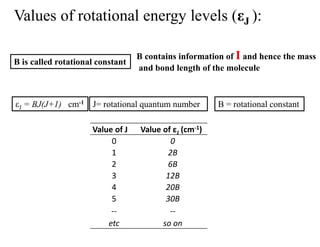
Values of rotationalenergy levels (εJ ):
Value of εJ (cm-1)
Value of J
0
0
2B
1
6B
2
12B
3
20B
4
30B
--
so on
5
--
etc
εJ = BJ(J+1) cm-1 B = rotational constant
J= rotational quantum number
B is called rotational constant
B contains information of I and hence the mass
and bond length of the molecule
24.
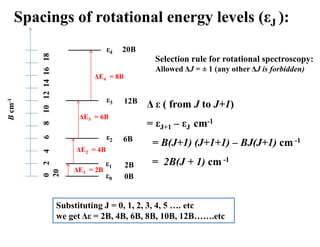
Spacings of rotationalenergy levels (εJ ):
B
cm
-1
0
2
4
6
8
10
12
14
16
18
20
ε0
ε1
ε2
ε3
ε4
0B
2B
6B
12B
20B
ΔE1 = 2B
ΔE2 = 4B
ΔE3 = 6B
ΔE4 = 8B
Selection rule for rotational spectroscopy:
Allowed ΔJ = ± 1 (any other ΔJ is forbidden)
Δ ε ( from J to J+1)
= εJ+1 – εJ cm-1
= B(J+1) (J+1+1) – BJ(J+1) cm -1
= 2B(J + 1) cm -1
Substituting J = 0, 1, 2, 3, 4, 5 …. etc
we get Δε = 2B, 4B, 6B, 8B, 10B, 12B…….etc
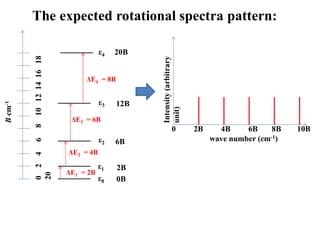
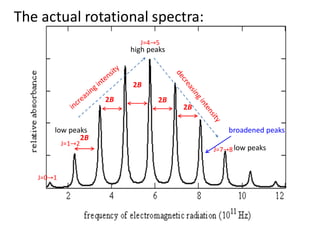
The actual rotationalspectra:
2B
2B
2B
2B
2B
broadened peaks
high peaks
low peaks
low peaks
J=0 1
J=1 2
J=4 5
J=7 8
27.
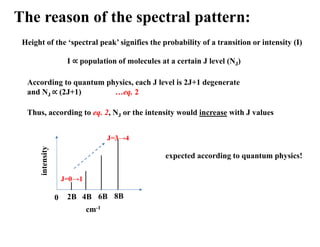
The reason ofthe spectral pattern:
Height of the ‘spectral peak’ signifies the probability of a transition or intensity (I)
I population of molecules at a certain J level (NJ)
If population at J = 0 is denoted by N0, then the following distribution applies to
rotational spectroscopy:
𝑱
𝟎
=
𝑬𝑱
𝑲𝑩𝑻 [KB: Boltzmann const, T: Kelvin]
…eq. 1
According to eq. 1, NJ or the intensity would decrease with J values
intensity
cm-1
2B 4B 6B 8B
0
expected according to Boltzmann distribution!
J=0→1
J=3→4
28.
The reason ofthe spectral pattern:
Height of the ‘spectral peak’ signifies the probability of a transition or intensity (I)
I population of molecules at a certain J level (NJ)
According to quantum physics, each J level is 2J+1 degenerate
and NJ (2J+1) …eq. 2
Thus, according to eq. 2, NJ or the intensity would increase with J values
intensity
cm-1
2B 4B 6B 8B
0
expected according to quantum physics!
J=0→1
J=3→4
29.
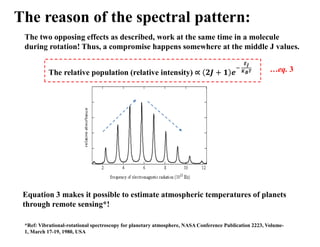
The reason ofthe spectral pattern:
The two opposing effects as described, work at the same time in a molecule
during rotation! Thus, a compromise happens somewhere at the middle J values.
The relative population (relative intensity)
𝑬𝑱
𝑲𝑩𝑻 …eq. 3
Equation 3 makes it possible to estimate atmospheric temperatures of planets
through remote sensing*!
*Ref: Vibrational-rotational spectroscopy for planetary atmosphere, NASA Conference Publication 2223, Volume-
1, March 17-19, 1980, USA
30.
Application
• Are microwavespectroscopy and cooking in microwave oven related?
In microwave oven, food is excited with microwave radiation. The
biomolecules of food are far too large for rotation. It is the water molecule
only that absorbs the Microwave, reaches higher rotational energy states
and re-emits the excess rotational energy as heat.
• Estimation of bond lengths of polar molecules
• Estimation of abundance of isotopes
• Remote sensing of planetary gaseous molecules and their temperatures
1. Predict whichof the following molecules will show rotational spectroscopy?
NH3, XeF4, SO2, CO2, HF, SF6, H2S, C2H2
2. Classify the following molecules in terms of linear, symmetric top,
spherical top and asymmetric top:
cyclobutane, CF4, SO2, NF3, O2, PH3
3. In the year 1950, a group of scientist measured the first line in the
rotation spectrum of CO as 3.842 cm-1. Hence they calculated the bond
length of CO. What was their calculation in Å?
[given: absolute mass of H atom = 1.673 × 10⁻²⁷ Kg, atomic wt of C = 12.00
and O = 15.99]
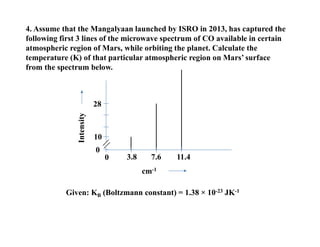
35.
cm-1
Intensity
0
28
3.8 7.6 11.4
0
4.Assume that the Mangalyaan launched by ISRO in 2013, has captured the
following first 3 lines of the microwave spectrum of CO available in certain
atmospheric region of Mars, while orbiting the planet. Calculate the
temperature (K) of that particular atmospheric region on Mars’ surface
from the spectrum below.
Given: KB (Boltzmann constant) = 1.38 × 10⁻²³ JK-1
10
Force (f) =- k. x
Potential energy (E) = ½ (k.x2)
[k is known as the force constant]
Hooke’s law
Force (f) = - k(r-req)
Potential energy (E) = ½ k(r-req)2
Simple harmonic oscillation model
1
2π
√(k/μ) Hz
ωosc = 1
2π
√(k/m) Hz
ωosc =
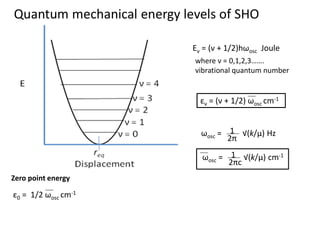
Simple Harmonic Oscillation model
Eν = (ν+ 1/2)hωosc Joule
εν = (ν + 1/2) ωosc cm-1
where ν = 0,1,2,3…….
vibrational quantum number
Quantum mechanical energy levels of SHO
1
2π
√(k/μ) Hz
ωosc =
1
2πc
√(k/μ) cm-1
ωosc =
ε0 = 1/2 ωosc cm-1
Zero point energy
43.
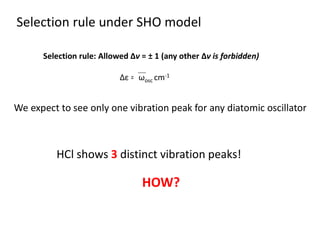
Selection rule: AllowedΔν = ± 1 (any other Δν is forbidden)
Selection rule under SHO model
Δε = ωosc cm-1
We expect to see only one vibration peak for any diatomic oscillator
HCl shows 3 distinct vibration peaks!
HOW?
44.
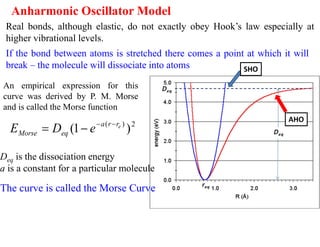
Anharmonic Oscillator Model
Realbonds, although elastic, do not exactly obey Hook’s law especially at
higher vibrational levels.
An empirical expression for this
curve was derived by P. M. Morse
and is called the Morse function
2
)
(
)
1
( e
r
r
a
eq
Morse e
D
E
Deq is the dissociation energy
a is a constant for a particular molecule
The curve is called the Morse Curve
If the bond between atoms is stretched there comes a point at which it will
break – the molecule will dissociate into atoms SHO
AHO
45.
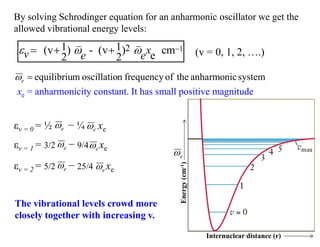
By solving Schrodingerequation for an anharmonic oscillator we get the
allowed vibrational energy levels:
1
2
1 1
(v ) - (v ) cm
e
2 2
x
v e e
(v = 0, 1, 2, ….)
system
anharmonic
the
of
frequency
n
oscillatio
m
equilibriu
e
xe = anharmonicity constant. It has small positive magnitude
The vibrational levels crowd more
closely together with increasing v.
Internuclear distance (r)
Energy
(cm
-1
)
e
εv = 1 = 3/2 − 9/4 xe
e
e
εv = 2 = 5/2 − 25/4 xe
e
e
εv = 0 = ½ − ¼ xe
e
e
46.
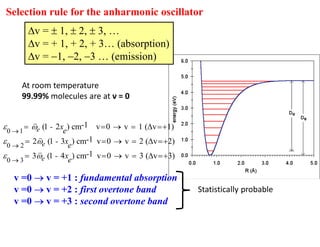
Selection rule forthe anharmonic oscillator
v = 1, 2, 3, …
v = + 1, + 2, + 3… (absorption)
v = 1, 2, 3 … (emission)
0 1
0 2
0 3
-1
(1 2 ) cm v 0 v 1 ( v 1)
-1
2 (1 3 ) cm v 0 v 2 ( v 2)
-1
3 (1 4 ) cm v 0 v 3 ( v 3)
e
e
e
- xe
- xe
- xe
v =0 v = +1 : fundamental absorption
v =0 v = +2 : first overtone band
v =0 v = +3 : second overtone band
Statistically probable
At room temperature
99.99% molecules are at ν = 0
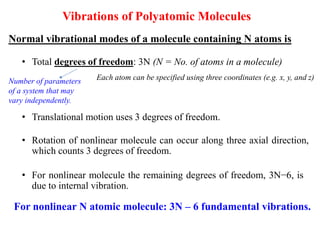
• Total degreesof freedom: 3N (N = No. of atoms in a molecule)
Each atom can be specified using three coordinates (e.g. x, y, and z)
Vibrations of Polyatomic Molecules
Normal vibrational modes of a molecule containing N atoms is
• Translational motion uses 3 degrees of freedom.
• Rotation of nonlinear molecule can occur along three axial direction,
which counts 3 degrees of freedom.
• For nonlinear molecule the remaining degrees of freedom, 3N−6, is
due to internal vibration.
For nonlinear N atomic molecule: 3N – 6 fundamental vibrations.
Number of parameters
of a system that may
vary independently.
49.
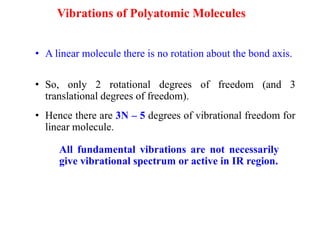
• A linearmolecule there is no rotation about the bond axis.
Vibrations of Polyatomic Molecules
All fundamental vibrations are not necessarily
give vibrational spectrum or active in IR region.
• So, only 2 rotational degrees of freedom (and 3
translational degrees of freedom).
• Hence there are 3N – 5 degrees of vibrational freedom for
linear molecule.
50.
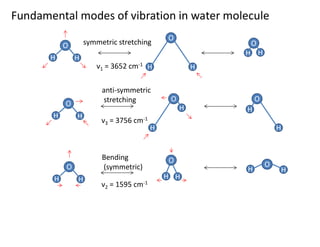
O
H H
symmetric stretching
O
HH
O
H H
O
H H
O
H
H
O
H
H
anti-symmetric
stretching
O
H H
O
H H
O
H H
Bending
(symmetric)
ν1 = 3652 cm-1
ν3 = 3756 cm-1
ν2 = 1595 cm-1
Fundamental modes of vibration in water molecule
51.
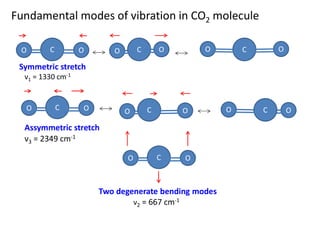
Fundamental modes ofvibration in CO2 molecule
O H
C O
O H
C O O H
C O
Symmetric stretch
Assymmetric stretch
O H
C O
O
O H
C O O H
C
O H
C O
Two degenerate bending modes
ν1 = 1330 cm-1
ν2 = 667 cm-1
ν3 = 2349 cm-1
52.
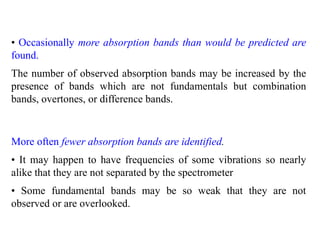
• Occasionally moreabsorption bands than would be predicted are
found.
The number of observed absorption bands may be increased by the
presence of bands which are not fundamentals but combination
bands, overtones, or difference bands.
More often fewer absorption bands are identified.
• It may happen to have frequencies of some vibrations so nearly
alike that they are not separated by the spectrometer
• Some fundamental bands may be so weak that they are not
observed or are overlooked.
53.
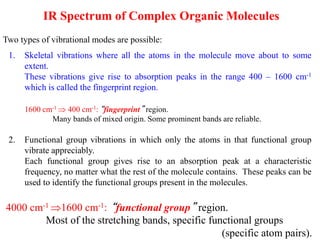
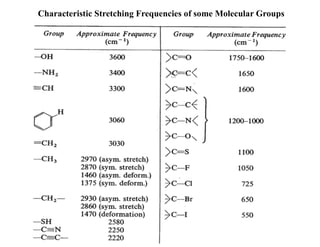
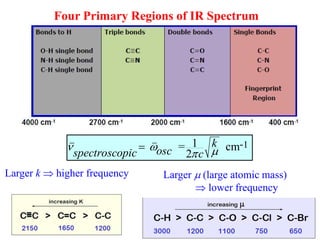
IR Spectrum ofComplex Organic Molecules
1. Skeletal vibrations where all the atoms in the molecule move about to some
extent.
These vibrations give rise to absorption peaks in the range 400 – 1600 cm-1
which is called the fingerprint region.
4000 cm-1 1600 cm-1: “functional group” region.
Most of the stretching bands, specific functional groups
(specific atom pairs).
2. Functional group vibrations in which only the atoms in that functional group
vibrate appreciably.
Each functional group gives rise to an absorption peak at a characteristic
frequency, no matter what the rest of the molecule contains. These peaks can be
used to identify the functional groups present in the molecules.
Two types of vibrational modes are possible:
1600 cm-1 400 cm-1: “fingerprint” region.
Many bands of mixed origin. Some prominent bands are reliable.
1
1
= cm
2
k -
osc
spectroscopicc
Larger (large atomic mass)
lower frequency
Larger k higher frequency
Four Primary Regions of IR Spectrum
56.
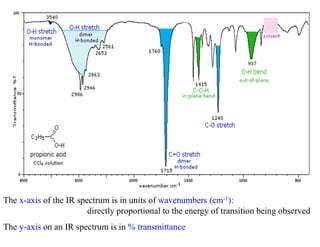
The x-axis ofthe IR spectrum is in units of wavenumbers (cm-1):
directly proportional to the energy of transition being observed
The y-axis on an IR spectrum is in % transmittance
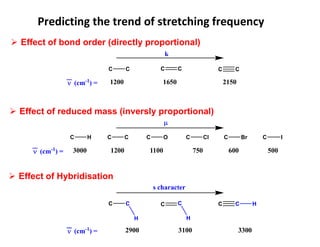
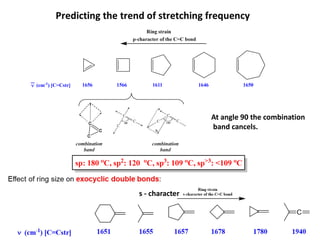
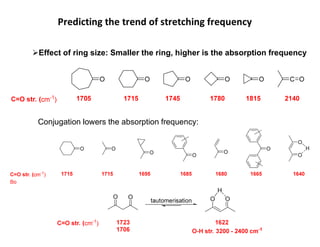
Predicting the trendof stretching frequency
Effect of bond order (directly proportional)
Effect of reduced mass (inversly proportional)
(cm-1
) =
C C C C C C
1200 1650 2150
k
C H C C C O C Cl C Br C I
(cm-1
) = 3000 1200 1100 750 600 500
(cm-1
) =
C C C C C C
2900 3100 3300
H H
H
s character
Effect of Hybridisation
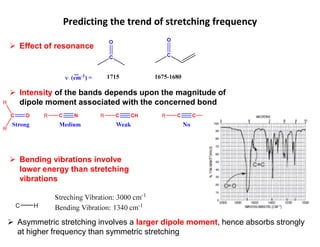
59.
Effect ofresonance
Intensity of the bands depends upon the magnitude of
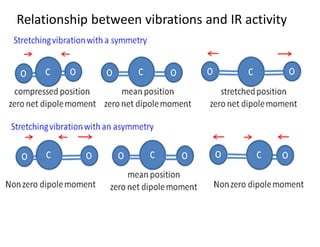
dipole moment associated with the concerned bond
Bending vibrations involve
lower energy than stretching
vibrations
Asymmetric stretching involves a larger dipole moment, hence absorbs strongly
at higher frequency than symmetric stretching
Predicting the trend of stretching frequency
The Born-Oppenheimer approximation
Etotal= Eelectronic + Evibration + Erotation + Enuclear spin
Electronic, vibrational, rotational and nuclear spin energies are independent of each
other and can be added up to yield the total energy of the molecule.
Above statement is true only when nuclear motion is neglected while
describing the electronic motion
Neglecting nuclear spin energy (since small) Equation 1 can be
re-written as Δεtotal = Δεelec + Δεvib + Δεrot cm-1 …eq. 2
The approximate orders of magnitude of these changes are:
Δεelec = Δεvib × 103 = Δεrot × 106 …eq. 3
[Δ = difference in energy between ground and excited states]
65.
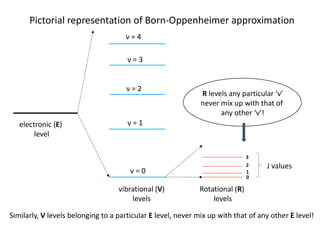
Pictorial representation ofBorn-Oppenheimer approximation
electronic (E)
level
vibrational (V)
levels
Rotational (R)
levels
ν = 0
ν = 1
ν = 2
ν = 3
ν = 4
0
J values
1
2
3
R levels any particular ‘ν’
never mix up with that of
any other ‘ν’!
Similarly, V levels belonging to a particular E level, never mix up with that of any other E level!
66.
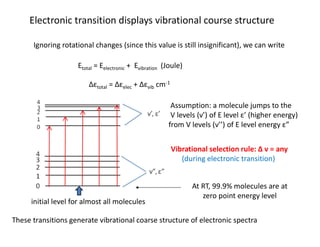
Electronic transition displaysvibrational course structure
Ignoring rotational changes (since this value is still insignificant), we can write
Etotal = Eelectronic + Evibration (Joule)
Δεtotal = Δεelec + Δεvib cm-1
Assumption: a molecule jumps to the
V levels (ν’) of E level ε’ (higher energy)
from V levels (ν’’) of E level energy ε”
Vibrational selection rule: Δ ν = any
(during electronic transition)
At RT, 99.9% molecules are at
zero point energy level
initial level for almost all molecules
These transitions generate vibrational coarse structure of electronic spectra
67.
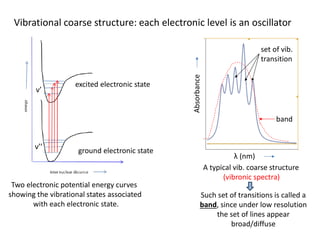
Vibrational coarse structure:each electronic level is an oscillator
Two electronic potential energy curves
showing the vibrational states associated
with each electronic state.
ground electronic state
excited electronic state
ν’’
ν’
Absorbance
λ (nm)
band
set of vib.
transition
A typical vib. coarse structure
(vibronic spectra)
Such set of transitions is called a
band, since under low resolution
the set of lines appear
broad/diffuse
68.
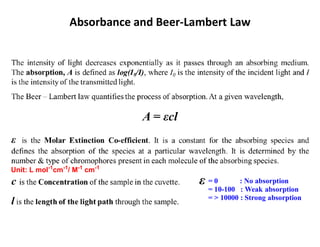
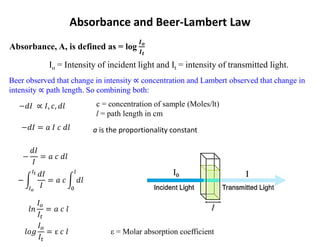
Absorbance and Beer-LambertLaw
Unit: L mol-1
cm-1
/ M-1
cm-1
= 0 : No absorption
= 10-100 : Weak absorption
= > 10000 : Strong absorption
69.
Absorbance and Beer-LambertLaw
Absorbance, A, is defined as = log
𝑰𝒐
𝑰𝒕
ε = Molar absorption coefficient
c = concentration of sample (Moles/lt)
l = path length in cm
Io = Intensity of incident light and It = intensity of transmitted light.
a is the proportionality constant
Beer observed that change in intensity concentration and Lambert observed that change in
intensity path length. So combining both:
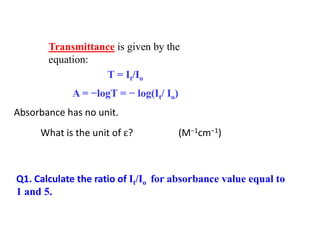
70.
Transmittance is givenby the
equation:
T = It/Io
A = −logT = − log(It/ Io)
Absorbance has no unit.
What is the unit of ? (M−1cm−1)
Q1. Calculate the ratio of It/Io for absorbance value equal to
1 and 5.
71.
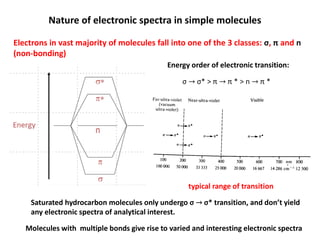
Nature of electronicspectra in simple molecules
Electrons in vast majority of molecules fall into one of the 3 classes: σ, π and n
(non-bonding)
σ σ* > π π * > n π *
Energy order of electronic transition:
typical range of transition
Saturated hydrocarbon molecules only undergo σ σ* transition, and don’t yield
any electronic spectra of analytical interest.
Molecules with multiple bonds give rise to varied and interesting electronic spectra
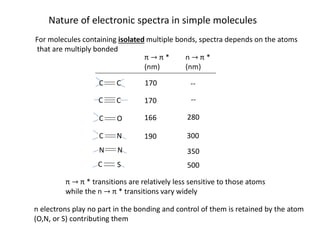
72.
For molecules containingisolated multiple bonds, spectra depends on the atoms
that are multiply bonded
Nature of electronic spectra in simple molecules
C C
O
N
S
C
N
C C
C
C
N
π π *
(nm)
n π *
(nm)
170
170
166
190
--
--
280
300
350
500
π π * transitions are relatively less sensitive to those atoms
while the n π * transitions vary widely
n electrons play no part in the bonding and control of them is retained by the atom
(O,N, or S) contributing them
73.
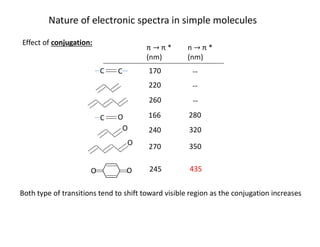
Nature of electronicspectra in simple molecules
Effect of conjugation:
π π *
(nm)
n π *
(nm)
C C
C O
O
O
O O
170
220
260
166
240
270
245
280
320
350
435
Both type of transitions tend to shift toward visible region as the conjugation increases
--
--
--
74.
-carotene, max =455 nm (Blue)
Appears Orange
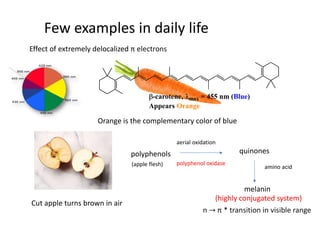
Effect of extremely delocalized π electrons
Few examples in daily life
Orange is the complementary color of blue
Cut apple turns brown in air
polyphenols
aerial oxidation
polyphenol oxidase
quinones
amino acid
melanin
(highly conjugated system)
n π * transition in visible range
(apple flesh)
75.
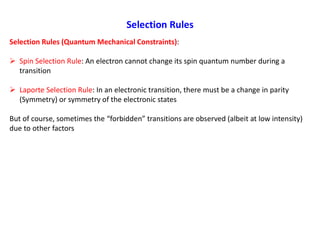
Selection Rules
Selection Rules(Quantum Mechanical Constraints):
Spin Selection Rule: An electron cannot change its spin quantum number during a
transition
Laporte Selection Rule: In an electronic transition, there must be a change in parity
(Symmetry) or symmetry of the electronic states
But of course, sometimes the “forbidden” transitions are observed (albeit at low intensity)
due to other factors

![Region of spectrum:
E = hν, c = νλ, E = hc/λ or, E = hcλ-1 = hcν [ where ν
stands for ‘nu bar’, wave number]
γ-ray
X-ray
Visible &
Ultra violet
Infra red
Micro wave
Radio
wave
100 pm -
onwards
10 nm – 100 pm
0.8 μm – 10 nm
100 μm – 0.8 μm
1 cm - 100 μm
10 m – 1 cm
λ =
Longer λ
Lower energy
Lower frequency
Shorter λ
Higher energy
Higher frequency](https://image.slidesharecdn.com/1137210711150spectroscopy-260114145500-ebde9f20/85/1137210711150_spectroscopy-pdfGDJDGJDFJJDJ-7-320.jpg)
![The reason of the spectral pattern:
Height of the ‘spectral peak’ signifies the probability of a transition or intensity (I)
I population of molecules at a certain J level (NJ)
If population at J = 0 is denoted by N0, then the following distribution applies to
rotational spectroscopy:
𝑱
𝟎
=
𝑬𝑱
𝑲𝑩𝑻 [KB: Boltzmann const, T: Kelvin]
…eq. 1
According to eq. 1, NJ or the intensity would decrease with J values
intensity
cm-1
2B 4B 6B 8B
0
expected according to Boltzmann distribution!
J=0→1
J=3→4](https://image.slidesharecdn.com/1137210711150spectroscopy-260114145500-ebde9f20/85/1137210711150_spectroscopy-pdfGDJDGJDFJJDJ-27-320.jpg)

![1. Predict which of the following molecules will show rotational spectroscopy?
NH3, XeF4, SO2, CO2, HF, SF6, H2S, C2H2
2. Classify the following molecules in terms of linear, symmetric top,
spherical top and asymmetric top:
cyclobutane, CF4, SO2, NF3, O2, PH3
3. In the year 1950, a group of scientist measured the first line in the
rotation spectrum of CO as 3.842 cm-1. Hence they calculated the bond
length of CO. What was their calculation in Å?
[given: absolute mass of H atom = 1.673 × 10⁻²⁷ Kg, atomic wt of C = 12.00
and O = 15.99]](https://image.slidesharecdn.com/1137210711150spectroscopy-260114145500-ebde9f20/85/1137210711150_spectroscopy-pdfGDJDGJDFJJDJ-34-320.jpg)
![Force (f) = - k. x
Potential energy (E) = ½ (k.x2)
[k is known as the force constant]
Hooke’s law
Force (f) = - k(r-req)
Potential energy (E) = ½ k(r-req)2
Simple harmonic oscillation model
1
2π
√(k/μ) Hz
ωosc = 1
2π
√(k/m) Hz
ωosc =
Simple Harmonic Oscillation model](https://image.slidesharecdn.com/1137210711150spectroscopy-260114145500-ebde9f20/85/1137210711150_spectroscopy-pdfGDJDGJDFJJDJ-40-320.jpg)


![The Born-Oppenheimer approximation
Etotal = Eelectronic + Evibration + Erotation + Enuclear spin
Electronic, vibrational, rotational and nuclear spin energies are independent of each
other and can be added up to yield the total energy of the molecule.
Above statement is true only when nuclear motion is neglected while
describing the electronic motion
Neglecting nuclear spin energy (since small) Equation 1 can be
re-written as Δεtotal = Δεelec + Δεvib + Δεrot cm-1 …eq. 2
The approximate orders of magnitude of these changes are:
Δεelec = Δεvib × 103 = Δεrot × 106 …eq. 3
[Δ = difference in energy between ground and excited states]](https://image.slidesharecdn.com/1137210711150spectroscopy-260114145500-ebde9f20/85/1137210711150_spectroscopy-pdfGDJDGJDFJJDJ-63-320.jpg)