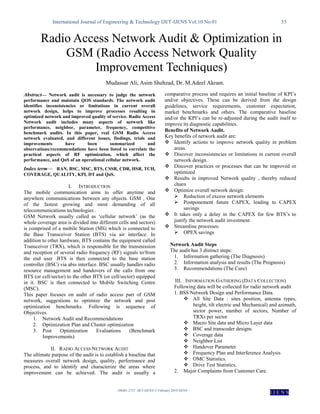
The document discusses network audit of a radio access network (RAN) in a GSM system. It provides details on:
1) The benefits of network audits in identifying issues, improving quality and processes, and optimizing network design.
2) The steps of a network audit including information gathering, analysis, and recommendations.
3) Key performance indicators measured for the RAN including accessibility, retainability, neighbor parameters, frequency planning, and competitive benchmarks.
4) An example audit of a city's network where data was collected and analyzed to identify problems and make recommendations for optimization.
![International Journal of Engineering & Technology IJET-IJENS Vol:10 No:01 58
108401-2727 IJET-IJENS © February 2010 IJENS
I J E N S
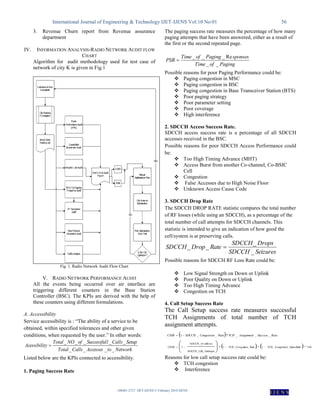
Fig. 3. Coverage Plot for Operator 2 for City K
Legend For Coverage is given below .
Formula For Coverage Rate:
100*
_
90_____
_
SamplesTotal
dbmstrengthSignalhavingsamplesofNo
RateCovergae
Results for Coverage rate for operator 1 and operator 2 taken
for city K are given below
KPI Operator 1 Operator 2
COVERAGE
RATE 94.64% 72.77%
Quality Comparison:
As visible from plots mentioned in Fig 4 and Fig 5 , Operator
1 has better quality than operator 1 , which is also visible in
KPIs
Fig. 4. Quality Plots for Operator 1 For City K.
Fig. 5. Quality Plots for Operator 2 for city K
Legend For Quality Plots is as follows :
Formula for Quality:
SamplesTotal
QualRXQualRXQualRXQualRXQualRXQualRXQualRX
Qualityceive
_
07.)6_5_4_()3_2_1_0_(
_Re
Results for receive quality for operator 1 and operator 2 taken
for city K.
KPI Operator 1 Operator 2
Rx QUALITY 88.19% 87.18%
VIII. REFERENCES
[1] Halonen T., Romero J., Melero J.: GSM, GPRS and EDGE
Performance. John Wiley & Sons Ltd, 2003.
[2] ITU-T recommendation G.1000 (2001), Communication quality of
Service: A framework and definition.
[3] Jens Zander. „Radio Resource Management for Wireless
Networks‟. Artech House Inc., 2001
[4] [4] Bilal Haider,M.Zafarrullah Khan, M.K.Islam: Radio Frequency
Optimization and QOS in operational GSM network.](https://image.slidesharecdn.com/108401-2727ijet-ijens-160310130523/85/108401-2727-ijet-ijens-4-320.jpg)


![51 gsm bss network performance ps kpi (upload rate) optimization manual[1].doc](https://cdn.slidesharecdn.com/ss_thumbnails/51gsmbssnetworkperformancepskpiuploadrateoptimizationmanual1-140618023146-phpapp02-thumbnail.jpg?width=640&height=640&fit=bounds)


![14 gsm bss network kpi (call setup time) optimization manual[1].doc](https://cdn.slidesharecdn.com/ss_thumbnails/14gsmbssnetworkkpicallsetuptimeoptimizationmanual1-140618022447-phpapp02-thumbnail.jpg?width=640&height=640&fit=bounds)


