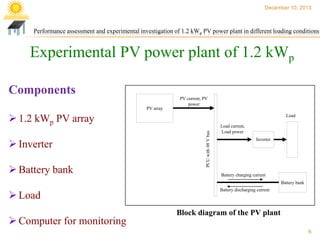
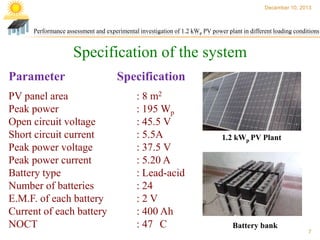
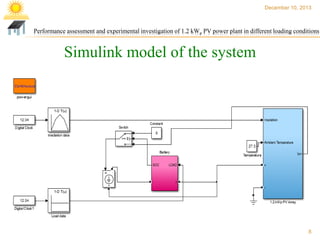
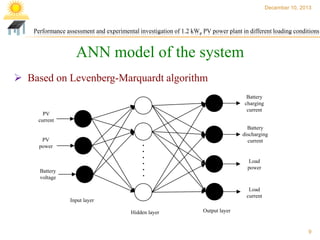
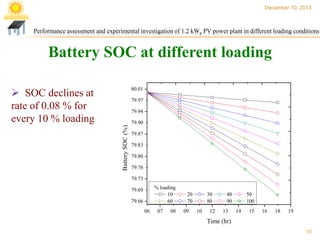
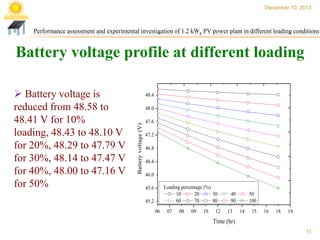
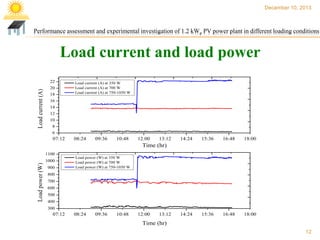
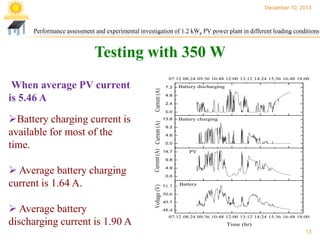
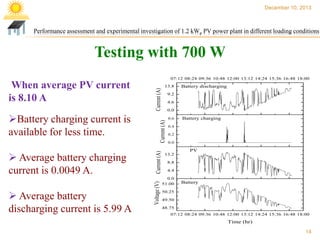
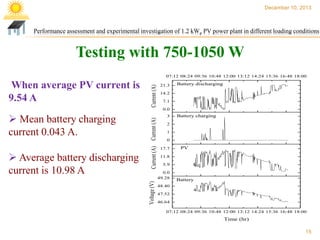
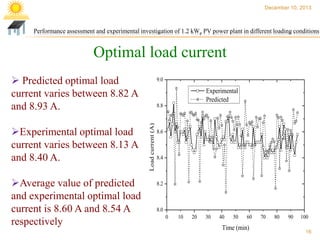
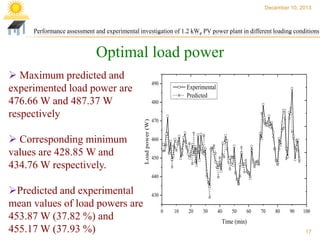
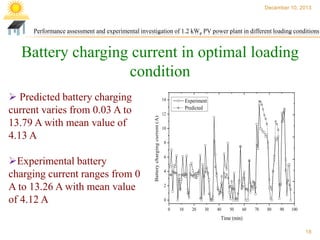
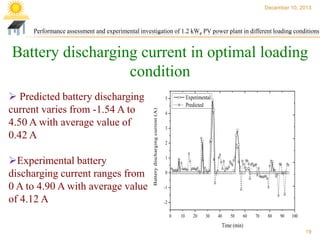
December 10, 2013

Performance assessment and experimental investigation of
1.2 kWp PV power plant in different loading conditions
Subhadeep Bhattacharjee, Shubhashish Bhakta, Shantanu Acharya
Department of Electrical Engineering
National Institute of Technology (NIT), Agartala, India
E-mail: subhadeep_bhattacharjee@yahoo.co.in

IVth International Conference on Advances in Energy Research (ICAER 2013), IIT Bombay
1
December 10, 2013

Performance assessment and experimental investigation of 1.2 kWp PV power plant in different loading conditions

Introduction
 Solar energy is an inexhaustible source of green energy.
 Solar radiation received by earth is 0.8 million kW
 0.1 % of the received radiation with 5 % conversion rate
would generate 40 times electrical energy consumed by
current world

2
December 10, 2013

Performance assessment and experimental investigation of 1.2 kWp PV power plant in different loading conditions

Different solar energy technologies
• Photovoltaic (PV) system
• Concentrating solar power (CSP)

• Transpired solar collector
or “Solar walls”

• Solar water heater systems
3
December 10, 2013

Performance assessment and experimental investigation of 1.2 kWp PV power plant in different loading conditions

Why PV system is popular than other solar
technology?
 Requires less space than other
solar technologies for same
amount of power generation

 Direct conversion of solar
energy into electrical energy
 Cost per watt of this
technology is less.

4
December 10, 2013

Performance assessment and experimental investigation of 1.2 kWp PV power plant in different loading conditions

Typical Stand-alone PV plant

5
December 10, 2013

Performance assessment and experimental investigation of 1.2 kWp PV power plant in different loading conditions

Experimental PV power plant of 1.2 kWp
Components
PV current, PV
power
PV array

 1.2 kWp PV array

 Battery bank

PCU with 48 V bus

 Inverter

Load
Load current,
Load power
Inverter

Battery charging current
Battery bank

 Load
 Computer for monitoring

Battery discharging current

Block diagram of the PV plant
6
December 10, 2013

Performance assessment and experimental investigation of 1.2 kWp PV power plant in different loading conditions

Specification of the system
Parameter
PV panel area
Peak power
Open circuit voltage
Short circuit current
Peak power voltage
Peak power current
Battery type
Number of batteries
E.M.F. of each battery
Current of each battery
NOCT

Specification
: 8 m2
: 195 Wp
: 45.5 V
: 5.5A
: 37.5 V
: 5.20 A
: Lead-acid
: 24
:2V
: 400 Ah
: 47 C

1.2 kWp PV Plant

Battery bank

7
December 10, 2013

Performance assessment and experimental investigation of 1.2 kWp PV power plant in different loading conditions

Simulink model of the system

8
December 10, 2013

Performance assessment and experimental investigation of 1.2 kWp PV power plant in different loading conditions

ANN model of the system
 Based on Levenberg-Marquardt algorithm
Battery
charging
current

PV
current

Battery
discharging
current

PV
power

Load
power

Battery
voltage

Load
current

Input layer
Hidden layer

Output layer

9
December 10, 2013

Performance assessment and experimental investigation of 1.2 kWp PV power plant in different loading conditions

Battery SOC at different loading
 SOC declines at
rate of 0.08 % for
every 10 % loading

80.01
79.97

Battery SOC (%)

79.94
79.90
79.87
79.83
79.80
79.76
79.73
% loading
10
60

79.69
79.66
06

07

08

20
70
09

30
80
10

12

40
90
13

50
100
14

15

16

18

19

Time (hr)
10
December 10, 2013

Performance assessment and experimental investigation of 1.2 kWp PV power plant in different loading conditions

Battery voltage profile at different loading
48.4
48.0

Battery voltage (V)

 Battery voltage is
reduced from 48.58 to
48.41 V for 10%
loading, 48.43 to 48.10 V
for 20%, 48.29 to 47.79 V
for 30%, 48.14 to 47.47 V
for 40%, 48.00 to 47.16 V
for 50%

47.6
47.2
46.8
46.4
46.0
Loading percentage (%)
10
20
30
60
70
80

45.6
45.2
06

07

08

09

10

12

40
90
13

50
100
14

15

16

18

19

Time (hr)
11
December 10, 2013

Performance assessment and experimental investigation of 1.2 kWp PV power plant in different loading conditions

Load current and load power
Load current (A)

22
20
18
16
14

Load current (A) at 350 W
Load current (A) at 700 W
Load current (A) at 750-1050 W

12
10
8
6

07:12

08:24

09:36

10:48

12:00

13:12

14:24

15:36

16:48

18:00

14:24

15:36

16:48

18:00

Time (hr)

Load power (W)

1100
1000
900

Load power (W) at 350 W
Load power (W) at 700 W
Load power (W) at 750-1050 W

800
700
600
500
400
300

07:12

08:24

09:36

10:48

12:00

13:12

Time (hr)
12
December 10, 2013

Performance assessment and experimental investigation of 1.2 kWp PV power plant in different loading conditions

Testing with 350 W

 Average battery charging
current is 1.64 A.
 Average battery
discharging current is 1.90 A

7.2

Battery discharging

4.8
2.4
0.0
13.8

Current (A) Current (A)

Battery charging current is
available for most of the
time.

Battery charging

9.2
4.6
0.0
14.7

PV

9.8
4.9
0.0

Voltage (V)

When average PV current
is 5.46 A

Current (A)

07:12 08:24 09:36 10:48 12:00 13:12 14:24 15:36 16:48 18:00

51.7

Battery

50.6
49.5
48.4
07:12 08:24 09:36 10:48 12:00 13:12 14:24 15:36 16:48 18:00

Time (hr)

13
December 10, 2013

Performance assessment and experimental investigation of 1.2 kWp PV power plant in different loading conditions

Testing with 700 W

 Average battery charging
current is 0.0049 A.
 Average battery
discharging current is 5.99 A

13.8

Battery discharging

9.2
4.6
0.0

Current (A)
Current (A)

Battery charging current is
available for less time.

Voltage (V)

When average PV current
is 8.10 A

Current (A)

07:12 08:24 09:36 10:48 12:00 13:12 14:24 15:36 16:48 18:00

0.6

Battery charging

0.4
0.2
0.0

PV
13.2
8.8
4.4
0.0
51.00

Battery

50.25
49.50
48.75
07:12 08:24 09:36 10:48 12:00 13:12 14:24 15:36 16:48 18:00

Time (hr)

14
December 10, 2013

Performance assessment and experimental investigation of 1.2 kWp PV power plant in different loading conditions

Testing with 750-1050 W
When average PV current is
9.54 A

Current (A)

07:12 08:24 09:36 10:48 12:00 13:12 14:24 15:36 16:48 18:00
21.3

Battery discharging

14.2
7.1

 Average battery discharging
current is 10.98 A

3

Battery charging

2
1
0
17.7

PV

11.8
5.9
0.0
49.28

Voltage (V)

 Mean battery charging
current 0.043 A.

Current (A) Current (A)

0.0

Battery

48.40
47.52
46.64
07:12 08:24 09:36 10:48 12:00 13:12 14:24 15:36 16:48 18:00

Time (hr)

15
December 10, 2013

Performance assessment and experimental investigation of 1.2 kWp PV power plant in different loading conditions

Optimal load current
 Predicted optimal load
current varies between 8.82 A
and 8.93 A.

Average value of predicted
and experimental optimal load
current is 8.60 A and 8.54 A
respectively

Experimental
Predicted
8.8

Load current (A)

Experimental optimal load
current varies between 8.13 A
and 8.40 A.

9.0

8.6

8.4

8.2

8.0
0

10

20

30

40

50

60

Time (min)

70

80

90

100
16
December 10, 2013

Performance assessment and experimental investigation of 1.2 kWp PV power plant in different loading conditions

Optimal load power

 Corresponding minimum
values are 428.85 W and
434.76 W respectively.

490

Experimental
Predicted

480

Load power (W)

 Maximum predicted and
experimented load power are
476.66 W and 487.37 W
respectively

470
460
450
440

Predicted and experimental
mean values of load powers are
453.87 W (37.82 %) and
455.17 W (37.93 %)

430
0

10

20

30

40

50

60

70

80

90

100

Time (min)
17
December 10, 2013

Performance assessment and experimental investigation of 1.2 kWp PV power plant in different loading conditions

Battery charging current in optimal loading
condition

Experimental battery
charging current ranges from 0
A to 13.26 A with mean value
of 4.12 A

14

Battery charging current (A)

 Predicted battery charging
current varies from 0.03 A to
13.79 A with mean value of
4.13 A

Experiment
Predicted

12
10
8
6
4
2
0
0

10

20

30

40

50

60

70

80

90

100

Time (min)
18
December 10, 2013

Performance assessment and experimental investigation of 1.2 kWp PV power plant in different loading conditions

Battery discharging current in optimal loading
condition

Experimental battery
discharging current ranges from
0 A to 4.90 A with average value
of 4.12 A

Experimental
Predicted

5
Battery discharging current (A)

 Predicted battery discharging
current varies from -1.54 A to
4.50 A with average value of
0.42 A

4
3
2
1
0
-1
-2
0

10

20

30

40

50

60

70

80

90

100

Time (min)
19
December 10, 2013

Performance assessment and experimental investigation of 1.2 kWp PV power plant in different loading conditions

Conclusion
A very good agreement is found between ANN based predication
and experimental investigation under optimal loading conditions.
The PV system sustains about 38 % loading and with mean load
current of 8.54 A. Beyond this loading will increase the battery
discharging current.
From simulation results under optimal loading condition, the
battery maximum and minimum SOC are obtained as 80 % and
79.87 % respectively with a mean value of 79.93 %.
The maximum and minimum battery voltages are found to 48.47
V and 47.54 respectively with average value of 47.84 V.
20
December 10, 2013

Performance assessment and experimental investigation of 1.2 kWp PV power plant in different loading conditions

References
Chen, N., Zhang, X., Bai, Y. and Zhang, H. (2012) Environmental friendly PV power
plant, International Conference on Future Energy, Environment, and Materials, 16, pp.32-37.
Linden, D. (2002) Handbook of batteries and fuel cells, Mcgraw-Hill, New York.
Mahmoud, M.M. (1989) Individual Applications of Photovoltaic Power Systems, Royal Scientific
Society Amman, Jordan.

Zahedi, A. (1998) Development of an electrical model for a PV/battery system for performance
prediction, Renewable Energy, 15(1998), pp. 531-534.
Posadillo, R. and Lopez Luque, R. (2007) A sizing method for stand-alone PV installations with
variable demand, Renewable Energy, 33(2008), pp. 1049-1055.

IEEE 1361TM-2003 IEEE Guide for Selection, Charging, Test and Evaluation of Lead-Acid
Batteries Used in Stand-Alone Photovoltaic (PV) Systems.
Hara, R., Kita, H., Tanabe, T., Sugihara, H., Kuwayama, A. and Miwa, S. (2009) Testing the
technologies, IEEE Power Energy Magazine, 7(3), pp. 77-85.
21
December 10, 2013

Performance assessment and experimental investigation of 1.2 kWp PV power plant in different loading conditions

References continued…
Yoshimoto, K., Nanahara, T. and Koshimizu, G. (2006) New control method for regulating
state-of-charge of a battery in hybrid wind power/battery energy storage system, Proceedings IEEE
PES Power Systems conference and Exposition, pp. 1244-1251.
https://eosweb.larc.nasa.gov/sse/
Mahmoud, M.M. (1989) Individual Applications of Photovoltaic Power Systems, Royal Scientific
Society Amman, Jordan.
Kalogirou, S.A. (2000) Artificial neural networks in renewable energy systems applications: a
review, Renewable and Sustainable Energy Reviews, 5, pp. 373-401.
Balzani, M. and Reatti, A. (2005) Neural Network Based Model of a PV Array for the Optimum
Performance of PV System , Proceedings PhD Research in Microelectronics and Electronics
Conference, 2, pp. 123-126.
Sulaiman, S.I., Abdul Rahman, T.K. and Musirin, I. (2008) ANN-based Technique with Embedded
Data Filtering Capability for Predicting Total AC Power from Grid-connected Photovoltaic
System, 2nd International Power Engineering and Optimization Conference (PEOCO2008), pp.
272-277
22
December 10, 2013

Performance assessment and experimental investigation of 1.2 kWp PV power plant in different loading conditions

References continued…
Sulaiman, S.I., Musirin, I. and Abdul Rahman, T.K. (2008) Prediction of Total AC Power Output
from a Grid-Photovoltaic System Using Multi-Model ANN, 7th WSEAS International Conference on
Application of Electrical Engineering (AEE08), pp. 118-123..

23
December 10, 2013

Performance assessment and experimental investigation of 1.2 kWp PV power plant in different loading conditions

24

101 shantanu

  • 1.
    December 10, 2013 Performanceassessment and experimental investigation of 1.2 kWp PV power plant in different loading conditions Subhadeep Bhattacharjee, Shubhashish Bhakta, Shantanu Acharya Department of Electrical Engineering National Institute of Technology (NIT), Agartala, India E-mail: subhadeep_bhattacharjee@yahoo.co.in IVth International Conference on Advances in Energy Research (ICAER 2013), IIT Bombay 1
  • 2.
    December 10, 2013 Performanceassessment and experimental investigation of 1.2 kWp PV power plant in different loading conditions Introduction  Solar energy is an inexhaustible source of green energy.  Solar radiation received by earth is 0.8 million kW  0.1 % of the received radiation with 5 % conversion rate would generate 40 times electrical energy consumed by current world 2
  • 3.
    December 10, 2013 Performanceassessment and experimental investigation of 1.2 kWp PV power plant in different loading conditions Different solar energy technologies • Photovoltaic (PV) system • Concentrating solar power (CSP) • Transpired solar collector or “Solar walls” • Solar water heater systems 3
  • 4.
    December 10, 2013 Performanceassessment and experimental investigation of 1.2 kWp PV power plant in different loading conditions Why PV system is popular than other solar technology?  Requires less space than other solar technologies for same amount of power generation  Direct conversion of solar energy into electrical energy  Cost per watt of this technology is less. 4
  • 5.
    December 10, 2013 Performanceassessment and experimental investigation of 1.2 kWp PV power plant in different loading conditions Typical Stand-alone PV plant 5
  • 6.
    December 10, 2013 Performanceassessment and experimental investigation of 1.2 kWp PV power plant in different loading conditions Experimental PV power plant of 1.2 kWp Components PV current, PV power PV array  1.2 kWp PV array  Battery bank PCU with 48 V bus  Inverter Load Load current, Load power Inverter Battery charging current Battery bank  Load  Computer for monitoring Battery discharging current Block diagram of the PV plant 6
  • 7.
    December 10, 2013 Performanceassessment and experimental investigation of 1.2 kWp PV power plant in different loading conditions Specification of the system Parameter PV panel area Peak power Open circuit voltage Short circuit current Peak power voltage Peak power current Battery type Number of batteries E.M.F. of each battery Current of each battery NOCT Specification : 8 m2 : 195 Wp : 45.5 V : 5.5A : 37.5 V : 5.20 A : Lead-acid : 24 :2V : 400 Ah : 47 C 1.2 kWp PV Plant Battery bank 7
  • 8.
    December 10, 2013 Performanceassessment and experimental investigation of 1.2 kWp PV power plant in different loading conditions Simulink model of the system 8
  • 9.
    December 10, 2013 Performanceassessment and experimental investigation of 1.2 kWp PV power plant in different loading conditions ANN model of the system  Based on Levenberg-Marquardt algorithm Battery charging current PV current Battery discharging current PV power Load power Battery voltage Load current Input layer Hidden layer Output layer 9
  • 10.
    December 10, 2013 Performanceassessment and experimental investigation of 1.2 kWp PV power plant in different loading conditions Battery SOC at different loading  SOC declines at rate of 0.08 % for every 10 % loading 80.01 79.97 Battery SOC (%) 79.94 79.90 79.87 79.83 79.80 79.76 79.73 % loading 10 60 79.69 79.66 06 07 08 20 70 09 30 80 10 12 40 90 13 50 100 14 15 16 18 19 Time (hr) 10
  • 11.
    December 10, 2013 Performanceassessment and experimental investigation of 1.2 kWp PV power plant in different loading conditions Battery voltage profile at different loading 48.4 48.0 Battery voltage (V)  Battery voltage is reduced from 48.58 to 48.41 V for 10% loading, 48.43 to 48.10 V for 20%, 48.29 to 47.79 V for 30%, 48.14 to 47.47 V for 40%, 48.00 to 47.16 V for 50% 47.6 47.2 46.8 46.4 46.0 Loading percentage (%) 10 20 30 60 70 80 45.6 45.2 06 07 08 09 10 12 40 90 13 50 100 14 15 16 18 19 Time (hr) 11
  • 12.
    December 10, 2013 Performanceassessment and experimental investigation of 1.2 kWp PV power plant in different loading conditions Load current and load power Load current (A) 22 20 18 16 14 Load current (A) at 350 W Load current (A) at 700 W Load current (A) at 750-1050 W 12 10 8 6 07:12 08:24 09:36 10:48 12:00 13:12 14:24 15:36 16:48 18:00 14:24 15:36 16:48 18:00 Time (hr) Load power (W) 1100 1000 900 Load power (W) at 350 W Load power (W) at 700 W Load power (W) at 750-1050 W 800 700 600 500 400 300 07:12 08:24 09:36 10:48 12:00 13:12 Time (hr) 12
  • 13.
    December 10, 2013 Performanceassessment and experimental investigation of 1.2 kWp PV power plant in different loading conditions Testing with 350 W  Average battery charging current is 1.64 A.  Average battery discharging current is 1.90 A 7.2 Battery discharging 4.8 2.4 0.0 13.8 Current (A) Current (A) Battery charging current is available for most of the time. Battery charging 9.2 4.6 0.0 14.7 PV 9.8 4.9 0.0 Voltage (V) When average PV current is 5.46 A Current (A) 07:12 08:24 09:36 10:48 12:00 13:12 14:24 15:36 16:48 18:00 51.7 Battery 50.6 49.5 48.4 07:12 08:24 09:36 10:48 12:00 13:12 14:24 15:36 16:48 18:00 Time (hr) 13
  • 14.
    December 10, 2013 Performanceassessment and experimental investigation of 1.2 kWp PV power plant in different loading conditions Testing with 700 W  Average battery charging current is 0.0049 A.  Average battery discharging current is 5.99 A 13.8 Battery discharging 9.2 4.6 0.0 Current (A) Current (A) Battery charging current is available for less time. Voltage (V) When average PV current is 8.10 A Current (A) 07:12 08:24 09:36 10:48 12:00 13:12 14:24 15:36 16:48 18:00 0.6 Battery charging 0.4 0.2 0.0 PV 13.2 8.8 4.4 0.0 51.00 Battery 50.25 49.50 48.75 07:12 08:24 09:36 10:48 12:00 13:12 14:24 15:36 16:48 18:00 Time (hr) 14
  • 15.
    December 10, 2013 Performanceassessment and experimental investigation of 1.2 kWp PV power plant in different loading conditions Testing with 750-1050 W When average PV current is 9.54 A Current (A) 07:12 08:24 09:36 10:48 12:00 13:12 14:24 15:36 16:48 18:00 21.3 Battery discharging 14.2 7.1  Average battery discharging current is 10.98 A 3 Battery charging 2 1 0 17.7 PV 11.8 5.9 0.0 49.28 Voltage (V)  Mean battery charging current 0.043 A. Current (A) Current (A) 0.0 Battery 48.40 47.52 46.64 07:12 08:24 09:36 10:48 12:00 13:12 14:24 15:36 16:48 18:00 Time (hr) 15
  • 16.
    December 10, 2013 Performanceassessment and experimental investigation of 1.2 kWp PV power plant in different loading conditions Optimal load current  Predicted optimal load current varies between 8.82 A and 8.93 A. Average value of predicted and experimental optimal load current is 8.60 A and 8.54 A respectively Experimental Predicted 8.8 Load current (A) Experimental optimal load current varies between 8.13 A and 8.40 A. 9.0 8.6 8.4 8.2 8.0 0 10 20 30 40 50 60 Time (min) 70 80 90 100 16
  • 17.
    December 10, 2013 Performanceassessment and experimental investigation of 1.2 kWp PV power plant in different loading conditions Optimal load power  Corresponding minimum values are 428.85 W and 434.76 W respectively. 490 Experimental Predicted 480 Load power (W)  Maximum predicted and experimented load power are 476.66 W and 487.37 W respectively 470 460 450 440 Predicted and experimental mean values of load powers are 453.87 W (37.82 %) and 455.17 W (37.93 %) 430 0 10 20 30 40 50 60 70 80 90 100 Time (min) 17
  • 18.
    December 10, 2013 Performanceassessment and experimental investigation of 1.2 kWp PV power plant in different loading conditions Battery charging current in optimal loading condition Experimental battery charging current ranges from 0 A to 13.26 A with mean value of 4.12 A 14 Battery charging current (A)  Predicted battery charging current varies from 0.03 A to 13.79 A with mean value of 4.13 A Experiment Predicted 12 10 8 6 4 2 0 0 10 20 30 40 50 60 70 80 90 100 Time (min) 18
  • 19.
    December 10, 2013 Performanceassessment and experimental investigation of 1.2 kWp PV power plant in different loading conditions Battery discharging current in optimal loading condition Experimental battery discharging current ranges from 0 A to 4.90 A with average value of 4.12 A Experimental Predicted 5 Battery discharging current (A)  Predicted battery discharging current varies from -1.54 A to 4.50 A with average value of 0.42 A 4 3 2 1 0 -1 -2 0 10 20 30 40 50 60 70 80 90 100 Time (min) 19
  • 20.
    December 10, 2013 Performanceassessment and experimental investigation of 1.2 kWp PV power plant in different loading conditions Conclusion A very good agreement is found between ANN based predication and experimental investigation under optimal loading conditions. The PV system sustains about 38 % loading and with mean load current of 8.54 A. Beyond this loading will increase the battery discharging current. From simulation results under optimal loading condition, the battery maximum and minimum SOC are obtained as 80 % and 79.87 % respectively with a mean value of 79.93 %. The maximum and minimum battery voltages are found to 48.47 V and 47.54 respectively with average value of 47.84 V. 20
  • 21.
    December 10, 2013 Performanceassessment and experimental investigation of 1.2 kWp PV power plant in different loading conditions References Chen, N., Zhang, X., Bai, Y. and Zhang, H. (2012) Environmental friendly PV power plant, International Conference on Future Energy, Environment, and Materials, 16, pp.32-37. Linden, D. (2002) Handbook of batteries and fuel cells, Mcgraw-Hill, New York. Mahmoud, M.M. (1989) Individual Applications of Photovoltaic Power Systems, Royal Scientific Society Amman, Jordan. Zahedi, A. (1998) Development of an electrical model for a PV/battery system for performance prediction, Renewable Energy, 15(1998), pp. 531-534. Posadillo, R. and Lopez Luque, R. (2007) A sizing method for stand-alone PV installations with variable demand, Renewable Energy, 33(2008), pp. 1049-1055. IEEE 1361TM-2003 IEEE Guide for Selection, Charging, Test and Evaluation of Lead-Acid Batteries Used in Stand-Alone Photovoltaic (PV) Systems. Hara, R., Kita, H., Tanabe, T., Sugihara, H., Kuwayama, A. and Miwa, S. (2009) Testing the technologies, IEEE Power Energy Magazine, 7(3), pp. 77-85. 21
  • 22.
    December 10, 2013 Performanceassessment and experimental investigation of 1.2 kWp PV power plant in different loading conditions References continued… Yoshimoto, K., Nanahara, T. and Koshimizu, G. (2006) New control method for regulating state-of-charge of a battery in hybrid wind power/battery energy storage system, Proceedings IEEE PES Power Systems conference and Exposition, pp. 1244-1251. https://eosweb.larc.nasa.gov/sse/ Mahmoud, M.M. (1989) Individual Applications of Photovoltaic Power Systems, Royal Scientific Society Amman, Jordan. Kalogirou, S.A. (2000) Artificial neural networks in renewable energy systems applications: a review, Renewable and Sustainable Energy Reviews, 5, pp. 373-401. Balzani, M. and Reatti, A. (2005) Neural Network Based Model of a PV Array for the Optimum Performance of PV System , Proceedings PhD Research in Microelectronics and Electronics Conference, 2, pp. 123-126. Sulaiman, S.I., Abdul Rahman, T.K. and Musirin, I. (2008) ANN-based Technique with Embedded Data Filtering Capability for Predicting Total AC Power from Grid-connected Photovoltaic System, 2nd International Power Engineering and Optimization Conference (PEOCO2008), pp. 272-277 22
  • 23.
    December 10, 2013 Performanceassessment and experimental investigation of 1.2 kWp PV power plant in different loading conditions References continued… Sulaiman, S.I., Musirin, I. and Abdul Rahman, T.K. (2008) Prediction of Total AC Power Output from a Grid-Photovoltaic System Using Multi-Model ANN, 7th WSEAS International Conference on Application of Electrical Engineering (AEE08), pp. 118-123.. 23
  • 24.
    December 10, 2013 Performanceassessment and experimental investigation of 1.2 kWp PV power plant in different loading conditions 24