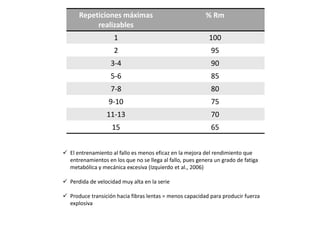
1. Training to failure is less effective for improving performance than training that does not reach failure, as it produces excessive metabolic and mechanical fatigue.
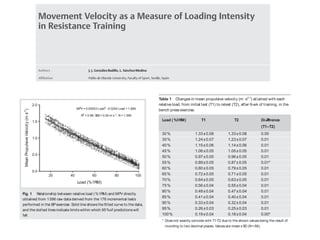
2. Reaching failure results in a very high loss of speed in the series and a transition to slower fiber types, reducing explosive force production capacity.
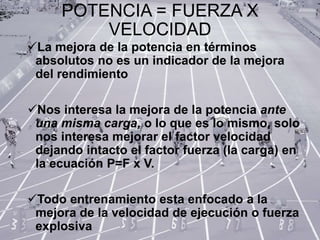
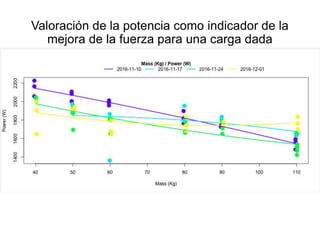
3. When assessing power, the goal is to improve velocity at a given load to increase power, not just improve absolute power, which is not a direct indicator of performance improvement. All training is focused on improving execution speed or explosive strength.