Download to read offline

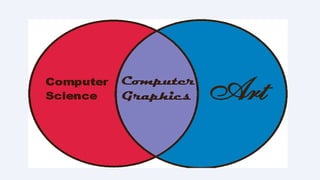
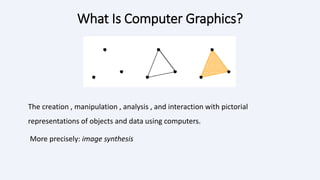
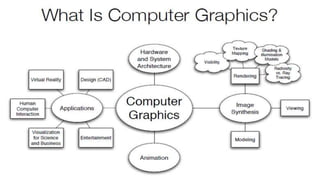

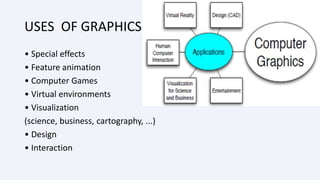

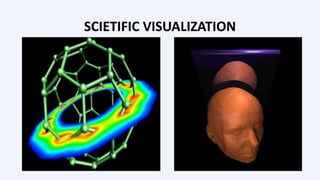


This document discusses computer graphics. It defines computer graphics as the creation, manipulation, analysis and interaction with pictorial representations using computers. Some key points made include: - Computer graphics is used for image synthesis, visualization, design, interaction and more. Around 50% of the brain is associated with vision. - Applications include special effects, animation, games, visualization, design, medical imaging and more. Techniques include modeling, animation and rendering. - Rendering is the generation of 2D images from 3D models using computer programs. It involves geometry, viewpoint, texture, lighting and shading information. Ray tracing and texture mapping are rendering techniques.