Download as PDF, PPTX


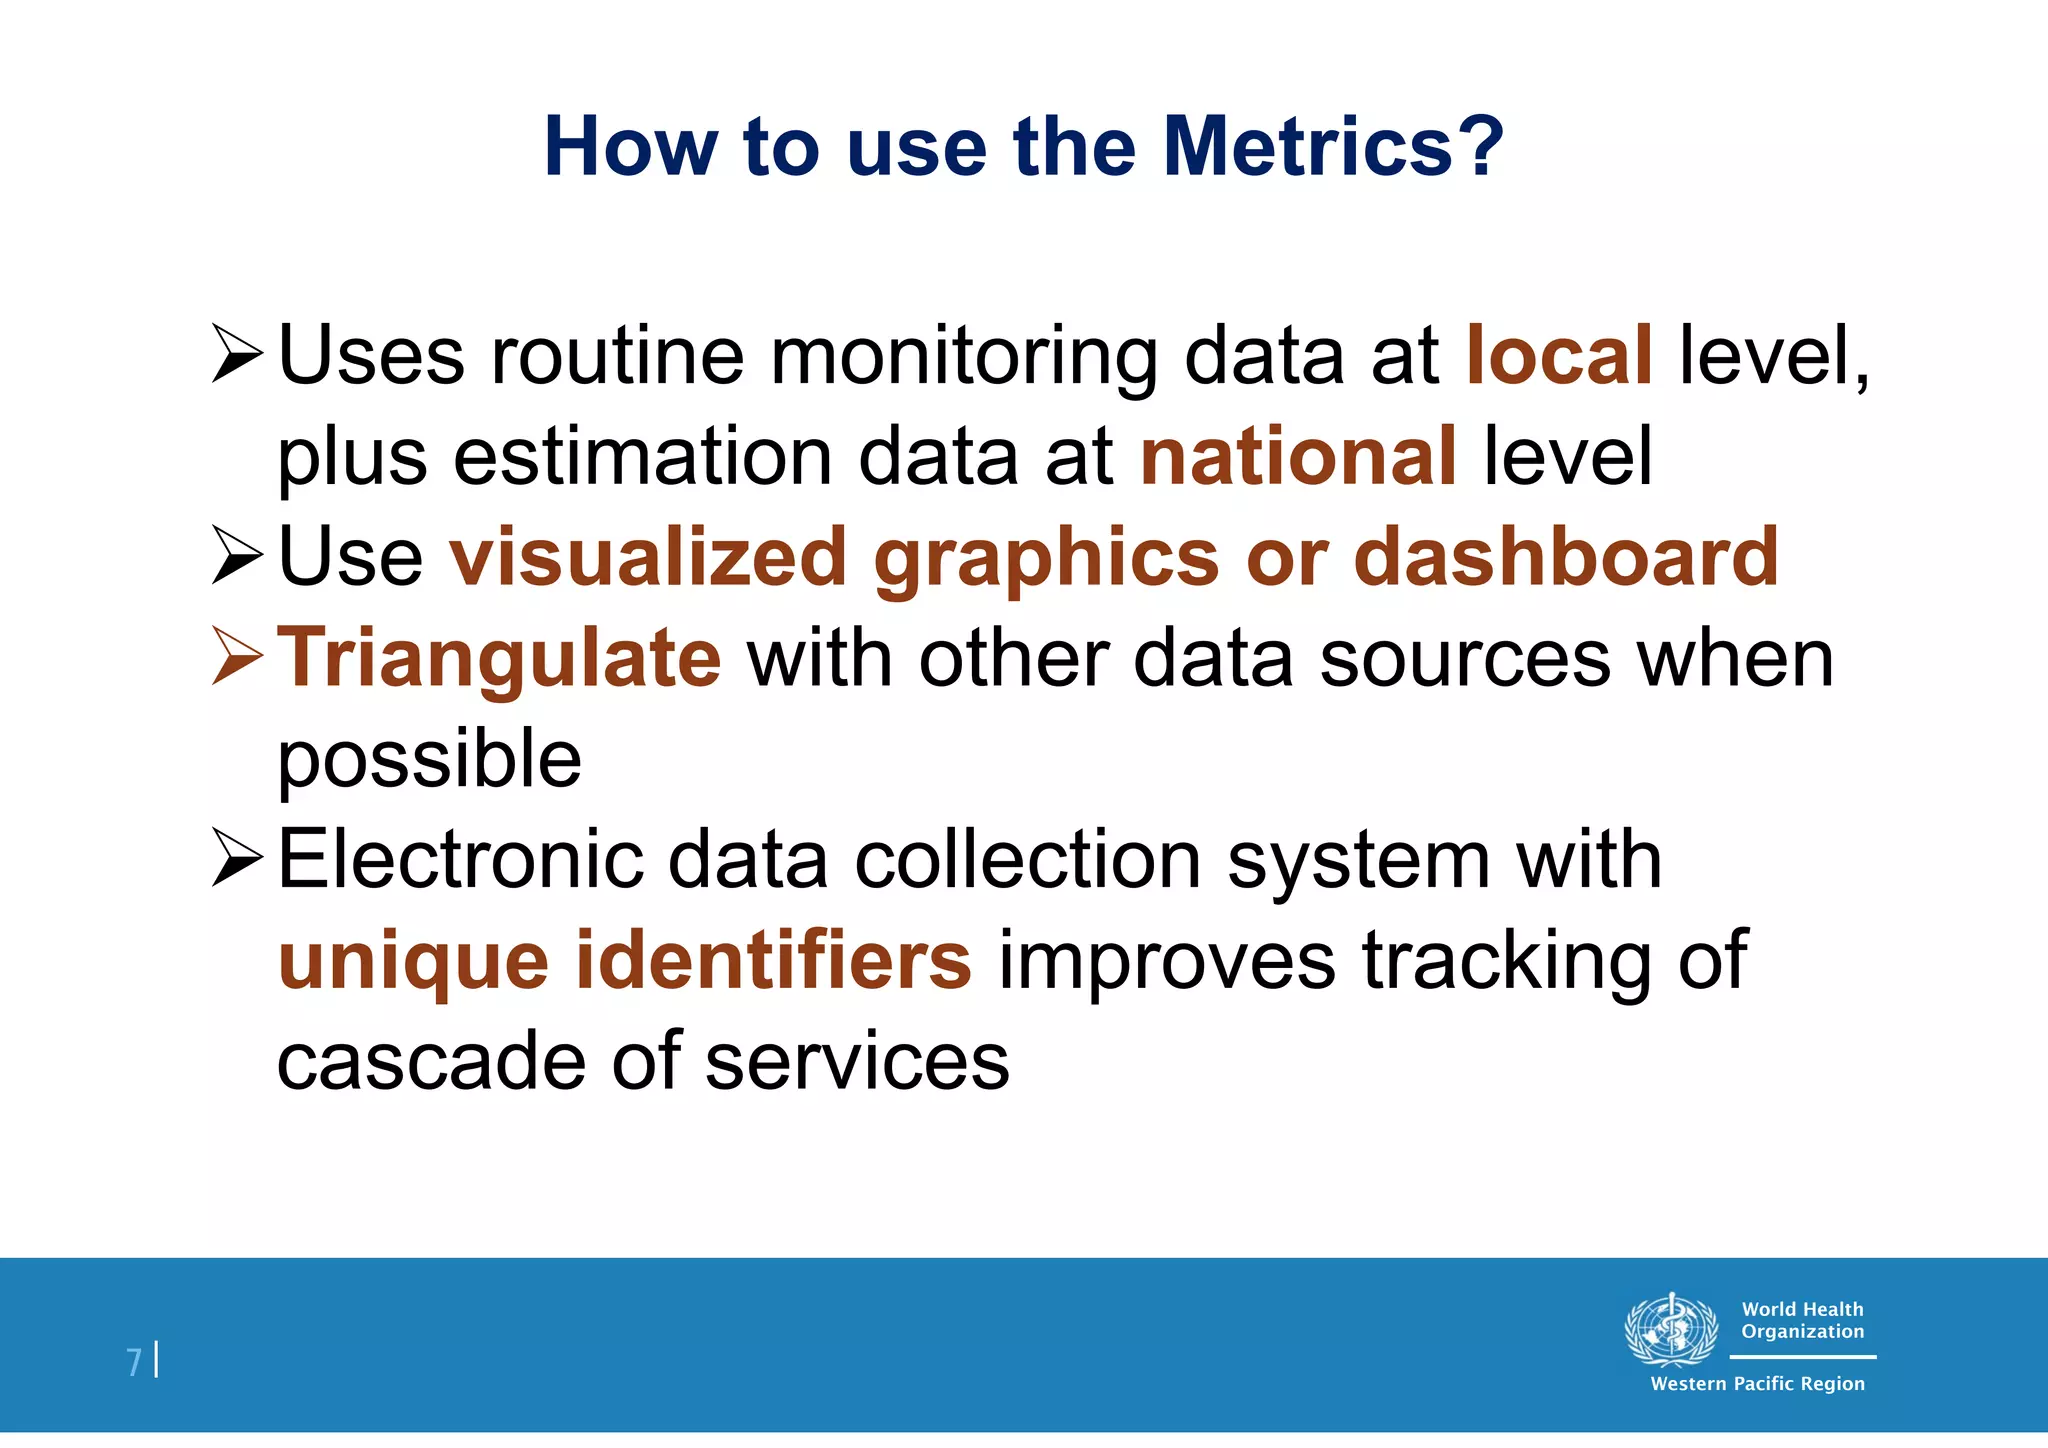

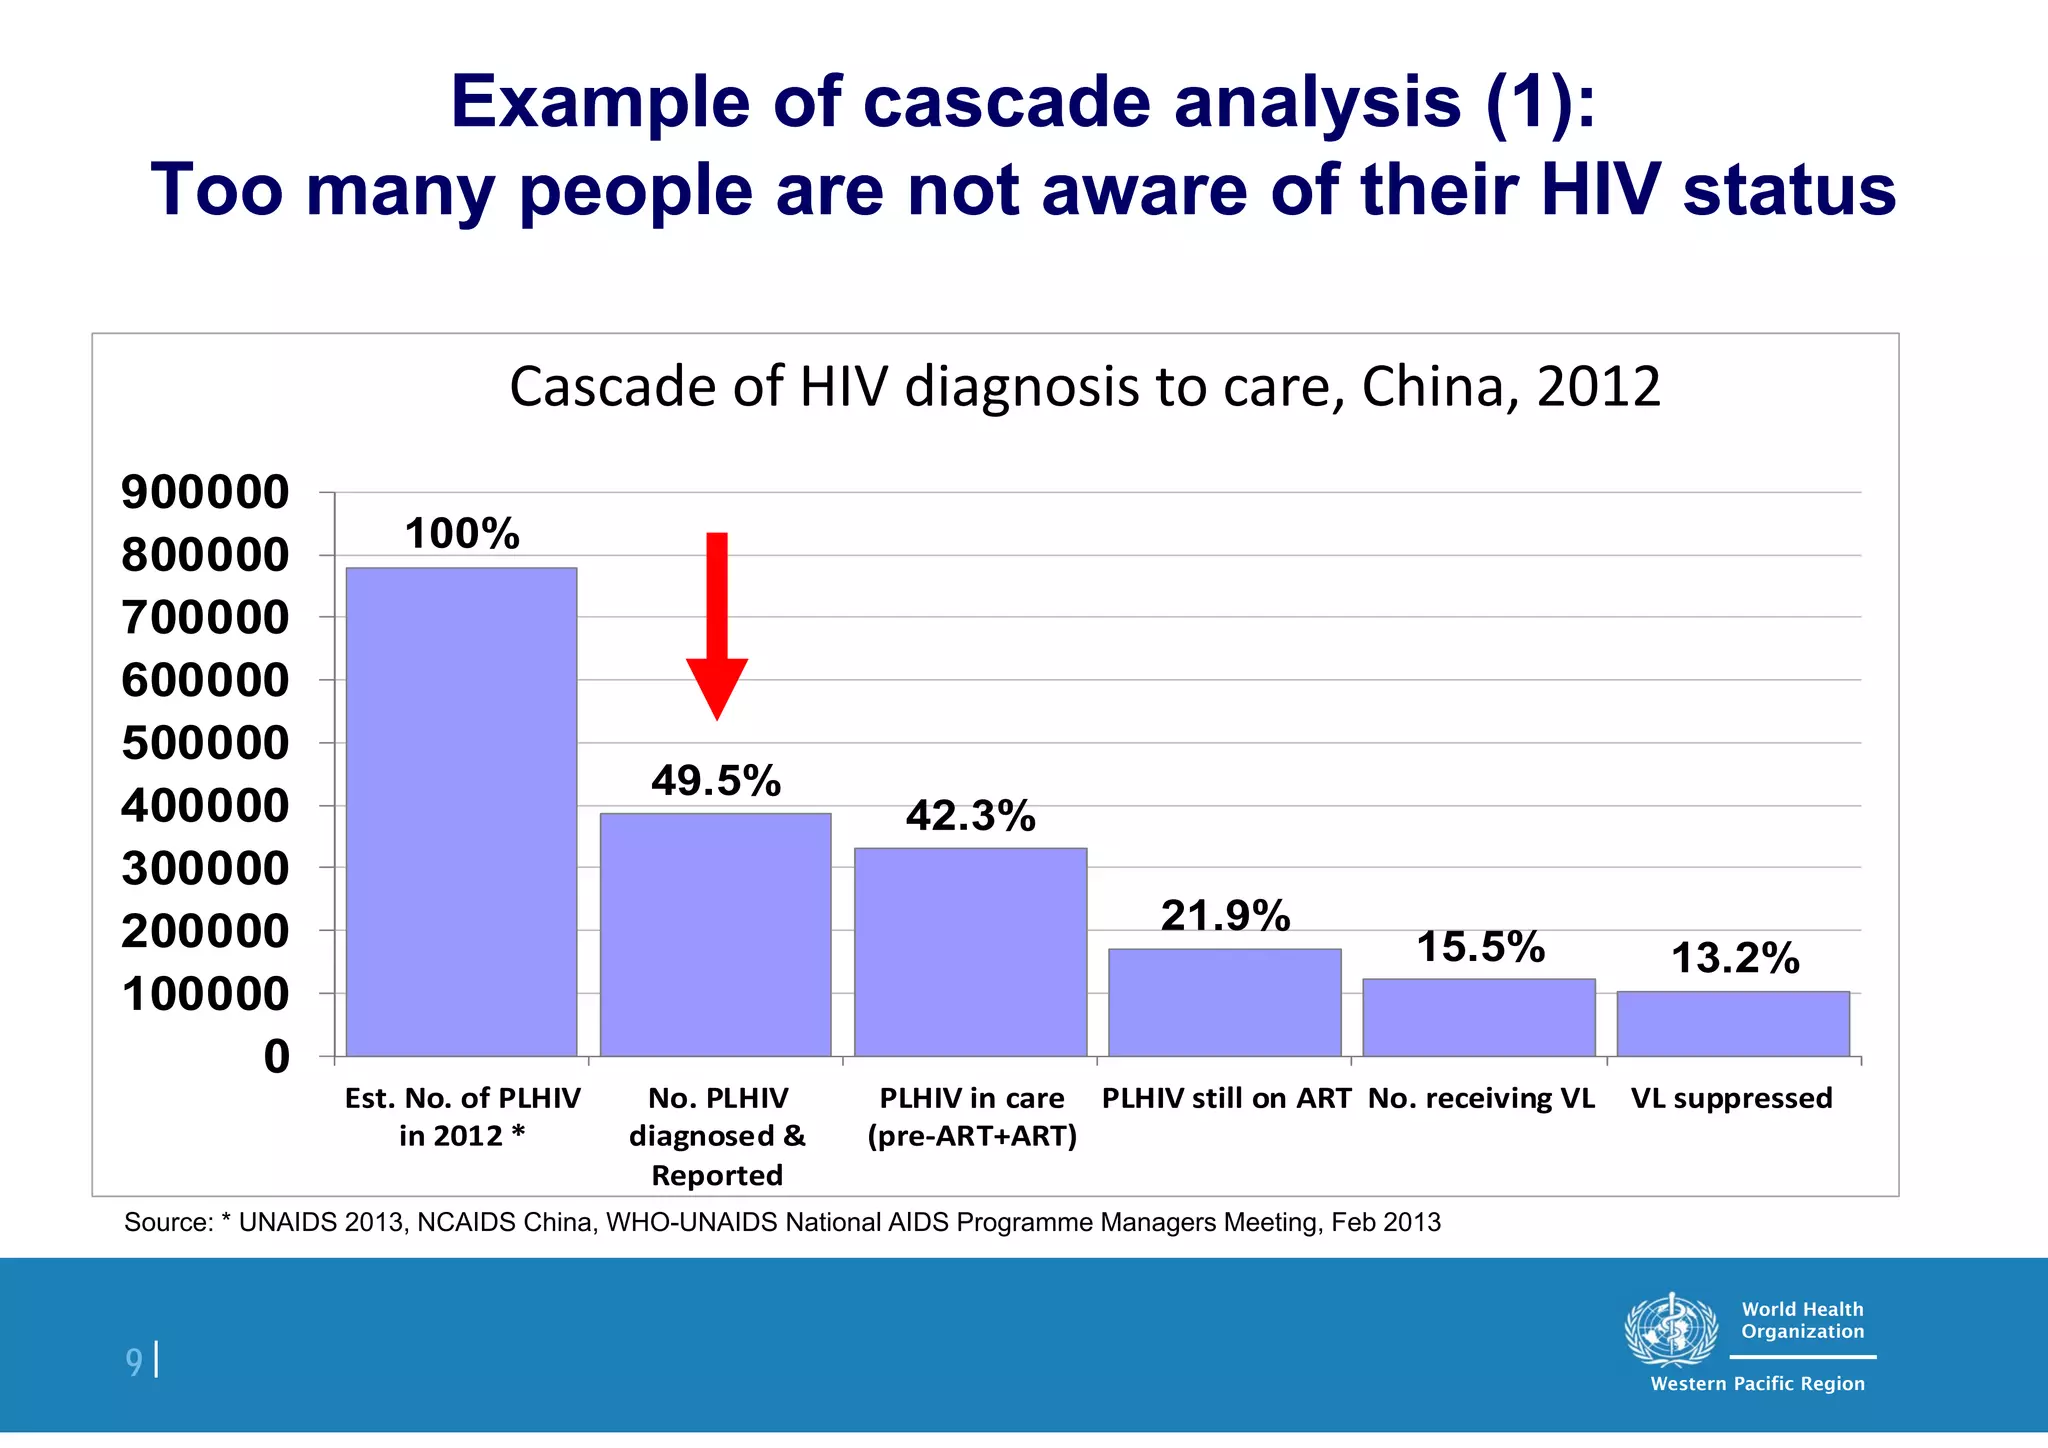


The document discusses metrics for monitoring the cascade of HIV services across the continuum of care. It presents a conceptual framework showing the cascade from diagnosis to viral suppression. Key metrics are identified to measure progress at each stage, including the percentage of people living with HIV who know their status, are linked to care, initiated on antiretroviral therapy, and have achieved viral suppression. The metrics were field tested in two countries and found useful for program assessment. Challenges include data quality and capacity at the local level. Guidelines will be published in early 2014 to help countries use these metrics to identify gaps and improve program performance.


![M & e training [autosaved]](https://cdn.slidesharecdn.com/ss_thumbnails/metrainingautosaved-130520213341-phpapp01-thumbnail.jpg?width=640&height=640&fit=bounds)


