Download to read offline
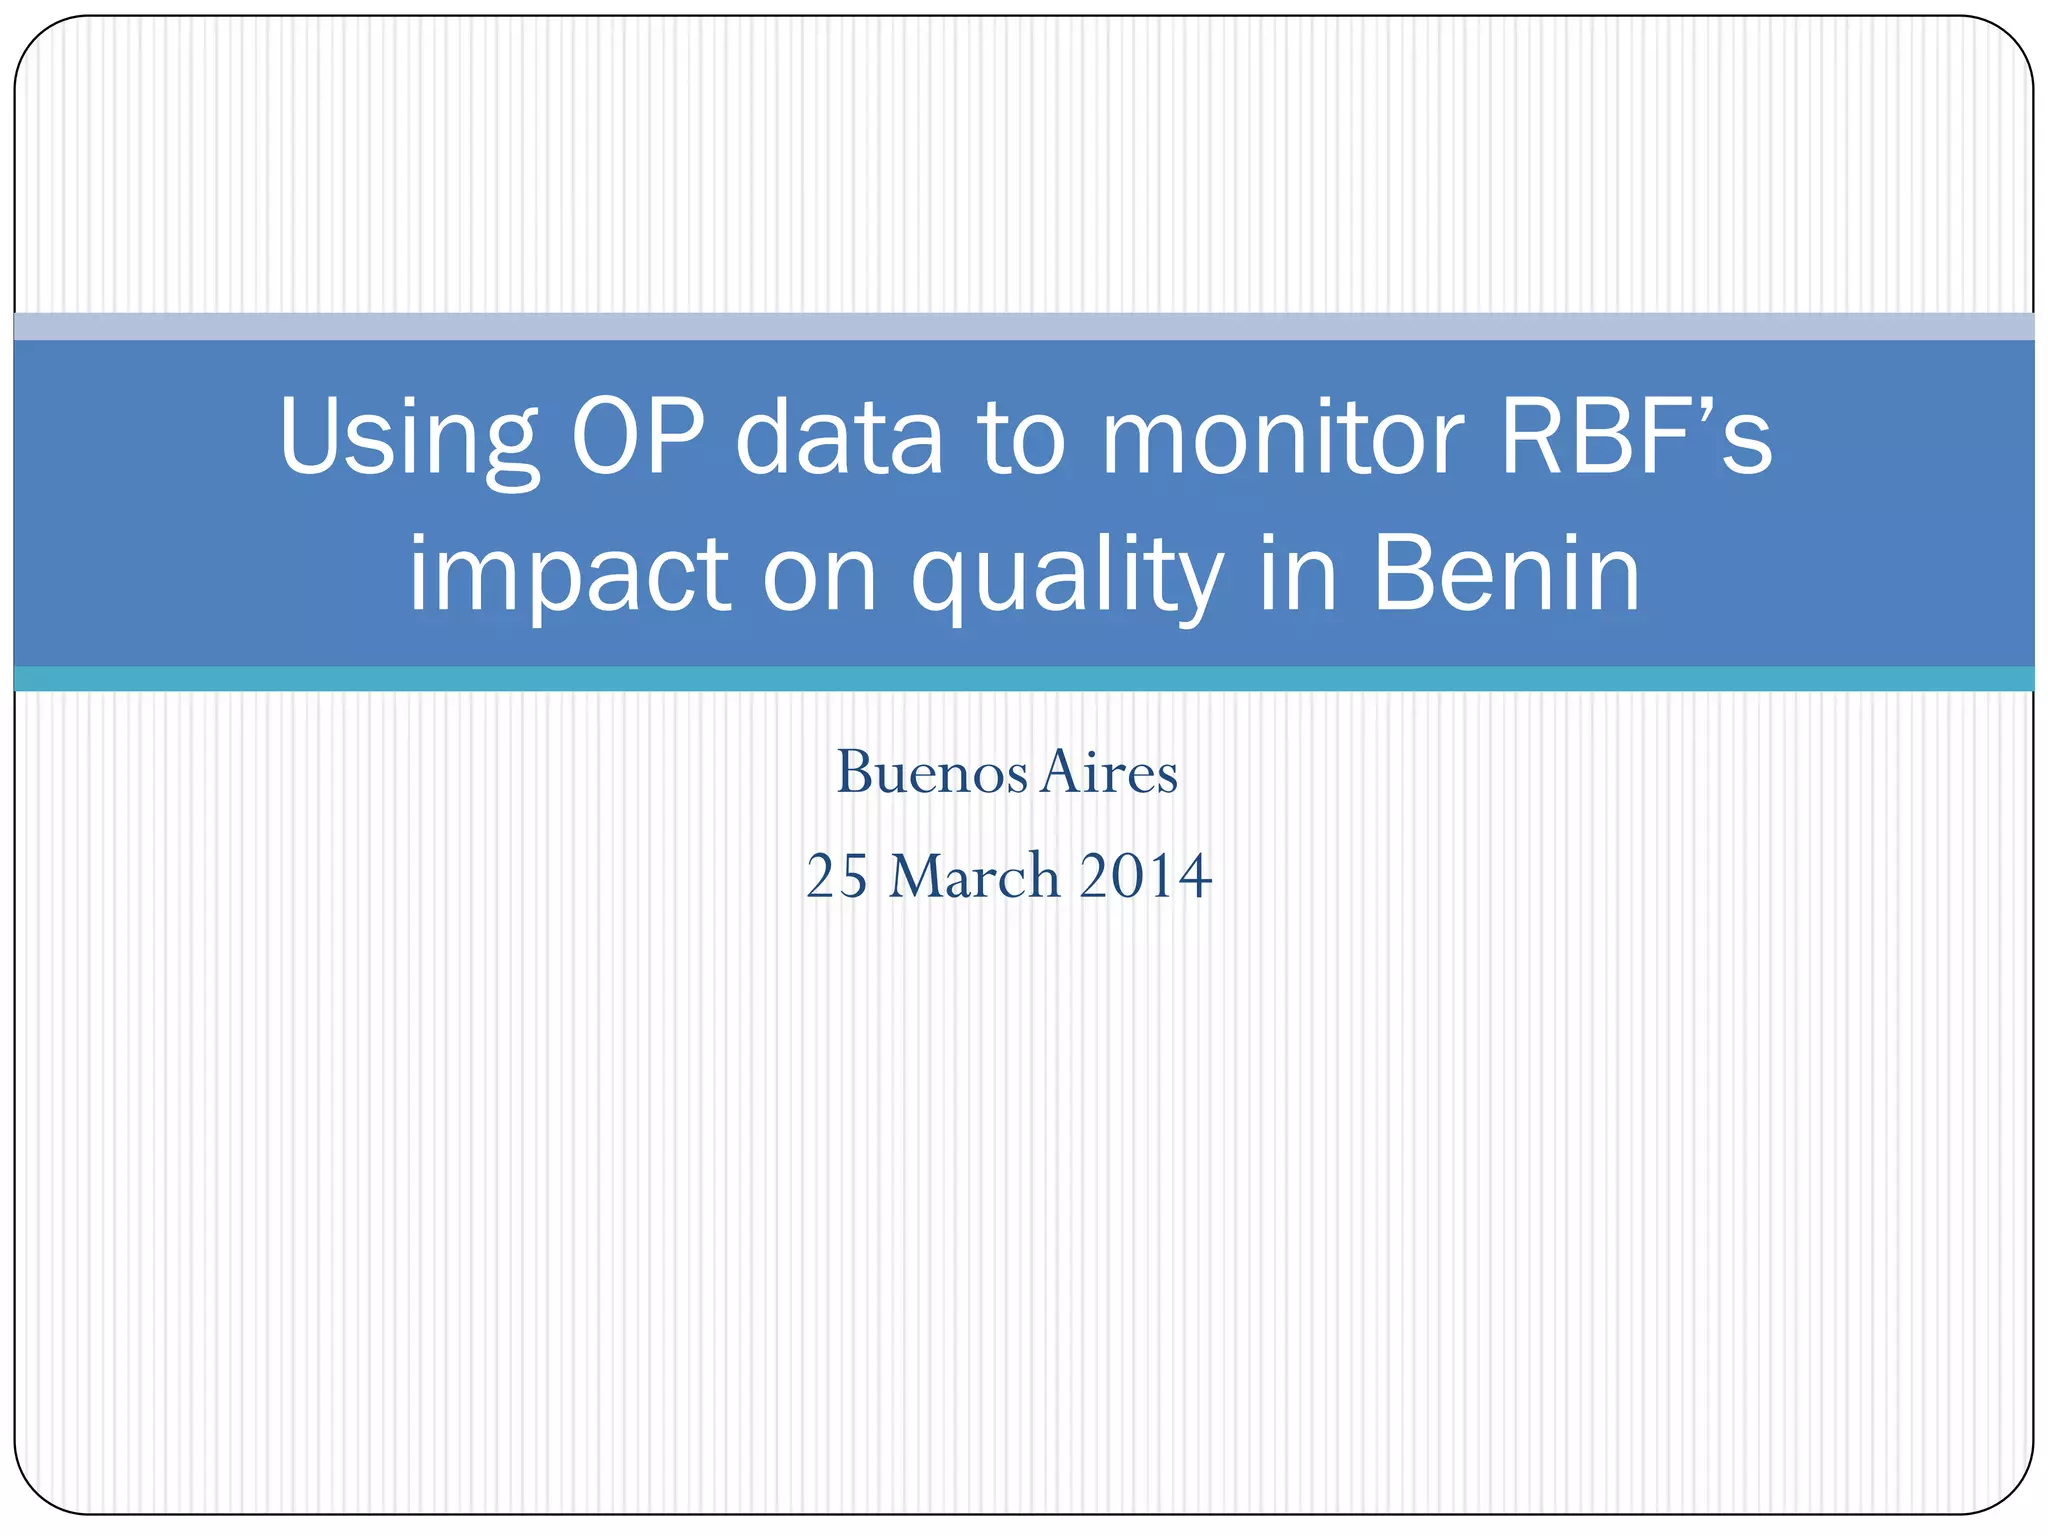

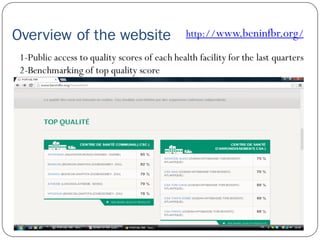
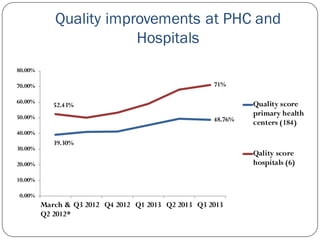
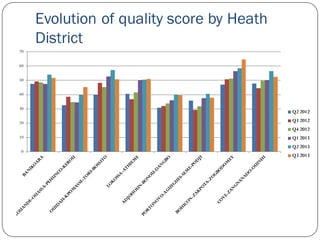
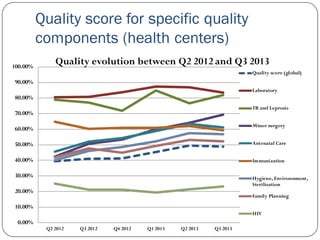
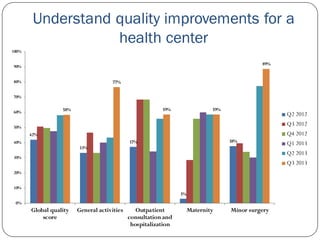

The document discusses the monitoring of the impact of results-based financing (RBF) on healthcare quality in Benin, using a comprehensive quality checklist that includes a variety of health activities. It presents quality score improvements over time for primary health centers and hospitals, highlighting specific areas and components of healthcare quality. The next steps involve developing a dedicated RBF website to further track and improve maternal health care quality indicators.


