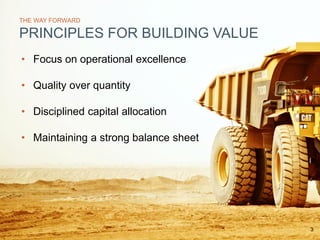
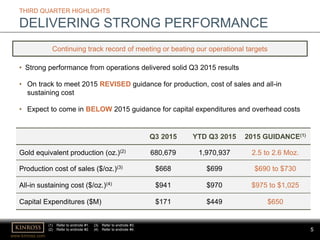
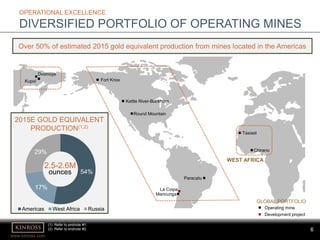
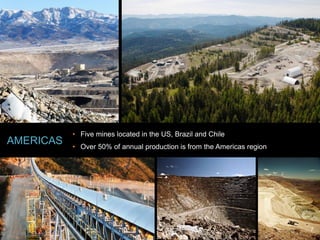
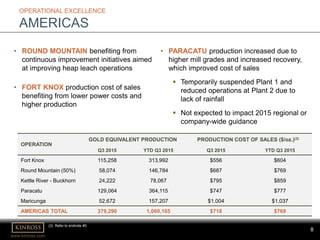
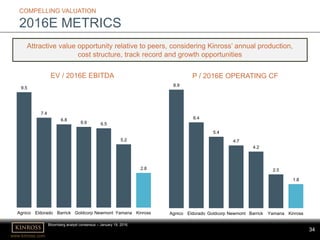
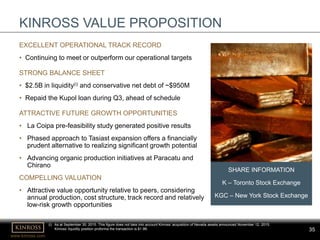
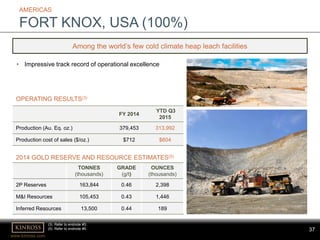
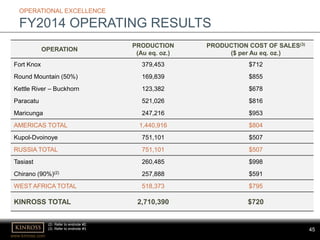
This document summarizes Kinross Gold Corporation's presentation at the CIBC Whistler Institutional Investor Conference in January 2016. Key points include: Kinross is focused on operational excellence, quality over quantity, disciplined capital allocation, and maintaining a strong balance sheet. For 2015, Kinross expects gold equivalent production of 2.5-2.6 million ounces at a production cost of sales of $690-730 per ounce and all-in sustaining costs of $975-1,025 per ounce, and capital expenditures of $650 million. Over 50% of Kinross' estimated 2015 production is from mines in the Americas.
Kinross Gold Corporation presented at the BMO Capital Markets Global Metals & Mining Conference on February 28 - March 2, 2016. Kinross delivered strong operational performance in 2015, meeting or exceeding production guidance and coming in at the low end of cost guidance. For 2016, Kinross expects gold equivalent production of 2.7-2.9 million ounces at a cost of sales of $675-735 per ounce and all-in sustaining costs of $890-990 per ounce. Kinross has organic growth opportunities from projects such as La Coipa and exploration at Bald Mountain, as well as a diversified portfolio of operating mines globally.
Newmont Mining Corporation reported its full year and Q4 2015 earnings. Key highlights include:
- The company lowered its all-in sustaining costs by 10% to $898/oz for 2015 and continued to deliver its strategy of improving the underlying business and strengthening its portfolio.
- Operationally, the company increased gold production by 4% to 5.0 million ounces in 2015 while lowering injury rates by 18% and reducing costs.
- Financially, the company increased adjusted EBITDA by 29% to $2.7 billion in 2015, more than doubled its free cash flow to $756 million, and lowered its net debt.
- Looking forward, the company aims to deliver safe and profitable
ACQUISITION OF TWO QUALITY MINES IN NEVADAKinrossGold
Kinross has agreed to acquire two gold mines in Nevada from Barrick for $610 million in cash. This includes 100% ownership of the Bald Mountain mine and increasing its ownership in the Round Mountain mine to 50%. The acquisition enhances Kinross' portfolio by adding over 430,000 ounces of average annual gold production through 2018 and increasing reserves and resources. It provides upside potential from exploration at Bald Mountain and operational improvements at Round Mountain. The all-cash transaction maintains Kinross' strong balance sheet while increasing cash flow and lowering costs.
This document provides an overview and schedule for the Unearthing the Future International Convention, Trade Show & Investors Exchange taking place in Toronto, Canada from March 5-8, 2017. It discusses SEMAFO's assets in West Africa including their Mana Mine in Burkina Faso and the construction of their new Natougou Mine, which is scheduled to begin production in the second half of 2018. It also summarizes their exploration and growth strategy, social investment programs, and 2017 operational priorities.
Newmont Mining Corporation reported its Q1 2016 results. Key highlights included:
- Gold production of 1.2 million ounces, up 4% from the prior year quarter.
- AISC of $828 per ounce and 2016 outlook lowered by $20 per ounce.
- Adjusted EBITDA of $803 million on strong operating performance.
- Free cash flow of $227 million while continuing to self-fund profitable growth projects.
This corporate presentation by Alamos Gold provides an overview of the company and its operations. Key points include:
- Alamos is a mid-tier gold producer with diversified production of 400,000-430,000 ounces from three North American mines in 2017.
- Costs are expected to decrease in 2017, with all-in sustaining costs projected to decline 7% to $940 per ounce.
- The company has a pipeline of six development projects that will support long-term growth in a disciplined manner.
- Alamos has a strong balance sheet with $492 million in pro forma cash to fund growth initiatives and debt repayment.
Kinross Gold Corporation has operated successfully in Russia's Far East for over 20 years. It has invested over $3 billion and paid over $2.7 billion in taxes and other payments. Kinross operates the Kupol and Dvoinoye mines, which together produce over 4,500 tonnes of ore per day. Kinross has also had success exploring and developing satellite deposits near its existing mines and has several high potential exploration targets to continue expanding the mine life at Kupol.
This document contains the forward-looking statements of Newmont Mining Corporation's Chief Financial Officer Laurie Brlas at the CIBC 19th Annual Whistler Investor Conference in January 2016. The statements caution that forward-looking estimates are based on assumptions that may prove incorrect, including assumptions about geology, mine plans, permits, metal prices, exchange rates, and costs. Brlas outlines Newmont's strategy to improve operations, strengthen its portfolio, and create shareholder value. Newmont has reduced costs, increased productivity and asset value through projects and divestitures while maintaining a strong balance sheet.
1) Kinross Gold Corporation operates the Kupol and Dvoinoye gold mines in the remote Far East region of Russia. The mines have produced over 5 million ounces of gold and 50 million ounces of silver since 2008, contributing significantly to regional economic development.
2) Kinross' operations have invested over $3 billion and contribute billions of rubles annually in taxes and payments to support social programs, small businesses, healthcare, education, and indigenous traditions in Chukotka. Gold production has increased the region's GDP several fold.
3) Kinross works closely with the Russian government to improve the investment climate for mining and is exploring nearby deposits like Moroshka and September Northeast that could further contribute
Kinross Gold Corporation reported its fourth quarter and full-year 2015 results. Key highlights included meeting or exceeding its revised 2015 guidance by producing 2.6 million ounces of gold equivalent at a cost of sales of $696 per ounce and capital expenditures of $610 million. The company also acquired two producing mines in Nevada, enhancing its American portfolio. For 2016, Kinross expects to produce between 2.7-2.9 million ounces of gold equivalent at a reduced overhead expense of $165 million and capital expenditures of $595 million, excluding potential expansion at Tasiast.
This document is the transcript from Kinross Gold Corporation's Q2 2017 results conference call. Some key points:
- Kinross is on track to meet its 2017 guidance targets for the sixth consecutive year, including producing 2.5-2.7 million ounces of gold at a production cost of sales of $660-720 per ounce and all-in sustaining costs of $925-1,025 per ounce.
- The two-phased expansion at Tasiast is progressing well, with phase one approximately 55% complete and on budget for commercial production in Q2 2018. Kinross will finalize the phase two feasibility study in September.
- Bald Mountain is expected to double its production with reduced
Gary Goldberg, President and CEO of Newmont Mining Corporation, presented at the BMO Metals & Mining Conference on February 27, 2017. The presentation included:
1) Cautionary statements regarding the forward-looking nature of estimates and expectations in the presentation.
2) An overview of Newmont's strategy to deliver long-term shareholder value through steady long-term gold production, ongoing cost discipline and capital investment in profitable growth projects.
3) Details on Newmont's consistently strong operational and financial results in recent years, as well as leading safety and sustainability performance.
Kirkland lake gold investor presentation feb bmo conference finalkirklandlakegoldinc
1. Kirkland Lake Gold is a tier one gold producer with operations in Canada and Australia that is forecasting 2017 gold production of 500,000-525,000 ounces at an operating cash cost of $625-675 per ounce and all-in sustaining costs of $950-1,000 per ounce.
2. As of December 31, 2016, Kirkland Lake Gold had a strong cash position of US$234 million and net cash of US$145 million providing financial flexibility.
3. The company has significant exploration potential across its Canadian and Australian assets and has budgeted US$45-55 million for growth exploration in 2017.
New gold presentation september 2017 v finalnewgold2011
This corporate presentation from September 2017 provides an overview of New Gold Inc., including:
- Cautionary statements regarding forward-looking information in the presentation.
- Key characteristics of New Gold's portfolio including 14.7 million ounces of gold reserves located primarily in Canada, low costs of $671 per ounce, and potential for 800,000 ounces of annual gold production from growth projects.
- Recent management and board appointments and changes, including a new Executive Vice President & CFO and Vice Presidents of Projects and Business Development, and a new board member. The previous CFO will remain until October 2017 to assist with the transition.
Newmont Mining Corporation reported its Q1 2017 earnings. Gold production for Q1 was 1.2 Moz, up 9% year-over-year and the company remains on track to meet its full-year guidance of 4.9-5.4 Moz. All-in sustaining costs for Q1 were $900/oz, below guidance. Newmont also approved expansions at its Ahafo mine in Africa, which will improve profitability and mine life. The expansions include an underground mine and mill expansion.
This document provides a cautionary statement regarding forward-looking statements in an investor presentation by Newmont Mining Corporation. It notes that estimates and expectations in the presentation are based on assumptions that may prove to be incorrect. It also lists potential risks to the forward-looking statements including changes in geotechnical or other conditions, permitting and development issues, political risks, commodity price volatility, and other operational risks. The company does not undertake to publicly revise or update forward-looking statements except as required by law.
Kirkland Lake Gold is a low-cost gold producer with operations in Canada and Australia. In the first half of 2017, the company produced 290,733 ounces of gold at an all-in sustaining cost of $794 per ounce. Kirkland Lake has increased its 2017 production and cost guidance twice already based on strong results from its Macassa and Fosterville mines. The company is focused on growing reserves and resources through exploration while maintaining a strong financial position.
100317 tasiast mine tour presentation finalKinrossGold
The document discusses Kinross Gold Corporation's Tasiast mine in Mauritania. It provides context on the mine's development history and plans for a two-phased expansion to transform it into a large, low-cost producer. The geology of the region is described, including encouraging drill results at the nearby Tasiast Sud area that indicate the potential for additional gold resources. An accelerated drill program and pre-feasibility study are underway to further evaluate the potential of Tasiast Sud.
Corporate presentation january 2017 v finalnewgold2011
This corporate presentation provides cautionary statements regarding forward-looking information in the document. It notes that all dollar amounts are in US dollars unless otherwise stated. It also outlines key assumptions and risk factors that could cause actual results to differ from forward-looking statements. Forward-looking statements include production guidance, resource and reserve estimates, construction timelines and costs for the Rainy River project, and other operating parameters. These statements are based on certain material assumptions regarding the business, including around political and economic conditions, commodity prices, exchange rates, costs, and permitting. However, forward-looking statements are subject to risks and uncertainties that could cause actual results to differ from expectations.
Kinross Gold Corporation reported its third quarter 2017 results. Key highlights included meeting production guidance for the sixth consecutive year and tracking at the high-end of production and low-end of cost forecasts. Strong year-to-date cost performance included production cost of sales $39/oz lower and all-in sustaining costs $40/oz lower than the previous year. Kinross is advancing the Tasiast Phase Two and Round Mountain Phase W projects following positive feasibility studies.
Kinross Gold Corporation completed studies on a two-phased expansion of its Tasiast mine in Mauritania. Phase One involves expanding the processing capacity to 12,000 tonnes per day at an initial capital cost of $300 million, which is expected to increase average annual production to 409,000 ounces, reduce costs per ounce by 50%, and generate an internal rate of return of 20%. Phase Two pre-feasibility studies were also completed. The two-phased approach offers significant growth potential for Tasiast at a lower capital cost than previously estimated. Kinross is proceeding with Phase One of the expansion.
Kinross Gold Corporation held a Q1 2016 results conference call and webcast on May 11, 2016. Key highlights from the call include: Kinross delivered strong performance in Q1 2016 with production increasing and costs decreasing year-over-year. Kinross is on track to meet its 2016 guidance targets. The Tasiast Phase One project is progressing well with engineering 55% complete and major earthworks scheduled to begin in June. Phase One is expected to significantly increase production and reduce costs at Tasiast.
New gold presentation june 2017 v finalnewgold2011
This corporate presentation provides cautionary statements regarding forward-looking information and key characteristics of New Gold's portfolio. It discusses New Gold's assets in top-rated jurisdictions, including operating mines and development projects. New Gold has 14.7 million ounces of gold reserves, over 90% located in Canada. Its first quarter 2017 all-in sustaining costs were $597 per ounce. Growth projects have the potential to increase annual production to approximately 800,000 ounces.
- Newmont Mining Corporation presented at the Goldman Sachs Global Metals & Mining Conference in November 2016
- The presentation outlines Newmont's strategy to improve its underlying business, strengthen its portfolio, and create shareholder value through optimizing costs, organic growth, and portfolio enhancements
- Newmont highlights its track record of reducing costs, extending mine life through reinvestment and divestment, growing production, improving margins, and generating industry-leading returns and free cash flow
1. The document discusses forward-looking information and statements regarding Stornoway Diamond Corporation's Renard Diamond Mine in Quebec. It contains risks and uncertainties that could cause actual results to differ from expectations.
2. Key highlights from 2016 include commercial production beginning January 1st, producing 448,887 carats at 112 carats per hundred tonnes, and completing 3 sales.
3. The underground mine development is in ore at the 160m level and total open pit mining in 2016 was over 7.8 million tonnes, significantly exceeding the plan.
This investor presentation provides an overview of Newmont Mining Corporation and highlights key points:
1) Newmont has improved its underlying business through cost reductions, growing production from new projects, and divesting non-core assets. All-in sustaining costs have decreased 22% since 2012.
2) The company has strengthened its portfolio through investing in projects like Merian and Long Canyon that have longer mine lives and lower costs than divested assets.
3) Newmont has created shareholder value by outperforming peers in free cash flow generation, with $1.2 billion generated since 2012. This has allowed it to self-fund projects and increase dividends.
BMO Capital Markets 25th Global Metals & Mining Conference PresentationKinrossGold
Kinross Gold Corporation presented at the BMO Capital Markets Global Metals & Mining Conference on February 28 - March 2, 2016. Kinross delivered strong operational performance in 2015, meeting or exceeding its revised guidance targets. Kinross expects to produce 2.7-2.9 million ounces of gold equivalent in 2016 at an all-in sustaining cost of $890-990 per ounce and capital expenditures of $595 million. Kinross' diversified portfolio is expected to source over 60% of 2016 production from its Americas mines. Kinross outlined organic growth opportunities from its La Coipa project in Chile and exploration programs at Bald Mountain and across its global portfolio.
Kinross Gold Corporation completed studies on a two-phased expansion of its Tasiast mine in Mauritania. Phase One involves expanding the processing capacity to 12,000 tonnes per day at an initial capital cost of $300 million, which is expected to increase average annual production to 409,000 ounces, reduce costs per ounce by 50%, and generate an after-tax IRR of 20%. Phase Two pre-feasibility studies were also completed. The two-phased approach offers significant growth potential at a lower cost than previously estimated and allows flexibility to potentially proceed with a larger expansion in the future. Kinross is proceeding with Phase One of the expansion.
Kinross Gold Corporation presented at the TD Securities 2016 Mining Conference in January 2016. The presentation focused on Kinross' principles of operational excellence, quality over quantity, disciplined capital allocation, and maintaining a strong balance sheet. It provided updates on Kinross' diversified portfolio of operating mines and organic growth opportunities, including positive pre-feasibility study results for the La Coipa Project and concepts for a phased expansion at Tasiast.
Kinross Gold Corp European Gold Forum PresentationKinrossGold
Kinross Gold Corporation is a gold mining company that produced 2.6 million ounces of gold equivalent in 2015, meeting or exceeding its revised guidance targets. For 2016, Kinross expects production of 2.7-2.9 million ounces at a cost of sales of $675-735 per ounce and all-in sustaining costs of $890-990 per ounce. Capital expenditures are forecasted to be $755 million. The Americas are expected to contribute 61% of 2016 production at a cost of sales of $730-790 per ounce from its six mines in the US, Brazil and Chile. Kinross has a diversified portfolio of operating mines and development projects globally.
062916 nevada mine tour presentation final printedKinrossGold
Kinross Gold Corporation hosted a mine tour at its Bald Mountain Mine in Nevada on June 29-30, 2016. The presentation provided an overview of Bald Mountain, including:
1) Bald Mountain is a large, open-pit heap leach gold mine in Nevada with significant mineral reserves and upside potential from resource conversion and exploration.
2) Near-term opportunities exist to potentially double mineral reserve estimates by the end of Q1 2017 through conversion of the Vantage Complex and Saga Extension.
3) Longer-term opportunities for further mine life extension include converting measured and indicated resources to reserves with additional drilling and permitting. Bald Mountain also has extensive exploration potential across its large land package.
Glaukos Corporation is an ophthalmic medical technology company transforming glaucoma treatment. Their minimally-invasive micro-scale injectable therapies, including the iStent, provide more effective treatment options compared to eye drops and traditional surgeries. Clinical trials demonstrate the iStent used with cataract surgery significantly lowers intraocular pressure up to 3 years post-op while reducing medication use. Additional studies show promise for combination treatments and sustained efficacy of micro-scale injectable therapies.
Glaukos Corporation will be releasing an investor presentation for the third quarter of 2016. The presentation will provide investors with information on the company's financial performance and business operations for the recent quarterly period. Details on Glaukos' progress, strategies, and outlook will be shared in the upcoming Q3 2016 investor presentation.
Kinross Gold Corporation held a Q2 2016 results conference call on July 28, 2016. Key highlights included:
- Kinross generated $218 million in free cash flow in Q2 2016, increasing its cash balance to $968 million.
- Production was on track to meet 2016 guidance, with strong performances from mines in Russia, the US and Brazil.
- Operations at Tasiast were temporarily suspended in June due to work permit issues but are expected to resume in August.
- Kinross has attractive growth opportunities at its Bald Mountain and Round Mountain mines in Nevada.
- Kinross maintained a strong balance sheet and liquidity position of $2.5 billion to fund its projects.
Glaukos investor presentation q2 2016 for website 08032016glaukos
Glaukos Corporation is a medical technology company transforming glaucoma treatment. Their solution portfolio includes micro-scale injectable therapies to restore and enhance aqueous outflow including the iStent, iStent Inject, and iStent Supra. Clinical trials show the iStent reduces intraocular pressure and medication use when used with cataract surgery or as a standalone procedure. Glaukos has established global commercial operations and seized the first mover opportunity in key markets since US FDA approval of the iStent.
Kinross Gold Corporation provides a presentation at the 2016 Denver Gold Forum discussing its operational excellence and outlook. Kinross forecasts 2016 gold equivalent production of 2.7-2.9 million ounces at a production cost of sales of $675-735 per ounce. Key growth opportunities include completing the Phase One expansion at Tasiast and further expanding production and reducing costs through a potential Phase Two project. Kinross also sees opportunities to increase reserves and extend mine life at Bald Mountain through conversion of resources and exploration.
The document discusses forward-looking statements made by SQM concerning its business outlook. It notes that while estimates are based on best judgment, actual results could differ materially from projections due to risks and uncertainties. It directs readers to SEC filings for further information on factors that could affect the accuracy of forward-looking statements.
This document provides an overview, agenda, and financial information for SQM's specialty business presentation in May 2013. The summary highlights that SQM is a world leader in specialty chemicals like lithium, iodine, and potassium nitrate. It also notes SQM has a strong financial profile with 46% EBITDA margins and revenue growth of over 69% since 2009. The document outlines SQM's growth opportunities across its fertilizer and specialty chemical segments.
The document outlines SQM, a global mining company based in Chile, and discusses its business lines including being a leading producer of potassium nitrate, iodine, lithium, and industrial chemicals. It highlights SQM's unique natural resources in Chile, sales to over 115 countries, solid financial position, and capital expenditure plans to increase production capacities of various products.
SQM is a global producer of specialty plant nutrients, lithium and industrial chemicals. It has unique and abundant natural resources in Chile. SQM has leading market positions in several businesses including potassium nitrate, iodine, lithium and industrial chemicals. It has a solid financial position and expects higher sales volumes and prices in 2016 for key products like lithium and solar salts.
The document discusses SQM's business outlook, noting that any statements about future economic performance or other financial forecasts constitute "forward-looking statements." It warns that a number of risks and uncertainties could cause actual results to differ from these statements. The document identifies public securities filings and other factors that should be considered regarding the accuracy of forward-looking information.
SQM is a global producer of specialty plant nutrients, iodine, lithium, and industrial chemicals. In 2015, SQM reported revenues of $1.7 billion and EBITDA of $724 million, with a 42% EBITDA margin. SQM has unique and abundant natural resources in Chile, including the world's largest deposits of nitrates and iodine. It is also the lowest cost producer of lithium globally. SQM has a solid financial position and expects higher sales volumes and capital expenditures in 2016.
The document discusses SQM, a global company based in Chile that produces specialty plant nutrients, iodine, lithium, potassium chloride, and industrial chemicals. It notes that any statements about future economic performance or other forward-looking statements involve risks and uncertainties. It also states that risks that could affect the accuracy of forward-looking statements are identified in public filings with the SEC. The agenda then outlines SQM's business lines and investment highlights, including its unique natural resources, global sales, market leading positions, and competitive advantages.
SQM is a global producer of specialty plant nutrients, industrial chemicals, and lithium. It has unique and abundant natural resources in Chile. The presentation highlights SQM's leading market positions, solid financial performance, and opportunities for future growth through increased sales volumes and cost reductions. Key investment highlights include low-cost operations, sales diversification globally, and a strong financial position.
The document discusses SQM's business outlook and provides forward-looking statements regarding financial performance. Any forward-looking statements involve risks and uncertainties that could cause actual results to differ from projections. Risk factors are identified in public filings with the SEC. The agenda includes an overview of SQM, its fertilizer and specialty chemical businesses, and financial information. SQM is a global company and world leader in lithium, iodine, potassium nitrate and solar salts. It has a strong financial profile with revenue growth, EBITDA margins over 40%, and the highest liquidity in Chile.
This document provides a summary of Kinross Gold Corporation's Q3 2016 results conference call. It discusses strong operational and financial performance in Q3 2016, with increased production and lower costs compared to Q2 2016. Key growth opportunities are also highlighted, including projects at Bald Mountain, Round Mountain Phase W, La Coipa Phase 7, and Tasiast's two-phased expansion. Guidance for 2016 is updated, with capital expenditures lowered to $650-675 million.
Kinross Gold Corporation presented at the BMO Capital Markets Global Mining & Metals Conference on February 26-28, 2017. Kinross has a diverse portfolio of operating mines that consistently meet or outperform operational targets. Kinross is advancing high-quality organic development projects that offer opportunities to expand production or extend mine life at existing operations. These projects include the two-phased expansion at Tasiast and developing the potential at Bald Mountain. Kinross maintains a strong balance sheet and financial flexibility to fund its projects.
Kinross Gold Corporation reported its Q1 2017 results and outlined its priorities for 2017. Key highlights include:
- Production of 671,956 Au eq. oz. in Q1 2017, on track to meet full-year guidance of 2.5-2.7 million Au eq. oz.
- Continued focus on cost discipline with production costs of $701/oz and AISC of $953/oz in Q1 2017.
- Advancing the two-phased expansion at Tasiast, with Phase One on schedule and budget.
- Strengthening the balance sheet through the sale of its Cerro Casale interest for $260 million in cash.
- Focus on organic growth
This document provides a summary of Kinross Gold Corporation's Q4 and full-year 2016 results conference call. It discusses 2016 highlights including meeting or exceeding guidance for the fifth consecutive year. Priorities for 2017 include continuing operational excellence, advancing the two-phased expansion at Tasiast, developing Bald Mountain's potential, and advancing organic projects. The document also provides Kinross' 2017 guidance figures and discusses its strong balance sheet and financial discipline.
Kinross Gold Corporation held a Q4 & FY 2016 Results Conference Call & Webcast on February 16, 2017 to discuss highlights from 2016 and priorities for 2017. Some key points include:
- Kinross met or exceeded annual guidance for five consecutive years for production, cost of sales, and capital expenditures.
- The Tasiast two-phased expansion is expected to transform the mine into the largest producer with costs amongst the lowest in the portfolio. Phase one is on schedule and budget.
- At Bald Mountain, Kinross doubled mineral reserve estimates ahead of schedule in 2016 and envisions the mine as a long-life asset. Production is expected to double in 2017.
- Organic development projects in the
This document provides an overview of Kinross Gold Corporation's Bald Mountain Mine in Nevada. Key points include:
- Bald Mountain is an open-pit heap leach gold mine that fits well within Kinross' portfolio of assets.
- The mine has significant mineral reserves and upside potential from near-term and longer-term opportunities. Near-term opportunities could double mineral reserve estimates by early 2017.
- Bald Mountain has a large land package that remains largely under-explored, with over 20 identified exploration targets.
- 2016 production and costs are expected to be lower than planned due to stripping activities and winter conditions, but results are expected to improve significantly in 2017-2018.
- The document is a cautionary statement regarding forward-looking statements from a CIBC investor conference presentation by Laurie Brlas, CFO of Newmont Mining Corporation.
- It outlines the risks and uncertainties inherent in forward-looking estimates and projections, noting that actual results could differ materially from expectations.
- Key assumptions that could affect results include geotechnical, metallurgical and other conditions, as well as commodity prices, exchange rates, approvals and permits, and mineral reserve estimates.
The document provides an agenda and overview for a CC&V site tour on September 18, 2016. The tour will include introductions, a safety overview, and stops at the Cripple Creek & Victor site to discuss the overview, exploration/geology, mining operations, mill processing, and future expansion plans. Presenters will discuss how CC&V is meeting acquisition targets through cost improvements and new facilities, and trends show operating results are favorable to guidance. The tour schedule provides times and locations for presentations on CC&V and a lunch discussion on sustainability.
Stornoway Diamond Corporation is building Quebec's first diamond mine, the Renard Diamond Project. Construction began in July 2014 and is on schedule and on budget. Commercial production is planned to begin in Q2 2017. The mine will utilize open pit and underground mining over an 11 year mine life based on current reserves, with potential to significantly extend the mine life through exploration. The project is fully financed and permitted to develop Quebec's first diamond mine.
Gary Goldberg, President and CEO of Newmont Mining Corporation, presented at the BAML Metals & Mining Conference in May 2016. The presentation focused on Newmont's strategy of improving its underlying business through leading safety and cost performance, strengthening its portfolio through organic growth and transactions, and creating shareholder value through a superior balance sheet and cash flow. Newmont has reduced costs by 30% since 2012 and is building a longer-life, lower-cost asset portfolio through projects like Merian and Long Canyon.
Claude Resources held its Q1 2016 earnings call on May 5, 2016 to report strong production and financial results for the quarter. Highlights included production of 20,672 ounces of gold from its Seabee Gold Operation in Saskatchewan, generating $14.3 million in cash flow from operations. Exploration success at the Santoy Gap zone is expected to contribute approximately 80% of production for 2016 as mining transitions to higher grade areas. The company also announced a proposed acquisition by Silver Standard that will create a mid-tier precious metals producer with improved scale, financial strength, and growth opportunities.
This three sentence summary provides the high level information from the investor presentation document:
The document is an investor presentation from Newmont Mining Corporation that includes forward-looking statements and cautions readers that actual results may differ. It outlines Newmont's strategy of improving operational performance, strengthening its portfolio through projects like Merian and Long Canyon, and creating shareholder value through increased free cash flow and returns. The presentation also provides updates on Newmont's safety and sustainability performance as well as its financial and operating results.
This document is an investor presentation from Newmont Mining Corporation dated December 13, 2016. It contains forward-looking statements regarding estimates and expectations of future production, costs, capital expenditures, profitability, and other metrics. It cautions that these statements are based on assumptions that may prove to be incorrect. The presentation provides an overview of Newmont's strategy to improve its underlying business, strengthen its portfolio, and create shareholder value. It summarizes recent performance results and updates to guidance. Newmont aims to maximize opportunities and manage risks across its global operations and projects.
This document provides a cautionary statement regarding forward-looking statements in Newmont Mining Corporation's investor presentation. It notes that estimates and expectations in the presentation are based on assumptions that may prove to be incorrect. It lists key assumptions including around geological, metallurgical and other conditions, permitting, development and expansion of operations, political stability, exchange rates, commodity prices, supply prices, mineral reserve and resource estimates, and other risks. The company does not undertake to publicly revise or update forward-looking statements except as required by law.
Claude Resources held its Q1 2016 earnings call on May 5, 2016 to discuss the company's financial and operational results. Key highlights included strong production from mining higher grade ore, generating earnings and free cash flow. Exploration success at Santoy Gap is expected to provide around 80% of production for 2016-2017. The call also discussed Claude's proposed acquisition by Silver Standard, which would create a larger intermediate precious metals producer with improved scale and financial position.
Stornoway Diamond Corporation is constructing Quebec's first diamond mine, the Renard Diamond Project. The mine is fully permitted and financed, with construction 22.4% complete and on budget. Plant commissioning is scheduled for 2H 2016 and commercial production is planned for 2Q 2017. The mine plan is based on an 11-year reserve of 17.9 million carats, but exploration continues to expand resources and extend potential mine life. Analyst consensus values Stornoway's shares at $1.14, representing 37% upside from the current price.
UnityNet World Environment Day Abraham Project 2024 Press ReleaseLHelferty
June 12, 2024 UnityNet International (#UNI) World Environment Day Abraham Project 2024 Press Release from Markham / Mississauga, Ontario in the, Greater Tkaronto Bioregion, Canada in the North American Great Lakes Watersheds of North America (Turtle Island).
SUSTAINABLE INVESTING UNVEILED: THE ROLE OF BOND RATINGS IN GUIDING GREEN BON...indexPub
The increasing urgency to address climate change has propelled sustainable investing into the spotlight, with green bonds emerging as a pivotal instrument for mobilizing the capital required for environmental projects. This study delves into the critical role that bond ratings play in guiding investments in green bonds, shedding light on how these ratings influence investor confidence and the allocation of funds towards sustainable initiatives. By employing a mixed-methods approach, combining quantitative analysis of green bond performance with qualitative interviews from industry experts, this research offers a comprehensive overview of the interplay between bond ratings and green bond investments. The findings suggest that higher bond ratings, often indicative of lower risk and better sustainability credentials, significantly impact the attractiveness of green bonds to investors. Additionally, the study examines the evolution of rating criteria to encompass environmental, social, and governance (ESG) factors, highlighting the shift towards more holistic assessments of investment risk and potential. This research contributes to the broader discourse on sustainable finance by providing insights into the mechanisms through which bond ratings can facilitate more informed and impactful green bond investments.
Bienestar Financiero al servicio de su jubilación anticipada
Pago de su 🏡
Estudio de sus hijos
Directamente a tu cuenta bancaria
Con Tesorería Auditoria Jurídica comercial
Administración de carteras
Apalancamiento Financiero
Desarrollo de tu marca personal
Acceso a Desarrollo de varias industrias
Cuentas bancarias
Estructuras Físicas en USA y en América Central
Avalado por Bolcomer
Puesto de Bolsa Comercial
Turismo
Y mucho más
Link de registro
https://business.myinfinity.global/maurod8/
https://therusnetwork.com/
Contacto:
https://goo.su/pzm1fja
2. www.kinross.com
2
CAUTIONARY STATEMENT ON FORWARD-LOOKING
INFORMATION
All statements, other than statements of historical fact, contained or incorporated by reference in or made in giving this presentation and responses to questions,
including but not limited to any information as to the future performance of Kinross, constitute “forward looking statements” within the meaning of applicable securities
laws, including the provisions of the Securities Act (Ontario) and the provisions for “safe harbour” under the United States Private Securities Litigation Reform Act of
1995 and are based on expectations, estimates and projections as of the date of this presentation. Forward-looking statements contained in this presentation include
those statements on slides with, and statements made under, the headings “The Way Forward - Principles for Building Value”, “2015 Outlook - Guidance Update”, “New
Processing Initiative at Paracatu”, “Organic Growth Opportunities”, “Pre-feasibility Study Results”, Life of Mine Estimates”, “Russia - Near-Site Exploration Targets”,
“Chirano Mine Life Extension”, “Tasiast Expansion Project”, “Strong Balance Sheet”, “Levers for Reducing Costs”, “Compelling Valuation”, “Kinross Value Proposition”
and “2014 Gold Reserve and Resource Estimates”, and include without limitation statements with respect to our guidance for production, production costs of sales, all-in
sustaining cost and capital expenditures, continuous improvement and other cost savings opportunities, as well as references to other possible events include, without
limitation, possible events; opportunities; statements with respect to possible events or opportunities; estimates and the realization of such estimates; future
development, mining activities, production and growth, including but not limited to cost and timing; success of exploration or development of operations; the future price
of gold and silver; currency fluctuations; expected capital requirements; government regulation; and environmental risks. The words “2015E”, “alternatives”,
“compelling”, “concept”, “encouraging”, “estimate”, “expect”, “explore”, “feasibility”, “flexibility”, “forecast”, “focus”, “FS”, “future”, “guidance”, “initiative”, “indicate”,
“intend”, “objective”, “on track”, “opportunity”, “optimize”, “option”, “outlook”, “plan”, “PFS”, “positioned”, “possible”, “potential”, “pre-feasibility”, “principles”, “priority”,
“project”, “prospective”, “pursue”, “risk”, “strategy”, “study”, “target” or “way forward”, or variations of such words and phrases or statements that certain actions, events
or results may, can, could, would, should, might, indicates, achieved or will be taken, and similar expressions identify forward looking statements. Forward-looking
statements are necessarily based upon a number of estimates and assumptions that, while considered reasonable by Kinross as of the date of such statements, are
inherently subject to significant business, economic and competitive uncertainties and contingencies. Statements representing management’s financial and other
outlook have been prepared solely for purposes of expressing their current views regarding the Company’s financial and other outlook and may not be appropriate for
any other purpose. Many of these uncertainties and contingencies can affect, and could cause, Kinross’ actual results to differ materially from those expressed or
implied in any forward looking statements made by, or on behalf of, Kinross. There can be no assurance that forward looking statements will prove to be accurate, as
actual results and future events could differ materially from those anticipated in such statements. All of the forward looking statements made in this presentation are
qualified by these cautionary statements, and those made in our filings with the securities regulators of Canada and the U.S., including but not limited to those
cautionary statements made in the “Risk Factors” section of our most recently filed Annual Information Form, the “Risk Analysis” section of our FYE 2014 and Q3 2015
Management’s Discussion and Analysis, and the “Cautionary Statement on Forward-Looking Information” in our news releases dated November 10 and November 12,
2015, to which readers are referred and which are incorporated by reference in this presentation, all of which qualify any and all forward‐looking statements made in this
presentation. These factors are not intended to represent a complete list of the factors that could affect Kinross. Kinross disclaims any intention or obligation to update
or revise any forward‐looking statements or to explain any material difference between subsequent actual events and such forward‐looking statements, except to the
extent required by applicable law.
Other information
Where we say "we", "us", "our", the "Company", or "Kinross" in this presentation, we mean Kinross Gold Corporation and/or one or more or all of its subsidiaries, as may
be applicable. The technical information about the Company’s mineral properties (other than exploration activities) contained in this presentation has been prepared
under the supervision of Mr. John Sims, an officer of the Company who is a “qualified person” within the meaning of National Instrument 43-101 (“NI 43-101”). The
technical information about the Company’s exploration activities contained in this presentation has been prepared under the supervision of Mr. Sylvain Guerard, an
officer of the Company who is a “qualified person” within the meaning of NI 43-101.
3. www.kinross.com
3
• Focus on operational excellence
• Quality over quantity
• Disciplined capital allocation
• Maintaining a strong balance sheet
3
THE WAY FORWARD
PRINCIPLES FOR BUILDING VALUE
5. www.kinross.com
5
Q3 2015 YTD Q3 2015 2015 GUIDANCE(1)
Gold equivalent production (oz.)(2) 680,679 1,970,937 2.5 to 2.6 Moz.
Production cost of sales ($/oz.)(3) $668 $699 $690 to $730
All-in sustaining cost ($/oz.)(4) $941 $970 $975 to $1,025
Capital Expenditures ($M) $171 $449 $650
THIRD QUARTER HIGHLIGHTS
DELIVERING STRONG PERFORMANCE
• Strong performance from operations delivered solid Q3 2015 results
• On track to meet 2015 REVISED guidance for production, cost of sales and all-in
sustaining cost
• Expect to come in BELOW 2015 guidance for capital expenditures and overhead costs
Continuing track record of meeting or beating our operational targets
(1) Refer to endnote #1.
(2) Refer to endnote #2.
(3) Refer to endnote #3.
(4) Refer to endnote #4.
6. www.kinross.com
6
2015E GOLD EQUIVALENT
PRODUCTION(1,2)
OPERATIONAL EXCELLENCE
DIVERSIFIED PORTFOLIO OF OPERATING MINES
GLOBAL PORTFOLIO
Operating mine
Development project
Round Mountain
Kettle River-Buckhorn
Fort Knox
La Coipa
Paracatu
Maricunga
Kupol
Dvoinoye
Chirano
Tasiast
AMERICASRUSSIA
WEST AFRICA
(3) Refer to endnote #3.
Over 50% of estimated 2015 gold equivalent production from mines located in the Americas
54%
17%
29%
Americas West Africa Russia
2.5-2.6M
ounces
(1) Refer to endnote #1.
(2) Refer to endnote #2.
7. www.kinross.com
7
• Five mines located in the US, Brazil and Chile
• Over 50% of annual production is from the Americas region
AMERICAS
7
8. www.kinross.com
8
OPERATIONAL EXCELLENCE
AMERICAS
• ROUND MOUNTAIN benefiting from
continuous improvement initiatives aimed
at improving heap leach operations
• FORT KNOX production cost of sales
benefiting from lower power costs and
higher production
OPERATION
GOLD EQUIVALENT PRODUCTION PRODUCTION COST OF SALES ($/oz.)(3)
Q3 2015 YTD Q3 2015 Q3 2015 YTD Q3 2015
Fort Knox 115,258 313,992 $556 $604
Round Mountain (50%) 58,074 146,784 $687 $769
Kettle River - Buckhorn 24,222 78,067 $795 $859
Paracatu 129,064 364,115 $747 $777
Maricunga 52,672 157,207 $1,004 $1,037
AMERICAS TOTAL 379,290 1,060,165 $718 $769
(3) Refer to endnote #3.
• PARACATU production increased due to
higher mill grades and increased recovery,
which improved cost of sales
Temporarily suspended Plant 1 and
reduced operations at Plant 2 due to
lack of rainfall
Not expected to impact 2015 regional or
company-wide guidance
9. www.kinross.com
9
AMERICAS
NEW PROCESSING INITIATIVE AT PARACATU
Modest capital investment to add low-cost, incremental production
• Low-cost, incremental production
resulting from:
Enriched grades near discharge
areas of the facility
Utilization of excess capacity in
Plant 1 due to ore blending strategy
Lower energy consumption as no
grinding required
• Modest capital investment of $20 million
10. www.kinross.com
10
ORGANIC GROWTH OPPORTUNITIES
LA COIPA PROJECT
• Pre-feasibility study on La Coipa completed during Q3 2015
• Project offers a number of expected attractive attributes:
Leverages existing infrastructure
Relatively low execution risk
Modest capital investment
Exploration upside
Located in an attractive jurisdiction
10
11. www.kinross.com
11
PRE-FEASIBILTY STUDY RESULTS
LA COIPA PROJECT
Life of Mine Estimates (100% basis)(i)
Life of Mine 5.5 years
Total ounces recovered 1.03 million gold equivalent ounces
Average annual production 207,000 gold equivalent ounces per year
Average cost of sales $674 per gold equivalent ounce
Average all-in cost(ii) $767 per gold equivalent ounce
Initial capital $94 million
Pre-Stripping $105 million
IRR (after-tax) 20%
NPV $120 million
• PFS based on using existing infrastructure to blend and process higher grade material
from the recently delineated Phase 7 deposit with oxide/transition material from the
existing Puren deposit
Project expected to generate a 20% IRR at an assumed gold price of $1,200 per ounce
(i) Summary results are shown on a 100% basis, however, Kinross has a 75% interest in Phase 7 and a 65% interest in Puren.
(ii) All-in cost includes operating costs, sustaining capital, and post start-up capitalized stripping and does not include estimated initial capital expenditures of $94 million and estimated
pre-stripping of $105 million, and any exploration, income taxes and non-cash items related to reclamation or allocation of regional or corporate overhead costs. This differs from
the World Gold Council definition of all-in cost.
12. www.kinross.com
12
PRE-FEASIBILTY STUDY RESULTS
LA COIPA PROJECT
PERMITTING
• Submitted a DIA earlier this year
• Preparing a response to the relevant agencies’ review and
request for additional information
EXPLORATION
• Exploration continues at several district targets, including
Catalina (located 1 km SE of Phase 7)
• Further exploration work planned to assess opportunities to
extend the estimated mine life beyond what is contemplated
in the PFS
OPTIMIZATION STUDIES
• Intend to complete blending and optimization studies
Based on positive results, Kinross intends to complete further optimization studies and
continue to assess additional exploration opportunities at La Coipa
14. www.kinross.com
14
OPERATIONAL EXCELLENCE
RUSSIA
• Continued strong performance from the combined
KUPOL-DVOINOYE operation
• Q3 production cost of sales decreased year-over-
year to $469 per Au eq. oz.
• Lowest level since Dvoinoye operations
commenced in 2013
• Benefiting from higher mill grades resulting
from processing an increased portion of
higher grade Dvoinoye material and
favourable foreign exchange rates
(3) Refer to endnote #3.
OPERATION
GOLD EQUIVALENT PRODUCTION PRODUCTION COST OF SALES ($/oz.)(3)
Q3 2015 YTD Q3 2015 Q3 2015 YTD Q3 2015
Kupol - Dvoinoye 190,366 567,255 $469 $477
RUSSIA TOTAL 190,366 567,255 $469 $477
15. www.kinross.com
15
RUSSIA
NEAR-SITE EXPLORATION TARGETS
MOROSHKA
• Located approximately 4 km East of Kupol
• Drilling defined ~198koz. gold and ~2.3Moz.
silver of estimated Indicated Mineral
Resources(5)
SEPTEMBER NORTH-EAST
• Located approximately 15 km NW of
Dvoinoye
• Drilling defined high-grade gold
mineralization over a strike length of 150 m
• Work planned in 2015 to define an initial
mineral resource estimate
For additional information, please see Kinross’ news release dated February 10, 2015 and Appendices A and B, which are available on our website at
www.kinross.com , as well as the Explanatory Notes available on slide 47 of this presentation.
(5) Refer to endnote #5.
18. www.kinross.com
18
• Record annual production for Tasiast and Chirano in 2014
• Strong focus on optimizing efficiency and performance
WEST
AFRICA
18
19. www.kinross.com
19
OPERATIONAL EXCELLENCE
WEST AFRICA
• TASIAST production decreased compared with
Q2 2015 due mainly to the wind-down of dump
leach production
• CHIRANO production decreased as a result of
expected lower grades due to declining
contribution from the Akwaaba underground
deposit
• Development of the Akoti decline continued,
with ~250 metres completed at quarter-end
• Production from Akoti is expected to begin
in the second half of 2016
(2) Refer to endnote #2.
(3) Refer to endnote #3.
OPERATION
GOLD EQUIVALENT PRODUCTION PRODUCTION COST OF SALES ($/oz.)(3)
Q3 2015 YTD Q3 2015 Q3 2015 YTD Q3 2015
Tasiast 53,440 165,339 $1,057 $1,042
Chirano (90%)(2) 57,583 178,178 $701 $675
WEST AFRICA TOTAL 111,023 343,517 $880 $848
20. www.kinross.com
20
• Extension of estimated mine life to 2020 with additional mineral resource estimates at
two deposits:
Paboase (currently in production)
Akoti underground (production expected to begin mid-2016)
• Provides additional time to pursue exploration potential in a highly-prospective region
WEST AFRICA
CHIRANO MINE LIFE EXTENSION
1 km
MAMNAOSARIEHUAKWAABA SURAW PABOASE TANOAKOTI
Mine life extension at one of Kinross’ lowest cost operations
For additional information, please refer to our Annual Mineral Reserve and Mineral Resource Statement as at December 31, 2014 contained in our news
release dated February 10, 2015, available on our website at www.kinross.com.
21. www.kinross.com
21
ORGANIC GROWTH OPPORTUNITIES
PHASED APPROACH TO A TASIAST MILL EXPANSION
• Concept under study would add incremental capacity to increase mill throughput in
two phases by leveraging existing infrastructure
PHASE ONE would increase throughput to 12,000 tpd with the addition of a
gyratory crusher and oversized SAG mill
PHASE TWO could further increase total throughput to as much as 38,000 tpd
with additional milling, leaching, thickening and refining capacity
• Opportunity to realize Tasiast’s growth potential while substantially lowering overall
capital costs compared with the previous estimate of $1.6B
21
22. www.kinross.com
22
TASIAST EXPANSION PROJECT
TWO-PHASED EXPANSION CONCEPT
CONCEPUTAL FLOW SHEET
PHASE ONE
• Leverages existing mill infrastructure to increase throughput to 12,000 tpd from 8,000 tpd
• Includes installation of an oversized SAG mill and gyratory crusher
• Expected to enhance processing of the harder, higher grade West Branch ore and
improve Tasiast’s production and operating costs
Gyratory
crusher
Ore
stockpile
Oversized
SAG mill
Existing ball mills
Leaching Refining
23. www.kinross.com
23
Highlights of the early detailed engineering work completed to date on Phase One
TASIAST EXPANSION PROJECT
PHASE ONE ESTIMATES
Metric Estimates
Average annual production – first 2 years 368,000 gold ounces
Cash cost per ounce – first 2 years $575 per gold equivalent ounce
All-in sustaining cost per ounce – first 2 years(i) $725 per gold equivalent ounce
Initial capital $290 million
Construction period 2 years
The initial capital expenditure estimate of
$290 million includes:
• Installation of an oversized SAG mill,
gyratory crusher and 3 leach tanks
• Maintenance improvements to other
components of the processing circuit
Category ($ millions)
Direct cost (including freight) $180
Indirect and owner’s cost $80
Contingency $30
INITIAL CAPITAL ESTIMATE
(i) All-in sustaining cost includes operating costs, royalties, sustaining capital, and does not include estimated initial capital expenditures of $290 million during
the two-year construction period, pre-stripping of $483 million during two-year construction period and first two years of production, and any exploration,
income taxes and non-cash items related to reclamation or allocation of regional or corporate overhead costs. This differs from the World Gold Council
definition of all-in cost.
24. www.kinross.com
24
TASIAST EXPANSION PROJECT
TWO-PHASED EXPANSION CONCEPT
CONCEPUTAL FLOW SHEET
PHASE TWO
• Could further increase total throughput to as much as 38,000 tpd with the addition of
milling, leaching, thickening and refining capacity
Gyratory
crusher
Ore
stockpile
Oversized
SAG mill Additional ball
milling capacity
Additional leaching
capacity
Thickening
25. www.kinross.com
25
A FINANCIALLY PRUDENT ALTERNATIVE TO REALIZING TASIAST’S GROWTH POTENTIAL
• A feasibility study on the initial Phase One project to increase throughput to 12,000 tpd is
expected to be completed in Q1 2016
• Upon completion of the FS, further details regarding project economics and Phase Two of a
potential expansion would be released
• Any potential go-forward decision will depend on a range of factors, including gold price
environment, expected economic returns and various technical considerations
TASIAST EXPANSION PROJECT
A PHASED APPROACH TO A MILL EXPANSION
A phased approach would optimize the current operation in the near-term while reducing
overall capital cost of a larger expansion
TASIAST OREBODY & RESOURCE PIT(i)
(i) For additional information, please refer to the Tasiast Technical Report dated March 31, 2014 and to our Annual Mineral Reserve and Mineral Resource
Statement as at December 31, 2014 contained in our news release dated February 10, 2015, both available on our website at www.kinross.com.
27. www.kinross.com
27
STRONG BALANCE SHEET
SOLID FINANCIAL POSITION(i)
$1.0
$1.5
Cash, cash equivalents and restricted cash
Undrawn credit facilities
STRONG LIQUIDITY POSITION
Maintaining balance sheet strength & financial flexibility remain priority objectives
MAINTAINING FINANCIAL FLEXIBILITY
• Improved balance sheet during the first 9 months of
2015:
Added $41M to cash position, ending the period
with over $1.0B in cash and cash equivalents
Repaid over $80M of debt and reduced net debt
position to under $950M
• Only debt maturity prior to 2019 is $250M of senior
notes due in 2016
• Pre-paid the remaining balance of the Kupol loan
which was due in 2016
$2.5B
AS AT SEP. 30, 2015
(i) Information on this slide is as at September 30, 2015 and does not take into account the Nevada asset purchase announced November 12, 2015.
Kinross’ liquidity position proforma the transaction is estimated to be $1.9B.
28. www.kinross.com
28
FINANCIAL DISCIPLINE
FOCUS ON MANAGING COSTS
REVIEW OF DISCRETIONARY SPENDING
• Completed company-wide review of overhead
spending and organizational structure
• Reduced corporate labour costs by 23%, with
expected annualized savings of $20M
OPERATIONAL IMPROVEMENTS
• Achieving cost savings through continuous
improvement initiatives. Highlights include:
Transition to self-perform mining at CHIRANO
Ore-blending strategy at PARACATU
ROUND MOUNTAIN heap leach enhancements
contributing to highest production in 6 years with
lowest cost of sales since Q3 2012
ALL-IN SUSTAINING COST(4)
($ per gold equivalent ounce)
(4) Refer to endnote #4.
$1,122
$1,082
$973 $970
2012 2013 2014 YTD Q3 2015
29. www.kinross.com
29
FINANCIAL DISCIPLINE
LEVERS FOR REDUCING COSTS
Proactively managing our business with a strict focus on the health of our balance sheet
Market factors outside of our
control
Levers for reducing costs
FX
Oil
Gold price
Higher cost mines
Discretionary spending
Opex
CASH
FLOW
32. www.kinross.com
32
COMPELLING VALUATION
NET DEBT TO EBITDA (LTM)
Source: Bloomberg, company reports
Information on this slide is as at September 30, 2015 and does not take into account the Nevada asset purchase announced November 12, 2015. Adjusting for
the $610 million in cash paid to Barrick and the EBITDA for Bald Mountain (100%) and Round Mountain (additional 50%) for the last twelve months, Kinross’
proforma net debt to EBITDA ratio for the last twelve months would be 1.4x
2.9
2.6
1.9
1.3
1.2
1.1
0.6
Barrick Yamana Goldcorp Agnico Newmont Kinross Eldorado
33. www.kinross.com
33
COMPELLING VALUATION
ENTERPRISE VALUE VERSUS PRODUCTION
2016E Gold
Production
(Moz.)(ii)
Delta with
Kinross
(US$B)
Multiple of
Kinross
Enterprise
Value
Barrick 5.7 18.0 7.9
Newmont 4.9 12.4 5.8
Goldcorp 3.6 8.2 4.2
Kinross 2.8 - -
Agnico 1.3 4.1 2.6
Yamana 1.7 0.5 1.2
Eldorado 0.6 (0.6) 0.8
(i) Source: Bloomberg – January 19, 2016; Company reports
(ii) Source: CIBC World Markets
$20.6
$15.0
$10.8
$6.7
$3.1
$2.6
$2.0
Barrick Nemont Goldcorp Agnico Yamana Kinross Eldorado
Enterprisevalue(US$billions)(i)
34. www.kinross.com
34
Bloomberg analyst consensus – January 19, 2016.
COMPELLING VALUATION
2016E METRICS
Attractive value opportunity relative to peers, considering Kinross’ annual production,
cost structure, track record and growth opportunities
EV / 2016E EBITDA P / 2016E OPERATING CF
9.5
7.4
6.8
6.6 6.5
5.2
2.8
Agnico Eldorado Barrick Goldcorp Newmont Yamana Kinross
8.9
6.4
5.4
4.7
4.2
2.5
1.8
Agnico Eldorado Goldcorp Newmont Barrick Yamana Kinross
35. www.kinross.com
35
KINROSS VALUE PROPOSITION
EXCELLENT OPERATIONAL TRACK RECORD
• Continuing to meet or outperform our operational targets
STRONG BALANCE SHEET
• $2.5B in liquidity(i) and conservative net debt of ~$950M
• Repaid the Kupol loan during Q3, ahead of schedule
ATTRACTIVE FUTURE GROWTH OPPORTUNITIES
• La Coipa pre-feasibility study generated positive results
• Phased approach to Tasiast expansion offers a financially
prudent alternative to realizing significant growth potential
• Advancing organic production initiatives at Paracatu and
Chirano
COMPELLING VALUATION
• Attractive value opportunity relative to peers, considering
annual production, cost structure, track record and relatively
low-risk growth opportunities
SHARE INFORMATION
K – Toronto Stock Exchange
KGC – New York Stock Exchange
(i) As at September 30, 2015. This figure does not take into account Kinross’ acquisition of Nevada assets announced November 12, 2015.
Kinross’ liquidity position proforma the transaction is $1.9B.
37. www.kinross.com
37
• Impressive track record of operational excellence
AMERICAS
FORT KNOX, USA (100%)
TONNES
(thousands)
GRADE
(g/t)
OUNCES
(thousands)
2P Reserves 163,844 0.46 2,398
M&I Resources 105,453 0.43 1,446
Inferred Resources 13,500 0.44 189
(3) Refer to endnote #3.
(5) Refer to endnote #5.
FY 2014
YTD Q3
2015
Production (Au. Eq. oz.) 379,453 313,992
Production cost of sales ($/oz.) $712 $604
OPERATING RESULTS(3)
2014 GOLD RESERVE AND RESOURCE ESTIMATES(5)
Among the world’s few cold climate heap leach facilities
38. www.kinross.com
38
• On November 12, 2015, Kinross announced an
agreement to purchase the other 50% of Round
Mountain from Barrick Gold Corporation
AMERICAS
ROUND MOUNTAIN, USA (50%)*
TONNES
(thousands)
GRADE
(g/t)
OUNCES
(thousands)
2P Reserves 27,300 0.79 689
M&I Resources 23,768 0.58 440
Inferred Resources 7,861 0.51 130
FY 2014
YTD Q3
2015
Production (Au. Eq. oz.) 169,839 146,784
Production cost of sales ($/oz.) $855 $769
Round Mountain is a best-practice leader in many areas, including preventative maintenance
OPERATING RESULTS(3)
2014 GOLD RESERVE AND RESOURCE ESTIMATES(5)
(3) Refer to endnote #3.
(5) Refer to endnote #5.
39. www.kinross.com
39
• Significant cash flow contributor with costs among the
lowest in the portfolio
• Small footprint operation
AMERICAS
KETTLE RIVER-BUCKHORN, USA (100%)
TONNES
(thousands)
GRADE
(g/t)
OUNCES
(thousands)
2P Reserves 351 9.0 101
M&I Resources 18 7.27 4
Inferred Resources 26 7.19 6
FY 2014
YTD Q3
2015
Production (Au. Eq. oz.) 123,382 78,067
Production cost of sales ($/oz.) $678 $859
Low-cost, high-grade underground mine located in Washington state
OPERATING RESULTS(3)
2014 GOLD RESERVE AND RESOURCE ESTIMATES(5)
(3) Refer to endnote #3.
(5) Refer to endnote #5.
40. www.kinross.com
40
• Paracatu is among the world’s largest gold operations
with annual throughput of ~60Mt
• Achieved record annual production in 2014
AMERICAS
PARACATU, BRAZIL (100%)
TONNES
(thousands)
GRADE
(g/t)
OUNCES
(thousands)
2P Reserves 749,125 0.44 10,510
M&I Resources 291,285 0.32 3,002
Inferred Resources 2,283 0.31 22
FY 2014
YTD Q3
2015
Production (Au. Eq. oz.) 521,026 364,115
Production cost of sales ($/oz.) $816 $777
Large gold mine with a long mine life that extends to 2030
OPERATING RESULTS(3)
2014 GOLD RESERVE AND RESOURCE ESTIMATES(5)
(3) Refer to endnote #3.
(5) Refer to endnote #5.
41. www.kinross.com
41
• New team focused on improving operating efficiencies
and reducing costs
• Record annual production in 2014
AMERICAS
MARICUNGA, CHILE (100%)
TONNES
(thousands)
GRADE
(g/t)
OUNCES
(thousands)
2P Reserves 66,687 0.78 1,670
M&I Resources 195,462 0.64 3,996
Inferred Resources 57,439 0.58 1,065
FY 2014
YTD Q3
2015
Production (Au. Eq. oz.) 247,216 157,207
Production cost of sales ($/oz.) $953 $1,037
High-altitude heap leach operation located in the highly prospective Maricunga District
OPERATING RESULTS(3)
2014 GOLD RESERVE AND RESOURCE ESTIMATES(5)
(3) Refer to endnote #3.
(5) Refer to endnote #5.
42. www.kinross.com
42
• High-grade, low-cost underground mines
• Dvoinoye is the 4th mine Kinross has operated in its
20-year history in the region
RUSSIA
KUPOL-DVOINOYE (100%)
KUPOL
TONNES
(thousands)
GRADE
(g/t)
OUNCES
(thousands)
2P Reserves 7,616 8.53 2,089
M&I Resources 386 15.97 198
Inferred Resources 474 12.55 191
DVOINOYE
2P Reserves 2,137 14.97 1,028
M&I Resources 118 9.94 38
Inferred Resources 122 12.10 47
FY 2014 YTD Q3 2015
Production (Au. Eq. oz.) 751,101 567,255
Production cost of sales ($/oz.) $507 $477
OPERATING RESULTS(3)
2014 GOLD RESERVE AND RESOURCE ESTIMATES(5)
Our Russian operations are a model for successfully operating in a remote location
(3) Refer to endnote #3.
(5) Refer to endnote #5.
43. www.kinross.com
43
• Achieved record annual production in 2014
• Continuing effort to reduce operating costs at existing
operation
WEST AFRICA
TASIAST, MAURITANIA (100%)
TONNES
(thousands)
GRADE
(g/t)
OUNCES
(thousands)
2P Reserves 161,822 1.77 9,196
M&I Resources 85,573 1.14 3,148
Inferred Resources 8,951 1.71 492
FY 2014
YTD Q3
2015
Production (Au. Eq. oz.) 260,485 165,339
Production cost of sales ($/oz.) $998 $1,042
Operating mine with a large gold resource located in a prospective district
OPERATING RESULTS(3)
2014 GOLD RESERVE AND RESOURCE ESTIMATES(5)
(3) Refer to endnote #3.
(5) Refer to endnote #5.
44. www.kinross.com
44
• Chirano is now among our lowest cost operations
following transition to self-perform mining in open pits
and underground
WEST AFRICA
CHIRANO, GHANA (90%)
TONNES
(thousands)
GRADE
(g/t)
OUNCES
(thousands)
2P Reserves 12,055 2.38 924
M&I Resources 15,356 2.46 1,214
Inferred Resources 1,204 3.43 133
FY 2014
YTD Q3
2015
Production (Au. Eq. oz.) 257,888 178,178
Production cost of sales ($/oz.) $591 $675
Cost reductions achieved at Chirano through transition to self-perform mining
OPERATING RESULTS(2,3)
2014 GOLD RESERVE AND RESOURCE ESTIMATES(5)
(2) Refer to endnote #2.
(3) Refer to endnote #3.
(5) Refer to endnote #5.
45. www.kinross.com
45
OPERATION
PRODUCTION
(Au eq. oz.)
PRODUCTION COST OF SALES(3)
($ per Au eq. oz.)
Fort Knox 379,453 $712
Round Mountain (50%) 169,839 $855
Kettle River – Buckhorn 123,382 $678
Paracatu 521,026 $816
Maricunga 247,216 $953
AMERICAS TOTAL 1,440,916 $804
Kupol-Dvoinoye 751,101 $507
RUSSIA TOTAL 751,101 $507
Tasiast 260,485 $998
Chirano (90%)(2) 257,888 $591
WEST AFRICA TOTAL 518,373 $795
KINROSS TOTAL 2,710,390 $720
OPERATIONAL EXCELLENCE
FY2014 OPERATING RESULTS
(2) Refer to endnote #2.
(3) Refer to endnote #3.
46. www.kinross.com
46
PRE-FEASIBILTY STUDY RESULTS
LA COIPA PROJECT
Life of Mine Estimates
Mill throughput capacity 13,000 tonnes per day
Average mining rate 80,000 tonnes per day
Average gold grade 1.69 g/t
Average silver grade 61.5 g/t
Average gold recovery 76%
Average silver recovery 59%
Strip ratio (waste:ore) 5.0
• The pre-feasibility study estimates a 5.5 year mine life, following receipt of permits and
commencement of stripping
Processing expected to commence 1.5 years after pre-stripping has been initiated and continue
for 4 years
Assumptions
Gold price $1,200 per oz.
Silver price $17 per oz.
Oil price $65 per barrel
Chilean Peso 600 to the US dollar
Discount rate 5%
KEY ASSUMPTIONSADDITIONAL OPERATING METRICS
$1,100 $1,200 $1,300
IRR 15% 20% 26%
GOLD PRICE SENSITIVITY
47. www.kinross.com
47
EXPLANATORY NOTES: EXPLORATION
Kupol & Dvoinoye Exploration Results
All 28 drill holes in 2014 at Providence were diamond drill core holes (HQ or NQ core diameter). The Providence vein dips sub-vertically, therefore,
drill holes are angled between minus 50° and 75° to the east and west.
The composite intervals reported for Providence diamond drill core are selected mainly by geological parameters but some of the intervals are
included taking into account the elevated Au and Ag values of the assay data. The intervals are calculated by taking a weighted average of all gold
and silver fire assay values included. No more than three consecutive metres of internal waste (<1 grams per tonne) is accepted. High grade
samples are not excluded from the calculation. All composite assay intervals are reported as down-hole widths and are not considered true
thickness.
Results reported for September Northeast (NE) are from 81 diamond drill core holes completed during 2014 and 38 surface trenches (stripped
pavement).
Composite assay intervals reported for September NE diamond drill core results are calculated by taking a weighted average of all gold fire assay
values equal to or above 2.0 gram per tonne gold. No more than three consecutive metres of internal waste (<2.0 grams per tonne) is accepted,
high grade samples are not cut. True widths are estimated to be on average greater than 80% of the drilled intercept.
Results for the exploration drill campaign are reported as Au grams per tonne (Au g/t), Ag grams per tonne (Ag g/t) and as Au Equivalent grams
per tonne (Au Eq g/t). Au Eq is calculated using Ag g/t / 63.64 and added to the Au g/t assay result.
Abbreviations used are:
NSI - No Significant Intersection;
BDL - Below Detection Limit;
TNS - Trench Not sampled
The reader is referred to the Kupol NI 43-101 Technical Report dated May 9, 2011, available under the Company’s profile at www.sedar.com, for a
full description of drilling methods, sampling procedures and QA/QC protocols. Samples from Providence and September NE are prepared and
analyzed by fire assay using a 50 gram charge with a gravimetric finish at the Kupol mine site analytical laboratory in compliance with industry
standards. Field duplicate samples are taken and blanks and standards are added to every batch submitted.
The technical information about the Company’s drilling and exploration activities at Kupol and Dvoinoye contained in this news release has been
prepared under the supervision of and verified by Mr. Sylvain Guerard, an officer with the Company who is a “qualified person” within the meaning
of National Instrument 43-101. The drill hole data base including collar, survey, geology and assay information were reviewed by the “qualified
person” and the composite assay information independently calculated and verified for accuracy of reporting. Assay certificates for the information
disclosed in this news release were verified by the Regional Director Exploration, Russia, but not by Mr. Guerard as the “qualified person”.
48. www.kinross.com
48
EXPLANATORY NOTES: EXPLORATION
Tasiast Exploration Results
Drill hole identifiers ending with suffix DD are diamond drill core holes (HQ diameter) and those ending with suffix RC are reverse circulation
(RC) holes. Holes with “A” prefixing DD or RC are diamond core or reverse circulation re-drills of the original hole where significant deviation
would have resulted in that hole missing the intended target.
Results provided for Tasiast include all exploration drill holes for which assay results were available from Tamaya at the time of preparation of
this news release. Composite assay intervals reported for exploration drilling at Tasiast are calculated by taking a weighted average of all gold
fire assay values equal to or above 0.3 g/t gold. No more than three consecutive metres of internal waste (<0.3 g/t gold) are accepted and high
grade samples are cut to 20 grams per tonne gold. All assay intervals are reported as down-hole widths. True widths are estimated to be on
average greater than 90% of the drilled intercept.
Composite intervals for reconnaissance reverse circulation holes are calculated by applying a 0.3 gram per tonne cut-off, no more than 6 metres
of internal waste and no top cut. All assay intervals are reported as down-hole thicknesses. There is insufficient information on all targets to
provide estimates of true thickness.
The reader is referred to the Tasiast NI 43-101 Technical Report dated March 31, 2014, available under the Company’s profile at
www.sedar.com, for a full description of drilling methods, sampling procedures and QA/QC protocols. Samples from Tasiast are prepared and
analyzed by fire assay using a 50 gram charge with an AAS finish at ALS (Tasiast mine site, Johannesburg, South Africa and Vancouver,
Canada) in compliance with industry standards. Field duplicate samples are taken and blanks and standards are added to every batch
submitted. Selected samples from this lab are check assayed each month at other ALS and third party commercial laboratories worldwide.
The technical information about the Company’s drilling and exploration activities at Tasiast contained in this news release has been prepared
under the supervision of and verified by Mr. Sylvain Guerard, an officer with the Company who is a “qualified person” within the meaning of
National Instrument 43-101. The drill hole data base including collar, survey, geology and assay information were reviewed by the “qualified
person” and the composite assay information independently calculated and verified for accuracy of reporting. Assay certificates for the
information disclosed in this news release were verified by the Regional Director Exploration, Africa, but not by Mr. Guerard as the “qualified
person”.
49. www.kinross.com
49
ENDNOTES
1) For more information regarding Kinross’ production, cost and capital expenditures outlook for 2015, please refer to the
news releases dated February 10, 2015 and September 17, 2015, available on our website at www.kinross.com.
Kinross’ outlook for 2015 represents forward-looking information and users are cautioned that actual results may vary.
Please refer to the risks and assumptions contained in the Cautionary Statement on Forward-Looking Information on
slide 2 of this presentation.
2) Unless otherwise noted, gold equivalent production, gold equivalent ounces sold and production cost of sales figures
in this presentation are based on Kinross’ 90% share of Chirano production and sales.
3) Attributable production cost of sales per gold equivalent ounce sold and per gold ounce on a by-product basis are non-
GAAP measures. For more information and a reconciliation of this non-GAAP measure for the three months and nine
months ended September 30, 2015 and 2014, please refer to the news release dated November 10, 2015, under the
heading “Reconciliation of non-GAAP financial measures”, available on our website at www.kinross.com.
4) All-in sustaining cost is a non-GAAP measure. For more information and a reconciliation of this non-GAAP measure
for the three months and nine months ended September 30, 2015 and 2014, please refer to the news release dated
November 10, 2015 under the heading “Reconciliation of non-GAAP financial measures”, available on our website at
www.kinross.com.
5) For more information regarding Kinross’ mineral reserves and mineral resources, please refer to our Annual Mineral
Reserve and Mineral Resource Statement as at December 31, 2014 contained in our news release dated February 10,
2015, which is available on our website at www.kinross.com.