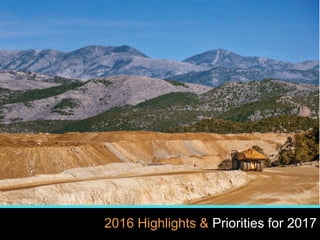
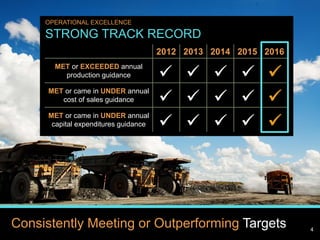
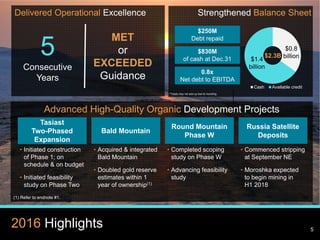
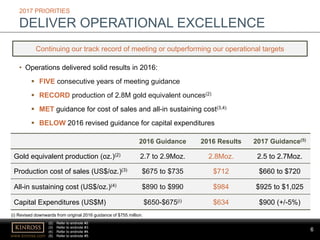
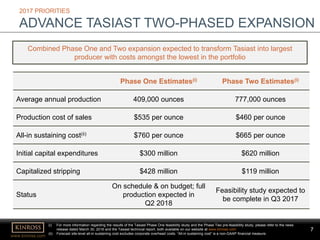
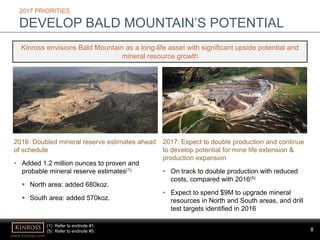
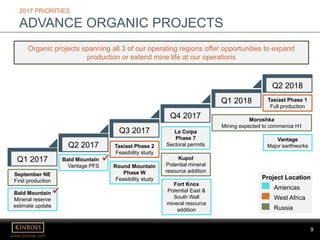
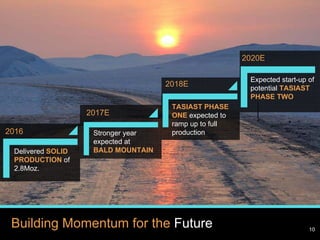
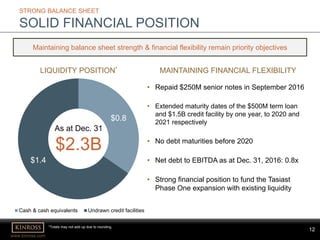
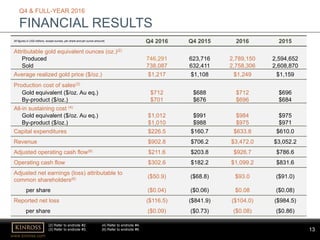
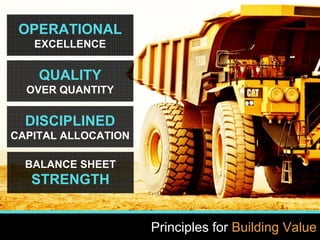
This document provides a summary of Kinross Gold Corporation's Q4 and full-year 2016 results conference call. It discusses 2016 highlights including meeting or exceeding guidance for the fifth consecutive year. Priorities for 2017 include continuing operational excellence, advancing the two-phased expansion at Tasiast, developing Bald Mountain's potential, and advancing organic projects. The document also provides Kinross' 2017 guidance figures and discusses its strong balance sheet and financial discipline.
2. 2
www.kinross.com
2
CAUTIONARY STATEMENT ON FORWARD-LOOKING
INFORMATION
All statements, other than statements of historical fact, contained or incorporated by reference in or made in giving this presentation and responses to questions,
including but not limited to any information as to the future performance of Kinross, constitute “forward looking statements” within the meaning of applicable securities
laws, including the provisions of the Securities Act (Ontario) and the provisions for “safe harbour” under the United States Private Securities Litigation Reform Act of
1995 and are based on expectations, estimates and projections as of the date of this presentation. Forward-looking statements contained in this presentation include
those statements on slides with, and statements made under, the headings “2017 Priorities”, “Building Momentum for the Future”, “Strong Balance Sheet”, “2017
Outlook”, “2017 Capital Expenditures Outlook”, “High-Quality Development Projects”, “Exploration”, and “Principles for Building Value”, and include without limitation
statements with respect to our guidance for production, production costs of sales, all-in sustaining cost and capital expenditures, continuous improvement and other
cost savings opportunities, as well as references to other possible events include, without limitation, possible events; opportunities; statements with respect to
possible events or opportunities; estimates (including, without limitation, gold / mineral resources, gold / mineral reserves and mine life) and the realization of such
estimates; future development, mining activities, production and growth, including but not limited to cost and timing; success of exploration or development of
operations; the future price of gold and silver; currency fluctuations; expected capital requirements; government regulation; and environmental risks. The words
“2017E”, “2018E”, “2020E”, “ahead”, “aim”, “anticipate”, “assumption”, “believe”, “budget”, “contemplate”, “contingent”, “encouraged”, “enhancing”, “envision”,
“estimate”, “expect”, “explore”, “feasibility”, “flexibility”, “focus”, “forecast”, “forward”, “FS”, “future”, “goal”, “growth”, “guidance”, “initiative”, “indicate”, “intend”,
“liquidity”, “model”, “momentum”, “objective”, “on track”, “opportunity”, “optimize”, “option”, “outlook”, “PFS”, “phased”, “plan”, “positive”, “positioned”, “possible”,
“potential”, “principle”, “pre-feasibility”, “priority”, “progressing”, “project”, “risk”, “strategy”, “study”, “target”, “tracking”, “trend”, “upside” or “view”, or variations of or
similar such words and phrases or statements that certain actions, events or results may, can, could, would, should, might, indicates, or will be taken, and similar
expressions identify forward looking statements. Forward-looking statements are necessarily based upon a number of estimates and assumptions that, while
considered reasonable by Kinross as of the date of such statements, are inherently subject to significant business, economic and competitive uncertainties and
contingencies. Statements representing management’s financial and other outlook have been prepared solely for purposes of expressing their current views
regarding the Company’s financial and other outlook and may not be appropriate for any other purpose. Many of these uncertainties and contingencies can affect,
and could cause, Kinross’ actual results to differ materially from those expressed or implied in any forward looking statements made by, or on behalf of, Kinross.
There can be no assurance that forward looking statements will prove to be accurate, as actual results and future events could differ materially from those anticipated
in such statements. All of the forward looking statements made in this presentation are qualified by these cautionary statements, and those made in our filings with
the securities regulators of Canada and the U.S., including but not limited to those cautionary statements made in the “Risk Factors” section of our most recently filed
Annual Information Form, the “Risk Analysis” section of our FYE 2016 Management’s Discussion and Analysis, and the “Cautionary Statement on Forward-Looking
Information” in our news releases dated February 15, 2017, to which readers are referred and which are incorporated by reference in this presentation, all of which
qualify any and all forward‐looking statements made in this presentation. These factors are not intended to represent a complete list of the factors that could affect
Kinross. Kinross disclaims any intention or obligation to update or revise any forward‐looking statements or to explain any material difference between subsequent
actual events and such forward‐looking statements, except to the extent required by applicable law.
Other information
Where we say "we", "us", "our", the "Company", or "Kinross" in this presentation, we mean Kinross Gold Corporation and/or one or more or all of its subsidiaries, as
may be applicable.
The technical information about the Company’s mineral properties contained in this presentation has been prepared under the supervision of Mr. John Sims, an
officer of the Company who is a “qualified person” within the meaning of National Instrument 43-101.
4. 4
www.kinross.com
4
OPERATIONAL EXCELLENCE
STRONG TRACK RECORD
2012 2013 2014 2015 2016
MET or EXCEEDED annual
production guidance
MET or came in UNDER annual
cost of sales guidance
MET or came in UNDER annual
capital expenditures guidance
Consistently Meeting or Outperforming Targets 4
5. 5
www.kinross.com
5
Advanced High-Quality Organic Development Projects
5
Consecutive
Years
MET
or
EXCEEDED
Guidance
Delivered Operational Excellence
$250M
Debt repaid
Cash Available credit
$830M
of cash at Dec.31
0.8x
Net debt to EBITDA
Strengthened Balance Sheet
$0.8
billion
$1.4
billion
2016 Highlights 5
Tasiast
Two-Phased
Expansion
• Initiated construction
of Phase 1; on
schedule & on budget
• Initiated feasibility
study on Phase Two
Bald Mountain
• Acquired & integrated
Bald Mountain
• Doubled gold reserve
estimates within 1
year of ownership(1)
• Completed scoping
study on Phase W
• Advancing feasibility
study
• Commenced stripping
at September NE
• Moroshka expected
to begin mining in
H1 2018
Round Mountain
Phase W
Russia Satellite
Deposits
(1) Refer to endnote #1.
$2.3B
*Totals may not add up due to rounding.
6. 6
www.kinross.com
6
2016 Guidance 2016 Results 2017 Guidance(5)
Gold equivalent production (oz.)(2) 2.7 to 2.9Moz. 2.8Moz. 2.5 to 2.7Moz.
Production cost of sales (US$/oz.)(3) $675 to $735 $712 $660 to $720
All-in sustaining cost (US$/oz.)(4) $890 to $990 $984 $925 to $1,025
Capital Expenditures (US$M) $650-$675(i) $634 $900 (+/-5%)
2017 PRIORITIES
DELIVER OPERATIONAL EXCELLENCE
• Operations delivered solid results in 2016:
FIVE consecutive years of meeting guidance
RECORD production of 2.8M gold equivalent ounces(2)
MET guidance for cost of sales and all-in sustaining cost(3,4)
BELOW 2016 revised guidance for capital expenditures
Continuing our track record of meeting or outperforming our operational targets
(2) Refer to endnote #2.
(3) Refer to endnote #3.
(4) Refer to endnote #4.
(5) Refer to endnote #5.
(i) Revised downwards from original 2016 guidance of $755 million.
7. 7
www.kinross.com
7
2017 PRIORITIES
ADVANCE TASIAST TWO-PHASED EXPANSION
Combined Phase One and Two expansion expected to transform Tasiast into largest
producer with costs amongst the lowest in the portfolio
Phase One Estimates(i) Phase Two Estimates(i)
Average annual production 409,000 ounces 777,000 ounces
Production cost of sales $535 per ounce $460 per ounce
All-in sustaining cost(ii) $760 per ounce $665 per ounce
Initial capital expenditures $300 million $620 million
Capitalized stripping $428 million $119 million
Status
On schedule & on budget; full
production expected in
Q2 2018
Feasibility study expected to
be complete in Q3 2017
(i) For more information regarding the results of the Tasiast Phase One feasibility study and the Phase Two pre-feasibility study, please refer to the news
release dated March 30, 2016 and the Tasiast technical report, both available on our website at www.kinross.com
(ii) Forecast site-level all-in sustaining cost excludes corporate overhead costs. “All-in sustaining cost” is a non-GAAP financial measure.
8. 8
www.kinross.com
8
2017 PRIORITIES
DEVELOP BALD MOUNTAIN’S POTENTIAL
2016: Doubled mineral reserve estimates ahead
of schedule
• Added 1.2 million ounces to proven and
probable mineral reserve estimates(1)
North area: added 680koz.
South area: added 570koz.
Kinross envisions Bald Mountain as a long-life asset with significant upside potential and
mineral resource growth
2017: Expect to double production and continue
to develop potential for mine life extension &
production expansion
• On track to double production with reduced
costs, compared with 2016(5)
• Expect to spend $9M to upgrade mineral
resources in North and South areas, and drill
test targets identified in 2016
(1) Refer to endnote #1.
(5) Refer to endnote #5.
9. 9
www.kinross.com
9
2017 PRIORITIES
ADVANCE ORGANIC PROJECTS
September NE
First production
Organic projects spanning all 3 of our operating regions offer opportunities to expand
production or extend mine life at our operations
Q2 2018
Q1 2017
Q2 2017
Q3 2017
Q4 2017
Q1 2018
Bald Mountain
Mineral reserve
estimate update
Bald Mountain
Vantage PFS
Tasiast Phase 2
Feasibility study
La Coipa
Phase 7
Sectoral permits
Moroshka
Mining expected to commence H1
Tasiast Phase 1
Full production
Project Location
Americas
West Africa
Russia
Round Mountain
Phase W
Feasibility study
Vantage
Major earthworks
Kupol
Potential mineral
resource addition
Fort Knox
Potential East &
South Wall
mineral resource
addition
10. 10
www.kinross.com
10
Delivered SOLID
PRODUCTION of
2.8Moz.
2016 Stronger year
expected at
BALD MOUNTAIN
2017E
TASIAST PHASE
ONE expected to
ramp up to full
production
2018E
Expected start-up of
potential TASIAST
PHASE TWO
2020E
Building Momentum for the Future 10
12. 12
www.kinross.com
12
STRONG BALANCE SHEET
SOLID FINANCIAL POSITION
$0.8
$1.4
Cash & cash equivalents Undrawn credit facilities
LIQUIDITY POSITION*
Maintaining balance sheet strength & financial flexibility remain priority objectives
MAINTAINING FINANCIAL FLEXIBILITY
• Repaid $250M senior notes in September 2016
• Extended maturity dates of the $500M term loan
and $1.5B credit facility by one year, to 2020 and
2021 respectively
• No debt maturities before 2020
• Net debt to EBITDA as at Dec. 31, 2016: 0.8x
• Strong financial position to fund the Tasiast
Phase One expansion with existing liquidity
As at Dec. 31
$2.3B
*Totals may not add up due to rounding.
13. 13
www.kinross.com
13
Q4 & FULL-YEAR 2016
FINANCIAL RESULTS
All figures in US$ millions, except ounces, per share and per ounce amounts Q4 2016 Q4 2015 2016 2015
Attributable gold equivalent ounces (oz.)(2)
Produced 746,291 623,716 2,789,150 2,594,652
Sold 738,087 632,411 2,758,306 2,608,870
Average realized gold price ($/oz.) $1,217 $1,108 $1,249 $1,159
Production cost of sales(3)
Gold equivalent ($/oz. Au eq.) $712 $688 $712 $696
By-product ($/oz.) $701 $676 $696 $684
All-in sustaining cost (4)
Gold equivalent ($/oz. Au eq.) $1,012 $991 $984 $975
By-product ($/oz.) $1,010 $988 $975 $971
Capital expenditures $226.5 $160.7 $633.8 $610.0
Revenue $902.8 $706.2 $3,472.0 $3,052.2
Adjusted operating cash flow(6) $211.6 $203.8 $926.7 $786.6
Operating cash flow $302.6 $182.2 $1,099.2 $831.6
Adjusted net earnings (loss) attributable to
common shareholders(6) ($50.9) ($68.8) $93.0 ($91.0)
per share ($0.04) ($0.06) $0.08 ($0.08)
Reported net loss ($116.5) ($841.9) ($104.0) ($984.5)
per share ($0.09) ($0.73) ($0.08) ($0.86)
(2) Refer to endnote #2.
(3) Refer to endnote #3.
(4) Refer to endnote #4.
(6) Refer to endnote #6.
14. 14
www.kinross.com
14
2017 OUTLOOK
REDUCED OVERHEAD(i)
$208
$171 $165
2015 2016 2017E
Overhead Expense
(US$ millions)
• 18% REDUCTION in overhead
expense versus 2015
• Trend continues in 2017:
Overhead expense expected
to be US$165 million(5)
(i) Overhead expense consists of general and administrative and business development expense.
(5) Refer to endnote #5.
Continued focus on financial discipline
(5)
15. 15
www.kinross.com
15
FINANCIAL DISCIPLINE
2017 CAPITAL EXPENDITURES OUTLOOK(5)
Region Sustaining Non-Sustaining Regional Total
Americas $295 $65 $360
West Africa $80 $375 $455
Russia $40 $15 $55
Corporate $5 - $5
TOTAL $420 $455 $875
Capitalized Interest $25
TOTAL KINROSS $900 +/- 5%
Leveraging strong financial position to invest in development projects & our future
2017E Capital Expenditures ($ millions)
(5) Refer to endnote #5.
16. 16
www.kinross.com
16
2017 OUTLOOK
CURRENCY & OIL BENEFITS
Well-positioned to benefit from favourable currency exchange and oil weakness
Change from
Assumptions
Estimated impact
to cost of sales
FX 10% US$15/oz.
Russian rouble 10% US$16/oz.(ii)
Brazilian real 10% US$32/oz.(iii)
Oil $10/bbl. US$2/oz.
Gold price $100/oz. US$4/oz.
Budget Spot(i)
Gold US$1,200 $1,232
Oil US$60/bbl. $17.97
Russian rouble 60 53
Brazilian real 3.25 3.05
Chilean peso 630 639
2017 Budget Assumptions & Sensitivities(5)
• Benefits of favourable FX and oil prices
partially offsetting lower gold prices
20
30
40
50
60
70
80
90
100
110
Jun-14 Oct-14 Feb-15 Jun-15 Oct-15 Feb-16 Jun-16 Oct-16 Feb-17
Performance(rebasedto100)
Brazilian real Russian rouble Canadian dollar Oil Gold
(i) Source: Bloomberg – February 15, 2017.
(ii) Impact to production cost of sales of the Russian operations
(iii) Impact to production cost of sales of the Brazil operation
(5) Refer to endnote #5.
17. 17
www.kinross.com
17
FINANCIAL DISCIPLINE
FUEL & CURRENCY HEDGES
Managing exposure to fluctuations in foreign currency and input commodity prices
% of 2017 exposure hedged Average Rate
Brazilian real 35% 3.68 (put) - 4.11 (call)
Chilean peso - -
Russian rouble 19% 60 (put) – 72 (call)
Canadian dollar 51% 1.33
Oil & Fuel 54%(i) (Refer to note ii)
(i) As a result of pre-paid fuel purchases mainly relating to the Company’s Russian operations and fixed pricing in Ghana and Brazil, Kinross’ unhedged, free-
floating oil & fuel exposure for 2017 is ~31% of total consumption
(ii) Consists of crude oil swap contracts (737,976 barrels at an average rate of $46.21) as at December 31, 2016.
Summary of 2017 foreign currency and energy hedges as at December 31, 2016
• Decided to hedge rouble for first time since 2013
Entered into zero cost option hedge for approximately 20% of exposure at average
put of 60, offset by call strike of 72
• Also hedged 35% of Brazilian real at favourable rates compared to spot
19. 19
www.kinross.com
19
Bald Mountain
2017E GOLD EQUIVALENT
PRODUCTION(2,5)
OPERATING HIGHLIGHTS
DIVERSIFIED PORTFOLIO OF OPERATING MINES
GLOBAL PORTFOLIO
Operating mine
Development project
Round Mountain
Fort Knox
La Coipa
Paracatu
Kupol
Dvoinoye
Chirano
Tasiast
AMERICASRUSSIA
WEST AFRICA
(3) Refer to endnote #3.
Over 60% of estimated 2017 gold equivalent production from mines located in the Americas
61%17%
22%
Americas West Africa Russia
2.5-2.7M
ounces
(2) Refer to endnote #2.
(5) Refer to endnote #5.
20. 20
www.kinross.com
20
OPERATING HIGHLIGHTS
AMERICAS
• Continued strong performance expected at FORT KNOX
and ROUND MOUNTAIN
• Production expected to double at BALD MOUNTAIN with
lower costs
• Production expected to be heavily weighted towards
H2 2017, due to mining sequence & lag between
stacked and recovered ounces from the heap leach
• KETTLE-RIVER BUCKHORN production now expected
to extend through Q1 2017
• PARACATU better positioned to withstand low rainfall
• Result of successful mitigation initiatives
implemented in 2016
2016 Results 2017 Regional Guidance(5)
Production (oz. Au eq.) 1,689,072 1.52 – 1.63 million
Cost of sales ($/oz. Au eq.)(3) $774 $680 to $750
(3) Refer to endnote #3.
(5) Refer to endnote #5.
21. 21
www.kinross.com
21
OPERATING HIGHLIGHTS
WEST AFRICA
• CHIRANO successfully transitioned from
Awkaaba to Paboase
Hitting tonnage goals
Grades and production increased in Q4 2016
• Strong performance at TASIAST in Q4 2016
Increased production a result of improved
throughput and higher grade
Expect positive trend to continue in 2017
(2) Refer to endnote #2.
(3) Refer to endnote #3.
(5) Refer to endnote #5.
2016 Results 2017 Regional Guidance(5)
Production (oz. Au eq.)(2) 365,935 420,000 to 470,000
Cost of sales ($/oz. Au eq.)(3) $988 $740 to $820
22. 22
www.kinross.com
22
OPERATING HIGHLIGHTS
RUSSIA
KUPOL-DVOINOYE
• Consistent, strong performance from
Russian operations in 2016
• Commenced stripping September
Northeast; project on time and on budget
• Filter cake plant expected to be fully
operational in Q1 2017
Provides additional tailings capacity
for the current mine plan and
provides flexibility for further mine life
extensions
2016 Results 2017 Regional Guidance(5)
Production (oz. Au eq.) 734,143 560,000 to 600,000
Cost of sales ($/oz. Au eq.)(3) $441 $520 to $570
(3) Refer to endnote #3.
(5) Refer to endnote #5.
24. 24
www.kinross.com
24
HIGH-QUALITY ORGANIC DEVELOPMENT PROJECTS
TASIAST TWO-PHASED EXPANSION
Phase One progressing well
• Engineering and procurement of all equipment
packages mostly complete
• Poured foundations for SAG mill & primary
crusher
• Closing off tailings dam and proceeding with liner
installation, ahead of schedule
• Major components of SAG mill & primary crusher
arrived at site; installation of SAG mill expected to
begin late February
Phase Two
• Feasibility study is expected to be complete
in Q3 2017
Phase One construction ~20% complete; on track for full production in Q2 2018
Reclaim tunnel with SAG mill in
the background
25. 25
www.kinross.com
25
HIGH-QUALITY ORGANIC DEVELOPMENT PROJECTS
TASIAST PHASE ONE PROGRESSING WELL
Phase One on schedule and on budget with full production expected in Q2 2018
Unloading SAG mill shell
New batch plant in operationSAG mill
Installation of tailings pond liner
26. 26
www.kinross.com
26
HIGH-QUALITY ORGANIC DEVELOPMENT PROJECTS
DOUBLED BALD MOUNTAIN GOLD RESERVES
Successfully doubled gold reserve estimates for Bald Mountain ahead of schedule
2,133
(229)
+677
+568
1,117
Year-end 2015 Year-end 2016
North area
South area
2016 depletion
Proven&ProbableMineralReserveEstimates(1)
(thousandounces)
(1) Refer to endnote #1.
27. 27
www.kinross.com
27
HIGH-QUALITY ORGANIC DEVELOPMENT PROJECTS
BALD MOUNTAIN VANTAGE COMPLEX
Vantage Complex (South area) Pre-Feasibility Study
• Contemplates construction of a new heap leach facility
and related infrastructure to develop Vantage Complex
Combined 28 million tonnes of ore at average
grade of 0.63 g/t
Design includes additional 34M tonnes of capacity
for future potential deposits in the South area
• Estimated capital expenditures: $90-120M
• Major works expected to begin in early Q2 2018
www.kinross.com
27
As at December 31, 2016
Proven & probable gold reserves 568koz.
Measured & indicated gold resources 474koz.
Inferred gold resources 40koz.
South Area: Mineral Reserve & Mineral Resource Estimates(1)
(1) Refer to endnote #1.
28. 28
www.kinross.com
28
HIGH-QUALITY ORGANIC DEVELOPMENT PROJECTS
RUSSIA SATELLITE DEPOSITS
September Northeast
• Located approximately 15 km northwest from
Dvoinoye
• Near-surface, high-grade deposit
• Stripping commenced and project is on-track to
begin production in Q1 2017
Development of satellite deposits located near Kupol and Dvoinoye in advanced stages
Moroshka
• Located 4 km east of the Kupol mill
• Decline development and installation of
limited surface infrastructure underway
• Portal construction 30% complete
• Mining expected to commence in H1 2018
29. 29
www.kinross.com
29
HIGH-QUALITY ORGANIC DEVELOPMENT PROJECTS
ROUND MOUNTAIN PHASE W
Year-end 2015 Depletion Exploration & Engineering Year-end 2016
Proven & probable
gold reserves
1,470 (315) 112 1,267
Measured & indicated
gold resources
683 (35) 1,284 1,932
Inferred gold resources 233 (30) 1,660 1,863
Mineral Reserve & Mineral Resource Estimates(1) (thousand ounces)
• Drill program in support of the Phase W feasibility study ongoing during fourth quarter
• Additional activities underway:
Mine plan optimization
Geologic modelling
Metallurgical and geotechnical test work
Engineering of infrastructure
• Feasibility study expected to be complete in Q3 2017
Phase W is an opportunity to potentially extend estimated mine life
(1) Refer to endnote #1.
30. 30
www.kinross.com
30
EXPLORATION
KUPOL VEIN SYSTEM
Mineralization open in in certain zones, with greatest potential for near-term extensions to
the north and south
• Comprehensive exploration review generated series of extension targets which were drilled
during second half of 2016
• Continued drilling, geological interpretation and mineral resource estimation for these target
areas will be a major focus for 2017
For additional information, please see Kinross’ news release dated February 15, 2017 and Appendices A and B, which are available on our website at
www.kinross.com, as well as the Explanatory Notes available on slide 33 of this presentation.
Big Bend
650 SE Extension
North Extension/Star
1 km
~1.8 km Geochemical Anomaly
Looking West
0
>5
Au g/t
32. 32
www.kinross.com
32
ENDNOTES
1) Mineral reserves and mineral resources are estimates. For more information regarding Kinross’ 2016 mineral reserve
and mineral resource estimates, please refer to our Annual Mineral Reserve and Mineral Resource Statement as at
December 31, 2016 contained in our news release dated February 15, 2017, which is available on our website at
www.kinross.com.
2) Unless otherwise noted, gold equivalent production, gold equivalent ounces sold and production cost of sales figures
in this presentation are based on Kinross’ 90% share of Chirano production and sales.
3) Attributable production cost of sales per gold equivalent ounce sold and per gold ounce sold on a by-product basis are
non-GAAP measures. For more information and a reconciliation of this non-GAAP measure for the three and twelve
months ended December 31, 2016 and 2015, please refer to the news release dated February 15, 2017, under the
heading “Reconciliation of non-GAAP financial measures”, available on our website at www.kinross.com.
4) All-in sustaining cost is a non-GAAP measure. For more information and a reconciliation of this non-GAAP measure
for the three and twelve months ended December 31, 2016 and 2015, please refer to the news release dated February
15, 2017 under the heading “Reconciliation of non-GAAP financial measures”, available on our website at
www.kinross.com.
5) For more information regarding Kinross’ production, cost, overhead expense and capital expenditures outlook for
2017, please refer to the news release dated February 15, 2017 which is available on our website at
www.kinross.com. Kinross’ outlook for 2017 represents forward-looking information and users are cautioned that
actual results may vary. Please refer to the Cautionary Statement on Forward-Looking Information on slide 2 of this
presentation and in our news release dated February 15, 2017, available on our website at www.kinross.com.
6) Adjusted net earnings attributable to common shareholders and adjusted operating cash flow numbers are non-GAAP
financial measures. For more information and a reconciliation of these non-GAAP measures for the three and twelve
months ended December 31, 2016 and 2015, please refer to the news release dated February 15, 2017, under the
heading “Reconciliation of non-GAAP financial measures”, available on our website at www.kinross.com.
33. 33
www.kinross.com
33
EXPLANATORY NOTES - EXPLORATION
Kupol Exploration Results
A total of 48 diamond drill core holes are reported from Kupol Minex and mine-area exploration activity in 2016. All
diamond drill core holes reported are HQ in diameter. The majority of holes presented (18) were drilled at the Kupol
Hanging Wall target, with six holes reported from Big Bend Deep, 16 holes from the Zone 650 SE splays and eight from
the North Extension (Star) target.
Collar locations are reported in the Kupol Local Mine Grid.
Composite assay intervals reported for diamond drill core results are calculated by taking a weighted average of all gold
and silver fire assay values included. No more than three consecutive metres of internal waste (<1.0 grams per tonne of
Au equivalent) is accepted, and high grade samples are not capped. Select true widths are provided, estimated
according to the geometry and nature of the mineralized intersection.
The reader is referred to the Kupol & Dvoinoye National Instrument 43-101 Technical Report dated March 31, 2015,
available under the Company’s profile at www.sedar.com, for a full description of drilling methods, sampling procedures
and QA/QC protocols.
The technical information about the Company’s drilling and exploration activities at Kupol contained in this news release
has been prepared under the supervision of the Officer with the Company who is a “qualified person” within the
meaning of National Instrument 43-101. The drill hole data base including collar, survey, geology and assay information
were reviewed by the “qualified person” and the composite assay information independently calculated and verified for
accuracy of reporting. Assay certificates for the information disclosed in this news release were verified by the Regional
Director Exploration and the Site Exploration Manager but not by the Officer as the “qualified person”.