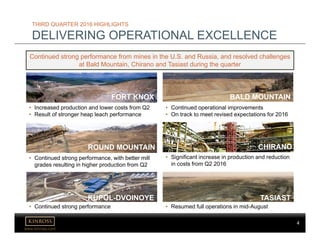
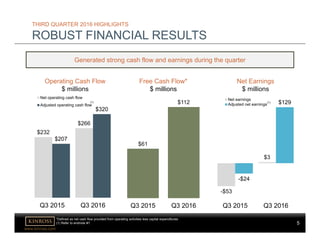
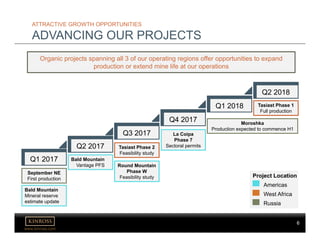
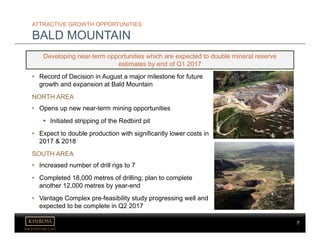
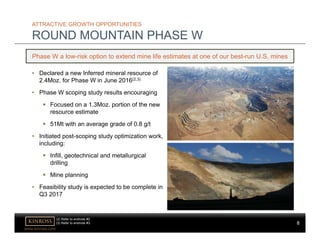
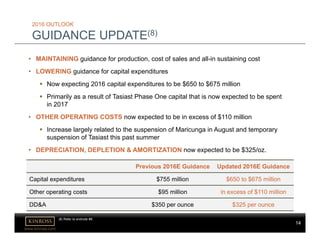
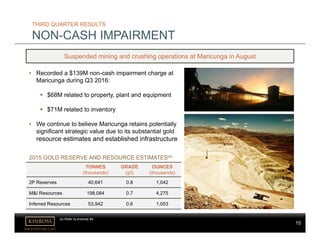
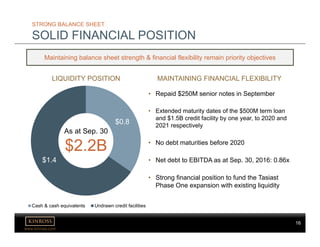
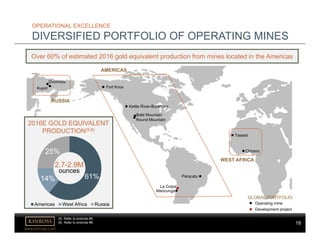
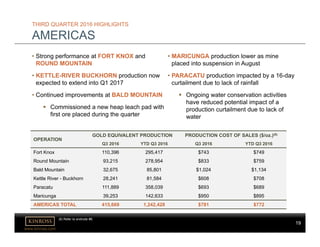
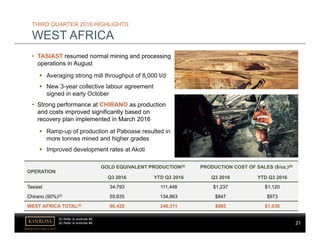
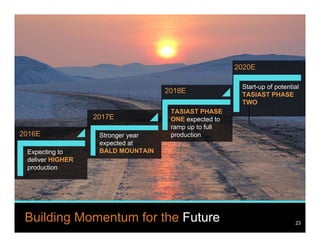
1
www.kinross.com
1
KINROSS GOLD CORPORATION
Q3 2016 Results Conference Call & Webcast
November 3
2016
2
www.kinross.com
2
CAUTIONARY STATEMENT ON FORWARD-LOOKING
INFORMATION
All statements, other than statements of historical fact, contained or incorporated by reference in or made in giving this presentation and responses to questions,
including but not limited to any information as to the future performance of Kinross, constitute “forward looking statements” within the meaning of applicable securities
laws, including the provisions of the Securities Act (Ontario) and the provisions for “safe harbour” under the United States Private Securities Litigation Reform Act of
1995 and are based on expectations, estimates and projections as of the date of this presentation. Forward-looking statements contained in this presentation include
those statements on slides with, and statements made under, the headings “2016 Production & Cost Outlook”, “Attractive Growth Opportunities”, “Guidance Update”,
and “Building Momentum for the Future”, and include without limitation statements with respect to our guidance for production, production costs of sales, all-in
sustaining cost and capital expenditures, project schedules, mine life, continuous improvement and other cost savings opportunities, as well as references and other
statements with respect to other possible events and opportunities, including, without limitation, estimates and the realization of such estimates (such as mineral or
gold reserves and resources, and mine life); future development, mining activities, production and growth (including but not limited to cost and timing); success of
exploration or development of operations; the future price of gold and silver; currency fluctuations; expected capital requirements; government regulation; and
environmental risks and proceedings. The words “2016E”, “anticipate”, “assumption”, “believe”, “encouraging”, “estimate”, “expect”, “explore”, “feasibility”, “flexibility”,
“focus”, “forecast”, “forward”, “future”, “guidance”, “objective”, “on track”, “opportunity”, “outlook”, “phased”, “plan”, “positioned”, “possible”, “potential”, “principles”,
“priority”, “project”, “risk”, “schedule”, “scoping”, “strategy”, “study”, or “target”, or variations of or similar such words and phrases, or statements that certain actions,
events or results may, can, could, would, should, might, occur or will be taken or realized, and similar expressions identify forward looking statements. Forward-
looking statements are necessarily based upon a number of estimates and assumptions that, while considered reasonable by Kinross as of the date of such
statements, are inherently subject to significant business, economic and competitive uncertainties and contingencies. Statements representing management’s
financial and other outlook have been prepared solely for purposes of expressing their current views regarding the Company’s financial and other outlook and may
not be appropriate for any other purpose. Many of these uncertainties and contingencies can affect, and could cause, Kinross’ actual results to differ materially from
those expressed or implied in any forward looking statements made by, or on behalf of, Kinross. There can be no assurance that forward looking statements will
prove to be accurate, as actual results and future events could differ materially from those anticipated in such statements. All of the forward looking statements made
in this presentation are qualified by these cautionary statements, and those made in our filings with the securities regulators of Canada and the U.S., including but not
limited to those cautionary statements made in the “Risk Factors” section of our most recently filed Annual Information Form, the “Risk Analysis” section of our FYE
2015 and Q3 2016 Management’s Discussion and Analysis, and the “Cautionary Statement on Forward-Looking Information” in our news release dated November 2,
2016, to which readers are referred and which are incorporated by reference in this presentation, all of which qualify any and all forward‐looking statements made in
this presentation. These factors are not intended to represent a complete list of the factors that could affect Kinross. Kinross disclaims any intention or obligation to
update or revise any forward‐looking statements or to explain any material difference between subsequent actual events and such forward‐looking statements,
except to the extent required by applicable law.
Other information
Where we say "we", "us", "our", the "Company", or "Kinross" in this presentation, we mean Kinross Gold Corporation and/or one or more or all of its subsidiaries, as
may be applicable.
The technical information about the Company’s mineral properties contained in this presentation (other than exploration activities) has been prepared under the
supervision of Mr. John Sims, an officer of the Company who is a “qualified person” within the meaning of National Instrument 43-101 (“NI 43-101”). The technical
information about the Company’s exploration activities contained in this presentation has been prepared under the supervision of Mr. Sylvain Guerard, an officer of
the Company who is a “qualified person” within the meaning of NI 43-101.
3
www.kinross.com
3
Q3 2016 Results Highlights 3
4
www.kinross.com
4
THIRD QUARTER 2016 HIGHLIGHTS
DELIVERING OPERATIONAL EXCELLENCE
Continued strong performance from mines in the U.S. and Russia, and resolved challenges
at Bald Mountain, Chirano and Tasiast during the quarter
• Increased production and lower costs from Q2
• Result of stronger heap leach performance
FORT KNOX
• Continued strong performance
KUPOL-DVOINOYE
• Continued operational improvements
• On track to meet revised expectations for 2016
BALD MOUNTAIN
• Significant increase in production and reduction
in costs from Q2 2016
CHIRANO
• Resumed full operations in mid-August
TASIAST
• Continued strong performance, with better mill
grades resulting in higher production from Q2
ROUND MOUNTAIN
5
www.kinross.com
5
THIRD QUARTER 2016 HIGHLIGHTS
ROBUST FINANCIAL RESULTS
Generated strong cash flow and earnings during the quarter
$232
$266
$207
$320
Q3 2015 Q3 2016
Net operating cash flow
Adjusted operating cash flow
Operating Cash Flow
$ millions
Net Earnings
$ millions
Free Cash Flow*
$ millions
$61
$112
Q3 2015 Q3 2016
-$53
$3
-$24
$129
Q3 2015 Q3 2016
Net earnings
Adjusted net earnings
*Defined as net cash flow provided from operating activities less capital expenditures
(1) Refer to endnote #1.
(1) (1)
6
www.kinross.com
6
ATTRACTIVE GROWTH OPPORTUNITIES
ADVANCING OUR PROJECTS
September NE
First production
Organic projects spanning all 3 of our operating regions offer opportunities to expand
production or extend mine life at our operations
Q2 2018
Q1 2017
Q2 2017
Q3 2017
Q4 2017
Q1 2018
Bald Mountain
Mineral reserve
estimate update
Bald Mountain
Vantage PFS
Tasiast Phase 2
Feasibility study
La Coipa
Phase 7
Sectoral permits
Moroshka
Production expected to commence H1
Tasiast Phase 1
Full production
Project Location
Americas
West Africa
Russia
Round Mountain
Phase W
Feasibility study
7
www.kinross.com
7
ATTRACTIVE GROWTH OPPORTUNITIES
BALD MOUNTAIN
• Record of Decision in August a major milestone for future
growth and expansion at Bald Mountain
NORTH AREA
• Opens up new near-term mining opportunities
 Initiated stripping of the Redbird pit
• Expect to double production with significantly lower costs in
2017 & 2018
SOUTH AREA
• Increased number of drill rigs to 7
• Completed 18,000 metres of drilling; plan to complete
another 12,000 metres by year-end
• Vantage Complex pre-feasibility study progressing well and
expected to be complete in Q2 2017
Developing near-term opportunities which are expected to double mineral reserve
estimates by end of Q1 2017
8
www.kinross.com
8
ATTRACTIVE GROWTH OPPORTUNITIES
ROUND MOUNTAIN PHASE W
Phase W a low-risk option to extend mine life estimates at one of our best-run U.S. mines
• Declared a new Inferred mineral resource of
2.4Moz. for Phase W in June 2016(2,3)
• Phase W scoping study results encouraging
 Focused on a 1.3Moz. portion of the new
resource estimate
 51Mt with an average grade of 0.8 g/t
• Initiated post-scoping study optimization work,
including:
 Infill, geotechnical and metallurgical
drilling
 Mine planning
• Feasibility study is expected to be complete in
Q3 2017
(2) Refer to endnote #2.
(3) Refer to endnote #3.
9
www.kinross.com
9
ATTRACTIVE GROWTH OPPORTUNITIES
LA COIPA PHASE 7
Advancing permitting and exploration activities at the La Coipa Phase 7 project
• Pre-feasibility study on La Coipa completed
during Q3 2015
• Continue to advance permitting
 Received approval on the project DIA
(Declaration of Impact to Environment)
 Proceeding with sectoral permits, which
are expected in late 2017
• Exploration drilling is continuing at several
targets with positive results
 Including Catalina, located less than
1 km south of Phase 7
10
www.kinross.com
10
ATTRACTIVE GROWTH OPPORTUNITIES
RUSSIA SATELLITE DEPOSITS
September North East
• Located approximately 15 km from Dvoinoye
• Near-surface, high-grade M&I mineral resource
estimate of 68koz. Au grading 32 g/t(4)
• Portal and decline development is progressing
well
• Site infrastructure 90% complete
• On schedule to begin production in Q1 2017
Advancing development of satellite deposits located near Kupol and Dvoinoye
Moroshka
• Located 4 km from the Kupol mill
• Completed pre-feasibility study in 2015,
adding ~180koz. to mineral reserve estimates
for Kupol(4)
• Portal construction has commenced
• Decline development and installation of
limited surface infrastructure expected to
begin by year-end
(4) Refer to endnote #4.
11
www.kinross.com
11
ATTRACTIVE GROWTH OPPORTUNITIES
TASIAST TWO-PHASED EXPANSION
Phase One expected to reduce Tasiast’s cost per ounce by ~50% and to increase annual
production by ~90%
Phase One progressing well
• On track to reach full production in Q2 2018
• Engineering ~80% complete
• Procurement for long-lead packages largely
concluded
• Major earthworks have begun
 Substantial construction on the crusher and
SAG mill foundations has commenced
Phase Two feasibility study
• Tendering process for the Phase Two feasibility
study is underway
• Feasibility study is expected to be complete
in Q3 2017
SAG mill foundation
Recent image of the West Branch pit
12
www.kinross.com
12
Financial Results Highlights 12
13
www.kinross.com
13
THIRD QUARTER 2016 HIGHLIGHTS
FINANCIAL RESULTS
Q3 2015 Q3 2016 YTD 2015 YTD 2016
Attributable gold equivalent ounces (oz.)(5)
Produced 680,679 684,129 1,970,937 2,042,859
Sold 715,648 674,070 1,976,459 2,020,219
Average realized gold price ($/oz.) $1,122 $1,336 $1,175 $1,261
Production cost of sales ($/oz.)(6)
Gold equivalent $668 $719 $699 $713
By-product $655 $695 $686 $694
All-in sustaining cost ($/oz.)(7) $941 $1,001 $970 $973
Capital expenditures ($M) $171 $154 $449 $407
Revenue ($M) $809 $910 $2,346 $2,569
Net operating cash flow ($M) $232 $266 $649 $797
Adjusted operating cash flow ($M)(1) $207 $320 $583 $715
Net earnings (loss) ($M)* ($53) $3 ($143) $13
per share ($0.05) $0.00 ($0.12) $0.01
Adjusted net earnings (loss) ($M)(1) ($24) $129 ($22) $144
per share ($0.02) $0.10 ($0.02) $0.12
*Net earnings/loss figures in this presentation represent “net earnings (loss) attributable to common shareholders”.
(1) Refer to endnote #1.
(5) Refer to endnote #5.
(6) Refer to endnote #6.
(7) Refer to endnote #7.
14
www.kinross.com
14
2016 OUTLOOK
GUIDANCE UPDATE(8)
Previous 2016E Guidance Updated 2016E Guidance
Capital expenditures $755 million $650 to $675 million
Other operating costs $95 million in excess of $110 million
DD&A $350 per ounce $325 per ounce
• MAINTAINING guidance for production, cost of sales and all-in sustaining cost
• LOWERING guidance for capital expenditures
 Now expecting 2016 capital expenditures to be $650 to $675 million
 Primarily as a result of Tasiast Phase One capital that is now expected to be spent
in 2017
• OTHER OPERATING COSTS now expected to be in excess of $110 million
 Increase largely related to the suspension of Maricunga in August and temporary
suspension of Tasiast this past summer
• DEPRECIATION, DEPLETION & AMORTIZATION now expected to be $325/oz.
(8) Refer to endnote #8.
15
www.kinross.com
15
• Recorded a $139M non-cash impairment charge at
Maricunga during Q3 2016:
 $68M related to property, plant and equipment
 $71M related to inventory
• We continue to believe Maricunga retains potentially
significant strategic value due to its substantial gold
resource estimates and established infrastructure
THIRD QUARTER RESULTS
NON-CASH IMPAIRMENT
TONNES
(thousands)
GRADE
(g/t)
OUNCES
(thousands)
2P Reserves 40,641 0.8 1,042
M&I Resources 198,084 0.7 4,275
Inferred Resources 53,942 0.6 1,053
2015 GOLD RESERVE AND RESOURCE ESTIMATES(4)
Suspended mining and crushing operations at Maricunga in August
(4) Refer to endnote #4.
16
www.kinross.com
16
STRONG BALANCE SHEET
SOLID FINANCIAL POSITION
$0.8
$1.4
Cash & cash equivalents Undrawn credit facilities
LIQUIDITY POSITION
Maintaining balance sheet strength & financial flexibility remain priority objectives
MAINTAINING FINANCIAL FLEXIBILITY
• Repaid $250M senior notes in September
• Extended maturity dates of the $500M term loan
and $1.5B credit facility by one year, to 2020 and
2021 respectively
• No debt maturities before 2020
• Net debt to EBITDA as at Sep. 30, 2016: 0.86x
• Strong financial position to fund the Tasiast
Phase One expansion with existing liquidity
As at Sep. 30
$2.2B
17
www.kinross.com
17
Operating Highlights 17
18
www.kinross.com
18
2016E GOLD EQUIVALENT
PRODUCTION(5,8)
OPERATIONAL EXCELLENCE
DIVERSIFIED PORTFOLIO OF OPERATING MINES
GLOBAL PORTFOLIO
Operating mine
Development project
Round Mountain
Kettle River-Buckhorn
Fort Knox
La Coipa
Paracatu
Maricunga
Kupol
Dvoinoye
Chirano
Tasiast
AMERICASRUSSIA
WEST AFRICA
(3) Refer to endnote #3.
Over 60% of estimated 2016 gold equivalent production from mines located in the Americas
61%14%
25%
Americas West Africa Russia
2.7-2.9M
ounces
(5) Refer to endnote #5.
(8) Refer to endnote #8.
Bald Mountain
AMERICAS
RUSSIA
19
www.kinross.com
19
THIRD QUARTER 2016 HIGHLIGHTS
AMERICAS
OPERATION
GOLD EQUIVALENT PRODUCTION PRODUCTION COST OF SALES ($/oz.)(6)
Q3 2016 YTD Q3 2016 Q3 2016 YTD Q3 2016
Fort Knox 110,396 295,417 $743 $749
Round Mountain 93,215 278,954 $833 $759
Bald Mountain 32,675 85,801 $1,024 $1,134
Kettle River - Buckhorn 28,241 81,584 $608 $708
Paracatu 111,889 358,039 $693 $689
Maricunga 39,253 142,633 $950 $895
AMERICAS TOTAL 415,669 1,242,428 $781 $772
(6) Refer to endnote #6.
• Strong performance at FORT KNOX and
ROUND MOUNTAIN
• KETTLE-RIVER BUCKHORN production now
expected to extend into Q1 2017
• Continued improvements at BALD MOUNTAIN
 Commissioned a new heap leach pad with
first ore placed during the quarter
• MARICUNGA production lower as mine
placed into suspension in August
• PARACATU production impacted by a 16-day
curtailment due to lack of rainfall
 Ongoing water conservation activities
have reduced potential impact of a
production curtailment due to lack of
water
20
www.kinross.com
20
THIRD QUARTER 2016 HIGHLIGHTS
RUSSIA
KUPOL-DVOINOYE
• Consistent, strong performance from Russian
operations continued in Q3 2016
• Processed approximately 71,000 gold equivalent
ounces from Dvoinoye ore
• Grades were slightly lower due to planned mine
sequencing
• Construction of a filter cake plant expected to be
completed by year-end
 Provides additional tailings capacity for the
current mine plan and provides flexibility for
further mine life extensions
(6) Refer to endnote #6.
OPERATION
GOLD EQUIVALENT PRODUCTION PRODUCTION COST OF SALES ($/oz.)(6)
Q3 2016 YTD Q3 2016 Q3 2016 YTD Q3 2016
Kupol - Dvoinoye 178,032 554,120 $454 $438
RUSSIA TOTAL 178,032 554,120 $454 $438
21
www.kinross.com
21
THIRD QUARTER 2016 HIGHLIGHTS
WEST AFRICA
• TASIAST resumed normal mining and processing
operations in August
 Averaging strong mill throughput of 8,000 t/d
 New 3-year collective labour agreement
signed in early October
• Strong performance at CHIRANO as production
and costs improved significantly based on
recovery plan implemented in March 2016
 Ramp-up of production at Paboase resulted in
more tonnes mined and higher grades
 Improved development rates at Akoti
OPERATION
GOLD EQUIVALENT PRODUCTION(5) PRODUCTION COST OF SALES ($/oz.)(6)
Q3 2016 YTD Q3 2016 Q3 2016 YTD Q3 2016
Tasiast 34,793 111,448 $1,237 $1,120
Chirano (90%)(2) 55,635 134,863 $847 $973
WEST AFRICA TOTAL(2) 90,428 246,311 $985 $1,038
(5) Refer to endnote #5.
(6) Refer to endnote #6.
22
www.kinross.com
22
OPERATIONAL
EXCELLENCE
QUALITY
OVER QUANTITY
BALANCE SHEET
STRENGTH
DISCIPLINED
CAPITAL ALLOCATION
Principles for Building Value
23
www.kinross.com
23
Expecting to
deliver HIGHER
production
2016E Stronger year
expected at
BALD MOUNTAIN
2017E
TASIAST PHASE
ONE expected to
ramp up to full
production
2018E
Start-up of potential
TASIAST PHASE
TWO
2020E
Building Momentum for the Future 23
24
www.kinross.com
24
APPENDIX
Q3 Results
25
www.kinross.com
25
ENDNOTES
1) Adjusted net earnings attributable to common shareholders and adjusted operating cash flow are non-GAAP financial measures. For more
information and a reconciliation of these non-GAAP measures for the three and nine months ended September 30, 2016 and 2015, please
refer to the news release dated November 2, 2016, under the heading “Reconciliation of non-GAAP financial measures”, available on our
website at www.kinross.com.
2) For more information regarding the Round Mountain Phase W Scoping Study, please refer to the news release dated June 29, 2016, which is
available on our website at www.kinross.com.
3) Inferred mineral resource has been determined based on a scoping study completed in June 2016. A scoping study is preliminary in nature
and is based on inferred mineral resources that are considered too speculative geologically to have the economic considerations applied to
them that would enable them to be categorized as mineral reserves. There is no certainty that the results of the scoping study will be realized.
4) For more information regarding Kinross’ 2015 mineral reserve and mineral resource estimates, please refer to our Annual Mineral Reserve
and Mineral Resource Statement as at December 31, 2015 contained in our Annual Information Form filed March 30, 2016, which is available
on our website at www.kinross.com.
5) Unless otherwise noted, gold equivalent production, gold equivalent ounces sold and production cost of sales figures in this presentation are
based on Kinross’ 90% share of Chirano production and sales.
6) Attributable production cost of sales per gold equivalent ounce sold and per gold ounce sold on a by-product basis are non-GAAP measures.
For more information and a reconciliation of this non-GAAP measure for the three and nine months ended September 30, 2016 and 2015,
please refer to the news release dated November 2, 2016, under the heading “Reconciliation of non-GAAP financial measures”, available on
our website at www.kinross.com.
7) All-in sustaining cost is a non-GAAP measure. For more information and a reconciliation of this non-GAAP measure for the three and nine
months ended September 30, 2016 and 2015, please refer to the news release dated November 2, 2016 under the heading “Reconciliation of
non-GAAP financial measures”, available on our website at www.kinross.com.
8) For more information regarding Kinross’ production, cost and capital expenditures outlook for 2016, please refer to the news releases dated
February 10, 2016 and November 2, 2016, which are available on our website at www.kinross.com. Kinross’ outlook for 2016 represents
forward-looking information and users are cautioned that actual results may vary. Please refer to the Cautionary Statement on Forward-
Looking Information on slide 2 of this presentation and in our news release dated November 2, 2016, available on our website at
www.kinross.com.
26
www.kinross.com
26
KINROSS GOLD CORPORATION
25 York Street, 17th Floor │Toronto, ON │ M5J 2V5
www.kinross.com

110316 q3 webcast website

  • 1.
    1 www.kinross.com 1 KINROSS GOLD CORPORATION Q32016 Results Conference Call & Webcast November 3 2016
  • 2.
    2 www.kinross.com 2 CAUTIONARY STATEMENT ONFORWARD-LOOKING INFORMATION All statements, other than statements of historical fact, contained or incorporated by reference in or made in giving this presentation and responses to questions, including but not limited to any information as to the future performance of Kinross, constitute “forward looking statements” within the meaning of applicable securities laws, including the provisions of the Securities Act (Ontario) and the provisions for “safe harbour” under the United States Private Securities Litigation Reform Act of 1995 and are based on expectations, estimates and projections as of the date of this presentation. Forward-looking statements contained in this presentation include those statements on slides with, and statements made under, the headings “2016 Production & Cost Outlook”, “Attractive Growth Opportunities”, “Guidance Update”, and “Building Momentum for the Future”, and include without limitation statements with respect to our guidance for production, production costs of sales, all-in sustaining cost and capital expenditures, project schedules, mine life, continuous improvement and other cost savings opportunities, as well as references and other statements with respect to other possible events and opportunities, including, without limitation, estimates and the realization of such estimates (such as mineral or gold reserves and resources, and mine life); future development, mining activities, production and growth (including but not limited to cost and timing); success of exploration or development of operations; the future price of gold and silver; currency fluctuations; expected capital requirements; government regulation; and environmental risks and proceedings. The words “2016E”, “anticipate”, “assumption”, “believe”, “encouraging”, “estimate”, “expect”, “explore”, “feasibility”, “flexibility”, “focus”, “forecast”, “forward”, “future”, “guidance”, “objective”, “on track”, “opportunity”, “outlook”, “phased”, “plan”, “positioned”, “possible”, “potential”, “principles”, “priority”, “project”, “risk”, “schedule”, “scoping”, “strategy”, “study”, or “target”, or variations of or similar such words and phrases, or statements that certain actions, events or results may, can, could, would, should, might, occur or will be taken or realized, and similar expressions identify forward looking statements. Forward- looking statements are necessarily based upon a number of estimates and assumptions that, while considered reasonable by Kinross as of the date of such statements, are inherently subject to significant business, economic and competitive uncertainties and contingencies. Statements representing management’s financial and other outlook have been prepared solely for purposes of expressing their current views regarding the Company’s financial and other outlook and may not be appropriate for any other purpose. Many of these uncertainties and contingencies can affect, and could cause, Kinross’ actual results to differ materially from those expressed or implied in any forward looking statements made by, or on behalf of, Kinross. There can be no assurance that forward looking statements will prove to be accurate, as actual results and future events could differ materially from those anticipated in such statements. All of the forward looking statements made in this presentation are qualified by these cautionary statements, and those made in our filings with the securities regulators of Canada and the U.S., including but not limited to those cautionary statements made in the “Risk Factors” section of our most recently filed Annual Information Form, the “Risk Analysis” section of our FYE 2015 and Q3 2016 Management’s Discussion and Analysis, and the “Cautionary Statement on Forward-Looking Information” in our news release dated November 2, 2016, to which readers are referred and which are incorporated by reference in this presentation, all of which qualify any and all forward‐looking statements made in this presentation. These factors are not intended to represent a complete list of the factors that could affect Kinross. Kinross disclaims any intention or obligation to update or revise any forward‐looking statements or to explain any material difference between subsequent actual events and such forward‐looking statements, except to the extent required by applicable law. Other information Where we say "we", "us", "our", the "Company", or "Kinross" in this presentation, we mean Kinross Gold Corporation and/or one or more or all of its subsidiaries, as may be applicable. The technical information about the Company’s mineral properties contained in this presentation (other than exploration activities) has been prepared under the supervision of Mr. John Sims, an officer of the Company who is a “qualified person” within the meaning of National Instrument 43-101 (“NI 43-101”). The technical information about the Company’s exploration activities contained in this presentation has been prepared under the supervision of Mr. Sylvain Guerard, an officer of the Company who is a “qualified person” within the meaning of NI 43-101.
  • 3.
  • 4.
    4 www.kinross.com 4 THIRD QUARTER 2016HIGHLIGHTS DELIVERING OPERATIONAL EXCELLENCE Continued strong performance from mines in the U.S. and Russia, and resolved challenges at Bald Mountain, Chirano and Tasiast during the quarter • Increased production and lower costs from Q2 • Result of stronger heap leach performance FORT KNOX • Continued strong performance KUPOL-DVOINOYE • Continued operational improvements • On track to meet revised expectations for 2016 BALD MOUNTAIN • Significant increase in production and reduction in costs from Q2 2016 CHIRANO • Resumed full operations in mid-August TASIAST • Continued strong performance, with better mill grades resulting in higher production from Q2 ROUND MOUNTAIN
  • 5.
    5 www.kinross.com 5 THIRD QUARTER 2016HIGHLIGHTS ROBUST FINANCIAL RESULTS Generated strong cash flow and earnings during the quarter $232 $266 $207 $320 Q3 2015 Q3 2016 Net operating cash flow Adjusted operating cash flow Operating Cash Flow $ millions Net Earnings $ millions Free Cash Flow* $ millions $61 $112 Q3 2015 Q3 2016 -$53 $3 -$24 $129 Q3 2015 Q3 2016 Net earnings Adjusted net earnings *Defined as net cash flow provided from operating activities less capital expenditures (1) Refer to endnote #1. (1) (1)
  • 6.
    6 www.kinross.com 6 ATTRACTIVE GROWTH OPPORTUNITIES ADVANCINGOUR PROJECTS September NE First production Organic projects spanning all 3 of our operating regions offer opportunities to expand production or extend mine life at our operations Q2 2018 Q1 2017 Q2 2017 Q3 2017 Q4 2017 Q1 2018 Bald Mountain Mineral reserve estimate update Bald Mountain Vantage PFS Tasiast Phase 2 Feasibility study La Coipa Phase 7 Sectoral permits Moroshka Production expected to commence H1 Tasiast Phase 1 Full production Project Location Americas West Africa Russia Round Mountain Phase W Feasibility study
  • 7.
    7 www.kinross.com 7 ATTRACTIVE GROWTH OPPORTUNITIES BALDMOUNTAIN • Record of Decision in August a major milestone for future growth and expansion at Bald Mountain NORTH AREA • Opens up new near-term mining opportunities  Initiated stripping of the Redbird pit • Expect to double production with significantly lower costs in 2017 & 2018 SOUTH AREA • Increased number of drill rigs to 7 • Completed 18,000 metres of drilling; plan to complete another 12,000 metres by year-end • Vantage Complex pre-feasibility study progressing well and expected to be complete in Q2 2017 Developing near-term opportunities which are expected to double mineral reserve estimates by end of Q1 2017
  • 8.
    8 www.kinross.com 8 ATTRACTIVE GROWTH OPPORTUNITIES ROUNDMOUNTAIN PHASE W Phase W a low-risk option to extend mine life estimates at one of our best-run U.S. mines • Declared a new Inferred mineral resource of 2.4Moz. for Phase W in June 2016(2,3) • Phase W scoping study results encouraging  Focused on a 1.3Moz. portion of the new resource estimate  51Mt with an average grade of 0.8 g/t • Initiated post-scoping study optimization work, including:  Infill, geotechnical and metallurgical drilling  Mine planning • Feasibility study is expected to be complete in Q3 2017 (2) Refer to endnote #2. (3) Refer to endnote #3.
  • 9.
    9 www.kinross.com 9 ATTRACTIVE GROWTH OPPORTUNITIES LACOIPA PHASE 7 Advancing permitting and exploration activities at the La Coipa Phase 7 project • Pre-feasibility study on La Coipa completed during Q3 2015 • Continue to advance permitting  Received approval on the project DIA (Declaration of Impact to Environment)  Proceeding with sectoral permits, which are expected in late 2017 • Exploration drilling is continuing at several targets with positive results  Including Catalina, located less than 1 km south of Phase 7
  • 10.
    10 www.kinross.com 10 ATTRACTIVE GROWTH OPPORTUNITIES RUSSIASATELLITE DEPOSITS September North East • Located approximately 15 km from Dvoinoye • Near-surface, high-grade M&I mineral resource estimate of 68koz. Au grading 32 g/t(4) • Portal and decline development is progressing well • Site infrastructure 90% complete • On schedule to begin production in Q1 2017 Advancing development of satellite deposits located near Kupol and Dvoinoye Moroshka • Located 4 km from the Kupol mill • Completed pre-feasibility study in 2015, adding ~180koz. to mineral reserve estimates for Kupol(4) • Portal construction has commenced • Decline development and installation of limited surface infrastructure expected to begin by year-end (4) Refer to endnote #4.
  • 11.
    11 www.kinross.com 11 ATTRACTIVE GROWTH OPPORTUNITIES TASIASTTWO-PHASED EXPANSION Phase One expected to reduce Tasiast’s cost per ounce by ~50% and to increase annual production by ~90% Phase One progressing well • On track to reach full production in Q2 2018 • Engineering ~80% complete • Procurement for long-lead packages largely concluded • Major earthworks have begun  Substantial construction on the crusher and SAG mill foundations has commenced Phase Two feasibility study • Tendering process for the Phase Two feasibility study is underway • Feasibility study is expected to be complete in Q3 2017 SAG mill foundation Recent image of the West Branch pit
  • 12.
  • 13.
    13 www.kinross.com 13 THIRD QUARTER 2016HIGHLIGHTS FINANCIAL RESULTS Q3 2015 Q3 2016 YTD 2015 YTD 2016 Attributable gold equivalent ounces (oz.)(5) Produced 680,679 684,129 1,970,937 2,042,859 Sold 715,648 674,070 1,976,459 2,020,219 Average realized gold price ($/oz.) $1,122 $1,336 $1,175 $1,261 Production cost of sales ($/oz.)(6) Gold equivalent $668 $719 $699 $713 By-product $655 $695 $686 $694 All-in sustaining cost ($/oz.)(7) $941 $1,001 $970 $973 Capital expenditures ($M) $171 $154 $449 $407 Revenue ($M) $809 $910 $2,346 $2,569 Net operating cash flow ($M) $232 $266 $649 $797 Adjusted operating cash flow ($M)(1) $207 $320 $583 $715 Net earnings (loss) ($M)* ($53) $3 ($143) $13 per share ($0.05) $0.00 ($0.12) $0.01 Adjusted net earnings (loss) ($M)(1) ($24) $129 ($22) $144 per share ($0.02) $0.10 ($0.02) $0.12 *Net earnings/loss figures in this presentation represent “net earnings (loss) attributable to common shareholders”. (1) Refer to endnote #1. (5) Refer to endnote #5. (6) Refer to endnote #6. (7) Refer to endnote #7.
  • 14.
    14 www.kinross.com 14 2016 OUTLOOK GUIDANCE UPDATE(8) Previous2016E Guidance Updated 2016E Guidance Capital expenditures $755 million $650 to $675 million Other operating costs $95 million in excess of $110 million DD&A $350 per ounce $325 per ounce • MAINTAINING guidance for production, cost of sales and all-in sustaining cost • LOWERING guidance for capital expenditures  Now expecting 2016 capital expenditures to be $650 to $675 million  Primarily as a result of Tasiast Phase One capital that is now expected to be spent in 2017 • OTHER OPERATING COSTS now expected to be in excess of $110 million  Increase largely related to the suspension of Maricunga in August and temporary suspension of Tasiast this past summer • DEPRECIATION, DEPLETION & AMORTIZATION now expected to be $325/oz. (8) Refer to endnote #8.
  • 15.
    15 www.kinross.com 15 • Recorded a$139M non-cash impairment charge at Maricunga during Q3 2016:  $68M related to property, plant and equipment  $71M related to inventory • We continue to believe Maricunga retains potentially significant strategic value due to its substantial gold resource estimates and established infrastructure THIRD QUARTER RESULTS NON-CASH IMPAIRMENT TONNES (thousands) GRADE (g/t) OUNCES (thousands) 2P Reserves 40,641 0.8 1,042 M&I Resources 198,084 0.7 4,275 Inferred Resources 53,942 0.6 1,053 2015 GOLD RESERVE AND RESOURCE ESTIMATES(4) Suspended mining and crushing operations at Maricunga in August (4) Refer to endnote #4.
  • 16.
    16 www.kinross.com 16 STRONG BALANCE SHEET SOLIDFINANCIAL POSITION $0.8 $1.4 Cash & cash equivalents Undrawn credit facilities LIQUIDITY POSITION Maintaining balance sheet strength & financial flexibility remain priority objectives MAINTAINING FINANCIAL FLEXIBILITY • Repaid $250M senior notes in September • Extended maturity dates of the $500M term loan and $1.5B credit facility by one year, to 2020 and 2021 respectively • No debt maturities before 2020 • Net debt to EBITDA as at Sep. 30, 2016: 0.86x • Strong financial position to fund the Tasiast Phase One expansion with existing liquidity As at Sep. 30 $2.2B
  • 17.
  • 18.
    18 www.kinross.com 18 2016E GOLD EQUIVALENT PRODUCTION(5,8) OPERATIONALEXCELLENCE DIVERSIFIED PORTFOLIO OF OPERATING MINES GLOBAL PORTFOLIO Operating mine Development project Round Mountain Kettle River-Buckhorn Fort Knox La Coipa Paracatu Maricunga Kupol Dvoinoye Chirano Tasiast AMERICASRUSSIA WEST AFRICA (3) Refer to endnote #3. Over 60% of estimated 2016 gold equivalent production from mines located in the Americas 61%14% 25% Americas West Africa Russia 2.7-2.9M ounces (5) Refer to endnote #5. (8) Refer to endnote #8. Bald Mountain AMERICAS RUSSIA
  • 19.
    19 www.kinross.com 19 THIRD QUARTER 2016HIGHLIGHTS AMERICAS OPERATION GOLD EQUIVALENT PRODUCTION PRODUCTION COST OF SALES ($/oz.)(6) Q3 2016 YTD Q3 2016 Q3 2016 YTD Q3 2016 Fort Knox 110,396 295,417 $743 $749 Round Mountain 93,215 278,954 $833 $759 Bald Mountain 32,675 85,801 $1,024 $1,134 Kettle River - Buckhorn 28,241 81,584 $608 $708 Paracatu 111,889 358,039 $693 $689 Maricunga 39,253 142,633 $950 $895 AMERICAS TOTAL 415,669 1,242,428 $781 $772 (6) Refer to endnote #6. • Strong performance at FORT KNOX and ROUND MOUNTAIN • KETTLE-RIVER BUCKHORN production now expected to extend into Q1 2017 • Continued improvements at BALD MOUNTAIN  Commissioned a new heap leach pad with first ore placed during the quarter • MARICUNGA production lower as mine placed into suspension in August • PARACATU production impacted by a 16-day curtailment due to lack of rainfall  Ongoing water conservation activities have reduced potential impact of a production curtailment due to lack of water
  • 20.
    20 www.kinross.com 20 THIRD QUARTER 2016HIGHLIGHTS RUSSIA KUPOL-DVOINOYE • Consistent, strong performance from Russian operations continued in Q3 2016 • Processed approximately 71,000 gold equivalent ounces from Dvoinoye ore • Grades were slightly lower due to planned mine sequencing • Construction of a filter cake plant expected to be completed by year-end  Provides additional tailings capacity for the current mine plan and provides flexibility for further mine life extensions (6) Refer to endnote #6. OPERATION GOLD EQUIVALENT PRODUCTION PRODUCTION COST OF SALES ($/oz.)(6) Q3 2016 YTD Q3 2016 Q3 2016 YTD Q3 2016 Kupol - Dvoinoye 178,032 554,120 $454 $438 RUSSIA TOTAL 178,032 554,120 $454 $438
  • 21.
    21 www.kinross.com 21 THIRD QUARTER 2016HIGHLIGHTS WEST AFRICA • TASIAST resumed normal mining and processing operations in August  Averaging strong mill throughput of 8,000 t/d  New 3-year collective labour agreement signed in early October • Strong performance at CHIRANO as production and costs improved significantly based on recovery plan implemented in March 2016  Ramp-up of production at Paboase resulted in more tonnes mined and higher grades  Improved development rates at Akoti OPERATION GOLD EQUIVALENT PRODUCTION(5) PRODUCTION COST OF SALES ($/oz.)(6) Q3 2016 YTD Q3 2016 Q3 2016 YTD Q3 2016 Tasiast 34,793 111,448 $1,237 $1,120 Chirano (90%)(2) 55,635 134,863 $847 $973 WEST AFRICA TOTAL(2) 90,428 246,311 $985 $1,038 (5) Refer to endnote #5. (6) Refer to endnote #6.
  • 22.
  • 23.
    23 www.kinross.com 23 Expecting to deliver HIGHER production 2016EStronger year expected at BALD MOUNTAIN 2017E TASIAST PHASE ONE expected to ramp up to full production 2018E Start-up of potential TASIAST PHASE TWO 2020E Building Momentum for the Future 23
  • 24.
  • 25.
    25 www.kinross.com 25 ENDNOTES 1) Adjusted netearnings attributable to common shareholders and adjusted operating cash flow are non-GAAP financial measures. For more information and a reconciliation of these non-GAAP measures for the three and nine months ended September 30, 2016 and 2015, please refer to the news release dated November 2, 2016, under the heading “Reconciliation of non-GAAP financial measures”, available on our website at www.kinross.com. 2) For more information regarding the Round Mountain Phase W Scoping Study, please refer to the news release dated June 29, 2016, which is available on our website at www.kinross.com. 3) Inferred mineral resource has been determined based on a scoping study completed in June 2016. A scoping study is preliminary in nature and is based on inferred mineral resources that are considered too speculative geologically to have the economic considerations applied to them that would enable them to be categorized as mineral reserves. There is no certainty that the results of the scoping study will be realized. 4) For more information regarding Kinross’ 2015 mineral reserve and mineral resource estimates, please refer to our Annual Mineral Reserve and Mineral Resource Statement as at December 31, 2015 contained in our Annual Information Form filed March 30, 2016, which is available on our website at www.kinross.com. 5) Unless otherwise noted, gold equivalent production, gold equivalent ounces sold and production cost of sales figures in this presentation are based on Kinross’ 90% share of Chirano production and sales. 6) Attributable production cost of sales per gold equivalent ounce sold and per gold ounce sold on a by-product basis are non-GAAP measures. For more information and a reconciliation of this non-GAAP measure for the three and nine months ended September 30, 2016 and 2015, please refer to the news release dated November 2, 2016, under the heading “Reconciliation of non-GAAP financial measures”, available on our website at www.kinross.com. 7) All-in sustaining cost is a non-GAAP measure. For more information and a reconciliation of this non-GAAP measure for the three and nine months ended September 30, 2016 and 2015, please refer to the news release dated November 2, 2016 under the heading “Reconciliation of non-GAAP financial measures”, available on our website at www.kinross.com. 8) For more information regarding Kinross’ production, cost and capital expenditures outlook for 2016, please refer to the news releases dated February 10, 2016 and November 2, 2016, which are available on our website at www.kinross.com. Kinross’ outlook for 2016 represents forward-looking information and users are cautioned that actual results may vary. Please refer to the Cautionary Statement on Forward- Looking Information on slide 2 of this presentation and in our news release dated November 2, 2016, available on our website at www.kinross.com.
  • 26.
    26 www.kinross.com 26 KINROSS GOLD CORPORATION 25York Street, 17th Floor │Toronto, ON │ M5J 2V5 www.kinross.com