Download to read offline


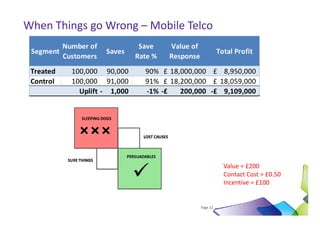


Using incremental marketing techniques can maximize customer loyalty while minimizing costs. A typical customer lifecycle involves acquiring new customers and then building, saving, cross-selling and up-selling existing customers to prevent churn. Sophisticated retention strategies involve micro-segmenting customers based on their value and propensity to churn, and targeting the most valuable at-risk customers. Measurement of retention campaign effectiveness requires comparing response rates to a control group. Retention efforts can backfire and actually increase churn if not carefully targeted to the right customer segments.


![Smps national 2009 regional conference [compatibility mode]](https://cdn.slidesharecdn.com/ss_thumbnails/smpsnational2009regionalconferencecompatibilitymode-100816181240-phpapp01-thumbnail.jpg?width=640&height=640&fit=bounds)


