SlideShare a Scribd company logo
1 of 14
Presentation of the Review
Article:
Weakening of the Atlantic Meridional
Overturning Circulation (AMOC)
1. Caesar, L., Rahmstorf, S.,
Robinson, A., & Feulner,
G. (2018). Article
Observed fingerprint of a
weakening Atlantic
Ocean overturning
circulation.
2. Rahmstorf, S., Box, J. E.,
Feulner, G., Mann, M. E.,
Robinson, A., Rutherford,
S., & Scha, E. J. (2015).
Exceptional twentieth-
century slowdown in
Atlantic Ocean overturning
circulation. 5(March).
https://doi.org/10.1038/N
CLIMATE2554.
INTRODUCTION
PAPER ONE
AMOC is one of
Earth’s major ocean
circulation systems,
redistributing heat on
our planet and
thereby affecting its
climate
DEFINNITION
OF TERMS
The twentieth-
century AMOC
weakening
DIFFERENT
INDICATORS FOR
ATLANTIC OCEAN
CIRCULATION
CAUSES OF THE
WEAKENING AND
IMPLICATIONS FOR
THE FUTURE
EVIDENCE OF
AMOC
WEAKENING
Definition of the AMOC index.
the AMOC index IAMOC as the difference
between the mean SST of the geographic
region that is most sensitive to a reduction
in the AMOC (the subpolar gyre region, sg)
and that of the whole globe:
Definition of the subpolar gyre region
SST differences in the subpolar North Atlantic relative
to the global mean SST are dominated by variations in
the AMOC
AMOC index for a certain year
The mean SST in the subpolar gyre region for the following
November−May season, minus the global mean SST for that
season.
ACC: Antarctica circumpolar current
Definition of the Gulf Stream region
the Gulf Stream region is defined as the region that
covers the above-average long- term warming east of
the US coast that results from an AMOC slowdown in
both observations and model
the terms “Gulf Stream region” and “subpolar gyre” region do
not refer directly to ocean circulation features, but rather to
SST features
Black circles : grid points of the region under consideration
White : model-average 2 ◦C cooling contour from a climate model
intercomparison1in which the models were subject to a strong AMOC
reduction induced by adding a freshwater anomaly to the northern Atlantic.
analysis for 1901–2000.
Global equal
area map
(Hammer
projection) for
1901–2013;
white indicates
insufficient/inho
mogeneous/poor
data coverage
EVIDENCE OF AMOC WEAKENING
Time series of the
maximum overturning
stream function (red) and
the AMOC index (blue).
• Thin lines show annual
values, thick lines
smoothed curves over
11 years.
Connection between the AMOC stream function and the temperature-
based AMOC index in a global warming scenario (RCP8.5)
The twentieth-century AMOC weakening
Spectral analysis of the proxy-
based AMOC index
subpolar gyre reaches nearly its lowest temperatures of the
past millennium in the late twentieth century
Reconstructing the AMOC index over the past millennium • Reconstructing AMOC index based on
• the Northern Hemisphere mean
temperature and SST of the subpolar
gyre.
• the land-and-ocean reconstruction with
the Errors in variables(EIV) method using
all the available proxies based on
Reduction of Error and Coefficient of
Efficiency.
• this series provides a skilful
reconstruction back to AD 900 and
beyond (95% significance compared to
a red-noise null).
AMOC index
DIFFERENT INDICATORS FOR ATLANTIC OCEAN CIRCULATION
temperature-based AMOC index
index based on NASA GISS temperature data48 (scale on left).
curve with uncertainty range shows
coral proxy data25 (scale on right).
Analyses of data from hydrographic sections
across the Atlantic at 25◦ N, where a 1 K change
in the AMOC index corresponds to a 2.3 Sv
change in AMOC transport based on the model
simulation
Annually resolved δ15 N data
represent a tracer for water mass
changes in the region.
• high values are characteristic of the
presence of Labrador Slope Water.
• The time evolution of the 15N
tracer agrees well with that of the
reconstructed AMOC index
Other estimates from oceanographic data similarly suggest relatively strong AMOC in the 1950s and 1960s, weak AMOC in
the 1970s and 1980s and stronger again in the 1990s
oceanic nitrogen- 15 proxy data from
corals off the US north-east coast
CAUSES OF THE WEAKENING AND IMPLICATIONS FOR THE FUTURE
Mass balance terms of the Greenland Ice Sheet.
• Cumulative anomaly relative to the mean over 1840–1900,
• pre-industrial period during which the Greenland Ice Sheet
was approximately in balance.
Dilution of the surface ocean could have
weakened deep-water formation, slowing the
AMOC
Indirect evidence from multiple sources
provides a consistent picture of causes of the
weakening:
 The time evolution of surface temperature
 ocean circulation
 Greenland ice mass balance
Further freshening of the subpolar Atlantic
in the next few decades might lead to
further weakening of the
AMOC within a decade or two,
 and possibly even more permanent
shutdown of Labrador Sea convection as
a result of global warming
COMPARING CLIMATE
MODEL AND SST
OBSERVATIONS
PAPER TWO
AMOC
SEASONAL
VARIATION IN SSTS IN
THE SUBPOLAR GYRE
REGION
AMOC Time
Evolution
Impacts and
Conclusion
PERFORMANCE
OF THE AMOC
INDEX IN
MODELS
COMPARING CLIMATE MODEL AND SST OBSERVATIONS
linear trend in SST over the ‘CO2-doubling’ experiment and the
corresponding control run, compared with the observed trend from
1870 to 2016 for November–May season.
Scales are of differing amounts of CO2 forcing
Both patterns comprise an area of below-average warming (normalized
trend < 1) and cooling (normalized trend < 0) in the subpolar gyre region
Comparison of
time series of SST
anomalies and the
strength of the
overturning
circulation in the
CM2.6 model.
anomaly of the actual AMOC overturning rate relative
to the control run
SEASONAL VARIATION IN SSTS IN THE SUBPOLAR GYRE REGION
annual-mean, global-mean
warming The SST trends in the subpolar gyre
region are well below the global-
mean warming year-round
(differences are given in numbers
along the x axis for the CM2.6 model
(light grey) and the HadISST data
(dark grey) and highlighted by
arrows), yet are smallest during the
cold part of the year for both
observations and model
PERFORMANCE OF THE AMOC INDEX IN MODELS
The graph shows the linear trend in the simulated AMOC decline versus the SST-
based AMOC index in the CMIP5 ensemble regression analysis
 The region defining the
subpolar cold patch is
chosen to be large
enough to encompass the
cooling found across all
models, because its exact
location differs in each
model shows the linear
1870–2016 trend in the
AMOC index, as well as in
the actual AMOC, in these
models
AMOC Time Evolution
Time evolution of the
AMOC, reconstructed
from
observational SST data
(blue curve)from the
period 1870–2016
using the calibration
factor 3.8 Sv K −1
found from the CMIP5
models
The calibration factor is
obtained through
regression analysis,
Impacts and Conclusion
Over Europe, Summer precipitation
decreases (increases) in northern
(southern) Europe has been associated
with a negative summer North Atlantic
Oscillation signal
 E.g 2015 European heat wave in
addition to Stationary Rossby wave
event
 Increase in storms in Europe.
 Sea Level rise and extreme warming
observed at the US’s east coast and
increase in draught in Sahel.
 Change in hydrological cycle, sea ice
IMPACTS
 Amoc weakening by 15% (3 ± 1 sv)
 Cooling in subpolar gyer region due to
reduction in heat transport and warming of
gulf stream region and northward shift of
gulf stream
 High resolution cliamate models with
increased carbon dioxide concentration
 Reduced northward heat transfer
 Emerging northward shift of the gulf stream
 Direct measurements from RAPID_AMOC
project and other studies show low AMOC
values in recent years.
CONCLUSION
Atlantic multidecadal overterning cirrulation presentation

More Related Content

What's hot

Internet climate adaptation and preparednessstrategy
Internet climate adaptation and preparednessstrategyInternet climate adaptation and preparednessstrategy
Internet climate adaptation and preparednessstrategyBill St. Arnaud
 
Monitoring Changes in Antarctic Sea Ice Phenology: 1990-2015
Monitoring Changes in Antarctic Sea Ice Phenology: 1990-2015Monitoring Changes in Antarctic Sea Ice Phenology: 1990-2015
Monitoring Changes in Antarctic Sea Ice Phenology: 1990-2015priscillaahn
 
Climate Change Scenarios for Tourist Destinations in the Bahamas: Eluthrea
Climate Change Scenarios for Tourist Destinations in the Bahamas: EluthreaClimate Change Scenarios for Tourist Destinations in the Bahamas: Eluthrea
Climate Change Scenarios for Tourist Destinations in the Bahamas: Eluthreaintasave-caribsavegroup
 
Was there a Little Ice Age
Was there a Little Ice AgeWas there a Little Ice Age
Was there a Little Ice AgeAdam Jones
 
01 s1 r_pielke_cumconvecrain
01 s1 r_pielke_cumconvecrain01 s1 r_pielke_cumconvecrain
01 s1 r_pielke_cumconvecrainShatabdi Mahanta
 
Diana Allen, SFU - Water Science Research: Challenges and Success Stories in ...
Diana Allen, SFU - Water Science Research: Challenges and Success Stories in ...Diana Allen, SFU - Water Science Research: Challenges and Success Stories in ...
Diana Allen, SFU - Water Science Research: Challenges and Success Stories in ...BC Water Science Symposium
 
Thermal Impact Assessment of Below-Water-Table Aggregate Extraction
Thermal Impact Assessment of Below-Water-Table Aggregate ExtractionThermal Impact Assessment of Below-Water-Table Aggregate Extraction
Thermal Impact Assessment of Below-Water-Table Aggregate ExtractionDirk Kassenaar M.Sc. P.Eng.
 
A high resolution-history_of_the_south_a
A high resolution-history_of_the_south_aA high resolution-history_of_the_south_a
A high resolution-history_of_the_south_aGeorgeaMelo1
 
Climate Change Impact Assessment on Hydrological Regime of Kali Gandaki Basin
Climate Change Impact Assessment on Hydrological Regime of Kali Gandaki BasinClimate Change Impact Assessment on Hydrological Regime of Kali Gandaki Basin
Climate Change Impact Assessment on Hydrological Regime of Kali Gandaki BasinHI-AWARE
 
Issues and Strategies for Integrated Model Calibration
Issues and Strategies for Integrated Model CalibrationIssues and Strategies for Integrated Model Calibration
Issues and Strategies for Integrated Model CalibrationDirk Kassenaar M.Sc. P.Eng.
 
2015 EGU poster CreativeCommonsLogo
2015 EGU poster CreativeCommonsLogo2015 EGU poster CreativeCommonsLogo
2015 EGU poster CreativeCommonsLogoWilliam Cable
 

What's hot (20)

Internet climate adaptation and preparednessstrategy
Internet climate adaptation and preparednessstrategyInternet climate adaptation and preparednessstrategy
Internet climate adaptation and preparednessstrategy
 
Monitoring Changes in Antarctic Sea Ice Phenology: 1990-2015
Monitoring Changes in Antarctic Sea Ice Phenology: 1990-2015Monitoring Changes in Antarctic Sea Ice Phenology: 1990-2015
Monitoring Changes in Antarctic Sea Ice Phenology: 1990-2015
 
Climate Change Scenarios for Tourist Destinations in the Bahamas: Eluthrea
Climate Change Scenarios for Tourist Destinations in the Bahamas: EluthreaClimate Change Scenarios for Tourist Destinations in the Bahamas: Eluthrea
Climate Change Scenarios for Tourist Destinations in the Bahamas: Eluthrea
 
shaikh2012
shaikh2012shaikh2012
shaikh2012
 
Mercator Ocean newsletter 06
Mercator Ocean newsletter 06Mercator Ocean newsletter 06
Mercator Ocean newsletter 06
 
Was there a Little Ice Age
Was there a Little Ice AgeWas there a Little Ice Age
Was there a Little Ice Age
 
#4
#4#4
#4
 
01 s1 r_pielke_cumconvecrain
01 s1 r_pielke_cumconvecrain01 s1 r_pielke_cumconvecrain
01 s1 r_pielke_cumconvecrain
 
Mercator Ocean newsletter 33
Mercator Ocean newsletter 33Mercator Ocean newsletter 33
Mercator Ocean newsletter 33
 
2190831_Poster
2190831_Poster2190831_Poster
2190831_Poster
 
Diana Allen, SFU - Water Science Research: Challenges and Success Stories in ...
Diana Allen, SFU - Water Science Research: Challenges and Success Stories in ...Diana Allen, SFU - Water Science Research: Challenges and Success Stories in ...
Diana Allen, SFU - Water Science Research: Challenges and Success Stories in ...
 
Ccpca mineart
Ccpca mineartCcpca mineart
Ccpca mineart
 
Thermal Impact Assessment of Below-Water-Table Aggregate Extraction
Thermal Impact Assessment of Below-Water-Table Aggregate ExtractionThermal Impact Assessment of Below-Water-Table Aggregate Extraction
Thermal Impact Assessment of Below-Water-Table Aggregate Extraction
 
A high resolution-history_of_the_south_a
A high resolution-history_of_the_south_aA high resolution-history_of_the_south_a
A high resolution-history_of_the_south_a
 
AMIP
AMIPAMIP
AMIP
 
Climate Change Impact Assessment on Hydrological Regime of Kali Gandaki Basin
Climate Change Impact Assessment on Hydrological Regime of Kali Gandaki BasinClimate Change Impact Assessment on Hydrological Regime of Kali Gandaki Basin
Climate Change Impact Assessment on Hydrological Regime of Kali Gandaki Basin
 
3_Gia et al_GRL_2010
3_Gia et al_GRL_20103_Gia et al_GRL_2010
3_Gia et al_GRL_2010
 
GreenlandProject
GreenlandProjectGreenlandProject
GreenlandProject
 
Issues and Strategies for Integrated Model Calibration
Issues and Strategies for Integrated Model CalibrationIssues and Strategies for Integrated Model Calibration
Issues and Strategies for Integrated Model Calibration
 
2015 EGU poster CreativeCommonsLogo
2015 EGU poster CreativeCommonsLogo2015 EGU poster CreativeCommonsLogo
2015 EGU poster CreativeCommonsLogo
 

Similar to Atlantic multidecadal overterning cirrulation presentation

Arctic climate Change: observed and modelled temperature and sea-ice variability
Arctic climate Change: observed and modelled temperature and sea-ice variabilityArctic climate Change: observed and modelled temperature and sea-ice variability
Arctic climate Change: observed and modelled temperature and sea-ice variabilitySimoneBoccuccia
 
Evaluating and communicating Arctic climate change projection
Evaluating and communicating Arctic climate change projectionEvaluating and communicating Arctic climate change projection
Evaluating and communicating Arctic climate change projectionZachary Labe
 
Drivers and uncertainties in past and future sea level changes
Drivers and uncertainties in past and future sea level changesDrivers and uncertainties in past and future sea level changes
Drivers and uncertainties in past and future sea level changesHydrographic Society Benelux
 
Arctic climate change through the lens of data visualization
Arctic climate change through the lens of data visualizationArctic climate change through the lens of data visualization
Arctic climate change through the lens of data visualizationZachary Labe
 
IPCC from AR5 to AR6 - WGI Perspectives - by Panmao Zhai, Co-Chair of WGI
IPCC from AR5 to AR6  - WGI Perspectives - by Panmao Zhai, Co-Chair of WGIIPCC from AR5 to AR6  - WGI Perspectives - by Panmao Zhai, Co-Chair of WGI
IPCC from AR5 to AR6 - WGI Perspectives - by Panmao Zhai, Co-Chair of WGIipcc-media
 
Key messages from the AR5 WGI with focus on Saudi Arabia and the region
Key messages from the AR5 WGI with focus on Saudi Arabia and the regionKey messages from the AR5 WGI with focus on Saudi Arabia and the region
Key messages from the AR5 WGI with focus on Saudi Arabia and the regionJesbin Baidya
 
Dissertation_James_Brooks_MSc_Final_version
Dissertation_James_Brooks_MSc_Final_versionDissertation_James_Brooks_MSc_Final_version
Dissertation_James_Brooks_MSc_Final_versionJames Brooks
 
Thermohaline Circulation & Climate Change
Thermohaline Circulation & Climate ChangeThermohaline Circulation & Climate Change
Thermohaline Circulation & Climate ChangeArulalan T
 
Climate change: Changes in the hydrosphere
Climate change: Changes in the hydrosphereClimate change: Changes in the hydrosphere
Climate change: Changes in the hydrospherecdenef
 

Similar to Atlantic multidecadal overterning cirrulation presentation (20)

Arctic climate Change: observed and modelled temperature and sea-ice variability
Arctic climate Change: observed and modelled temperature and sea-ice variabilityArctic climate Change: observed and modelled temperature and sea-ice variability
Arctic climate Change: observed and modelled temperature and sea-ice variability
 
Annual watercycle
Annual watercycleAnnual watercycle
Annual watercycle
 
Evaluating and communicating Arctic climate change projection
Evaluating and communicating Arctic climate change projectionEvaluating and communicating Arctic climate change projection
Evaluating and communicating Arctic climate change projection
 
Drivers and uncertainties in past and future sea level changes
Drivers and uncertainties in past and future sea level changesDrivers and uncertainties in past and future sea level changes
Drivers and uncertainties in past and future sea level changes
 
tc-7-321-2013
tc-7-321-2013tc-7-321-2013
tc-7-321-2013
 
Fabrizio D'Aprile _ EGU2016
Fabrizio D'Aprile _ EGU2016Fabrizio D'Aprile _ EGU2016
Fabrizio D'Aprile _ EGU2016
 
Arctic climate change through the lens of data visualization
Arctic climate change through the lens of data visualizationArctic climate change through the lens of data visualization
Arctic climate change through the lens of data visualization
 
IPCC from AR5 to AR6 - WGI Perspectives - by Panmao Zhai, Co-Chair of WGI
IPCC from AR5 to AR6  - WGI Perspectives - by Panmao Zhai, Co-Chair of WGIIPCC from AR5 to AR6  - WGI Perspectives - by Panmao Zhai, Co-Chair of WGI
IPCC from AR5 to AR6 - WGI Perspectives - by Panmao Zhai, Co-Chair of WGI
 
Mercator Ocean newsletter 05
Mercator Ocean newsletter 05Mercator Ocean newsletter 05
Mercator Ocean newsletter 05
 
1 a shakhova_final
1 a shakhova_final1 a shakhova_final
1 a shakhova_final
 
Key messages from the AR5 WGI with focus on Saudi Arabia and the region
Key messages from the AR5 WGI with focus on Saudi Arabia and the regionKey messages from the AR5 WGI with focus on Saudi Arabia and the region
Key messages from the AR5 WGI with focus on Saudi Arabia and the region
 
Sea level CO2
Sea level CO2Sea level CO2
Sea level CO2
 
Dissertation_James_Brooks_MSc_Final_version
Dissertation_James_Brooks_MSc_Final_versionDissertation_James_Brooks_MSc_Final_version
Dissertation_James_Brooks_MSc_Final_version
 
Climppf1
Climppf1Climppf1
Climppf1
 
Thermohaline Circulation & Climate Change
Thermohaline Circulation & Climate ChangeThermohaline Circulation & Climate Change
Thermohaline Circulation & Climate Change
 
Climate changes in Central Asia (agriculture activity impact)
Climate changes in Central Asia (agriculture activity impact)Climate changes in Central Asia (agriculture activity impact)
Climate changes in Central Asia (agriculture activity impact)
 
ENV 101 Ch16 lecture ppt_a
ENV 101 Ch16 lecture ppt_aENV 101 Ch16 lecture ppt_a
ENV 101 Ch16 lecture ppt_a
 
Climate change: Changes in the hydrosphere
Climate change: Changes in the hydrosphereClimate change: Changes in the hydrosphere
Climate change: Changes in the hydrosphere
 
Modeling the water food-energy nexus in the arab world
Modeling the water food-energy nexus in the arab worldModeling the water food-energy nexus in the arab world
Modeling the water food-energy nexus in the arab world
 
Quaternary cycles
Quaternary cyclesQuaternary cycles
Quaternary cycles
 

Recently uploaded

VIP Call Girl Gorakhpur Aashi 8250192130 Independent Escort Service Gorakhpur
VIP Call Girl Gorakhpur Aashi 8250192130 Independent Escort Service GorakhpurVIP Call Girl Gorakhpur Aashi 8250192130 Independent Escort Service Gorakhpur
VIP Call Girl Gorakhpur Aashi 8250192130 Independent Escort Service GorakhpurSuhani Kapoor
 
VIP Call Girls Ramanthapur ( Hyderabad ) Phone 8250192130 | ₹5k To 25k With R...
VIP Call Girls Ramanthapur ( Hyderabad ) Phone 8250192130 | ₹5k To 25k With R...VIP Call Girls Ramanthapur ( Hyderabad ) Phone 8250192130 | ₹5k To 25k With R...
VIP Call Girls Ramanthapur ( Hyderabad ) Phone 8250192130 | ₹5k To 25k With R...Suhani Kapoor
 
Determination of antibacterial activity of various broad spectrum antibiotics...
Determination of antibacterial activity of various broad spectrum antibiotics...Determination of antibacterial activity of various broad spectrum antibiotics...
Determination of antibacterial activity of various broad spectrum antibiotics...Open Access Research Paper
 
Abu Dhabi Sea Beach Visitor Community pp
Abu Dhabi Sea Beach Visitor Community ppAbu Dhabi Sea Beach Visitor Community pp
Abu Dhabi Sea Beach Visitor Community pp202215407
 
Hi FI Call Girl Ahmedabad 7397865700 Independent Call Girls
Hi FI Call Girl Ahmedabad 7397865700 Independent Call GirlsHi FI Call Girl Ahmedabad 7397865700 Independent Call Girls
Hi FI Call Girl Ahmedabad 7397865700 Independent Call Girlsssuser7cb4ff
 
Freegle User Survey as visual display - BH
Freegle User Survey as visual display - BHFreegle User Survey as visual display - BH
Freegle User Survey as visual display - BHbill846304
 
(ANIKA) Call Girls Wagholi ( 7001035870 ) HI-Fi Pune Escorts Service
(ANIKA) Call Girls Wagholi ( 7001035870 ) HI-Fi Pune Escorts Service(ANIKA) Call Girls Wagholi ( 7001035870 ) HI-Fi Pune Escorts Service
(ANIKA) Call Girls Wagholi ( 7001035870 ) HI-Fi Pune Escorts Serviceranjana rawat
 
Soil pollution causes effects remedial measures
Soil pollution causes effects remedial measuresSoil pollution causes effects remedial measures
Soil pollution causes effects remedial measuresvasubhanot1234
 
Spiders by Slidesgo - an introduction to arachnids
Spiders by Slidesgo - an introduction to arachnidsSpiders by Slidesgo - an introduction to arachnids
Spiders by Slidesgo - an introduction to arachnidsprasan26
 
(AISHA) Wagholi Call Girls Just Call 7001035870 [ Cash on Delivery ] Pune Esc...
(AISHA) Wagholi Call Girls Just Call 7001035870 [ Cash on Delivery ] Pune Esc...(AISHA) Wagholi Call Girls Just Call 7001035870 [ Cash on Delivery ] Pune Esc...
(AISHA) Wagholi Call Girls Just Call 7001035870 [ Cash on Delivery ] Pune Esc...ranjana rawat
 
Call Girls In Faridabad(Ballabgarh) Book ☎ 8168257667, @4999
Call Girls In Faridabad(Ballabgarh) Book ☎ 8168257667, @4999Call Girls In Faridabad(Ballabgarh) Book ☎ 8168257667, @4999
Call Girls In Faridabad(Ballabgarh) Book ☎ 8168257667, @4999Tina Ji
 
VIP Call Girls Moti Ganpur ( Hyderabad ) Phone 8250192130 | ₹5k To 25k With R...
VIP Call Girls Moti Ganpur ( Hyderabad ) Phone 8250192130 | ₹5k To 25k With R...VIP Call Girls Moti Ganpur ( Hyderabad ) Phone 8250192130 | ₹5k To 25k With R...
VIP Call Girls Moti Ganpur ( Hyderabad ) Phone 8250192130 | ₹5k To 25k With R...Suhani Kapoor
 
Species composition, diversity and community structure of mangroves in Barang...
Species composition, diversity and community structure of mangroves in Barang...Species composition, diversity and community structure of mangroves in Barang...
Species composition, diversity and community structure of mangroves in Barang...Open Access Research Paper
 
办理学位证(KU证书)堪萨斯大学毕业证成绩单原版一比一
办理学位证(KU证书)堪萨斯大学毕业证成绩单原版一比一办理学位证(KU证书)堪萨斯大学毕业证成绩单原版一比一
办理学位证(KU证书)堪萨斯大学毕业证成绩单原版一比一F dds
 
Sustainable Clothing Strategies and Challenges
Sustainable Clothing Strategies and ChallengesSustainable Clothing Strategies and Challenges
Sustainable Clothing Strategies and ChallengesDr. Salem Baidas
 

Recently uploaded (20)

VIP Call Girl Gorakhpur Aashi 8250192130 Independent Escort Service Gorakhpur
VIP Call Girl Gorakhpur Aashi 8250192130 Independent Escort Service GorakhpurVIP Call Girl Gorakhpur Aashi 8250192130 Independent Escort Service Gorakhpur
VIP Call Girl Gorakhpur Aashi 8250192130 Independent Escort Service Gorakhpur
 
VIP Call Girls Ramanthapur ( Hyderabad ) Phone 8250192130 | ₹5k To 25k With R...
VIP Call Girls Ramanthapur ( Hyderabad ) Phone 8250192130 | ₹5k To 25k With R...VIP Call Girls Ramanthapur ( Hyderabad ) Phone 8250192130 | ₹5k To 25k With R...
VIP Call Girls Ramanthapur ( Hyderabad ) Phone 8250192130 | ₹5k To 25k With R...
 
Determination of antibacterial activity of various broad spectrum antibiotics...
Determination of antibacterial activity of various broad spectrum antibiotics...Determination of antibacterial activity of various broad spectrum antibiotics...
Determination of antibacterial activity of various broad spectrum antibiotics...
 
Abu Dhabi Sea Beach Visitor Community pp
Abu Dhabi Sea Beach Visitor Community ppAbu Dhabi Sea Beach Visitor Community pp
Abu Dhabi Sea Beach Visitor Community pp
 
Hi FI Call Girl Ahmedabad 7397865700 Independent Call Girls
Hi FI Call Girl Ahmedabad 7397865700 Independent Call GirlsHi FI Call Girl Ahmedabad 7397865700 Independent Call Girls
Hi FI Call Girl Ahmedabad 7397865700 Independent Call Girls
 
Freegle User Survey as visual display - BH
Freegle User Survey as visual display - BHFreegle User Survey as visual display - BH
Freegle User Survey as visual display - BH
 
(ANIKA) Call Girls Wagholi ( 7001035870 ) HI-Fi Pune Escorts Service
(ANIKA) Call Girls Wagholi ( 7001035870 ) HI-Fi Pune Escorts Service(ANIKA) Call Girls Wagholi ( 7001035870 ) HI-Fi Pune Escorts Service
(ANIKA) Call Girls Wagholi ( 7001035870 ) HI-Fi Pune Escorts Service
 
Sexy Call Girls Patel Nagar New Delhi +918448380779 Call Girls Service in Del...
Sexy Call Girls Patel Nagar New Delhi +918448380779 Call Girls Service in Del...Sexy Call Girls Patel Nagar New Delhi +918448380779 Call Girls Service in Del...
Sexy Call Girls Patel Nagar New Delhi +918448380779 Call Girls Service in Del...
 
Soil pollution causes effects remedial measures
Soil pollution causes effects remedial measuresSoil pollution causes effects remedial measures
Soil pollution causes effects remedial measures
 
Spiders by Slidesgo - an introduction to arachnids
Spiders by Slidesgo - an introduction to arachnidsSpiders by Slidesgo - an introduction to arachnids
Spiders by Slidesgo - an introduction to arachnids
 
(AISHA) Wagholi Call Girls Just Call 7001035870 [ Cash on Delivery ] Pune Esc...
(AISHA) Wagholi Call Girls Just Call 7001035870 [ Cash on Delivery ] Pune Esc...(AISHA) Wagholi Call Girls Just Call 7001035870 [ Cash on Delivery ] Pune Esc...
(AISHA) Wagholi Call Girls Just Call 7001035870 [ Cash on Delivery ] Pune Esc...
 
Call Girls In Faridabad(Ballabgarh) Book ☎ 8168257667, @4999
Call Girls In Faridabad(Ballabgarh) Book ☎ 8168257667, @4999Call Girls In Faridabad(Ballabgarh) Book ☎ 8168257667, @4999
Call Girls In Faridabad(Ballabgarh) Book ☎ 8168257667, @4999
 
VIP Call Girls Moti Ganpur ( Hyderabad ) Phone 8250192130 | ₹5k To 25k With R...
VIP Call Girls Moti Ganpur ( Hyderabad ) Phone 8250192130 | ₹5k To 25k With R...VIP Call Girls Moti Ganpur ( Hyderabad ) Phone 8250192130 | ₹5k To 25k With R...
VIP Call Girls Moti Ganpur ( Hyderabad ) Phone 8250192130 | ₹5k To 25k With R...
 
Sustainable Packaging
Sustainable PackagingSustainable Packaging
Sustainable Packaging
 
E Waste Management
E Waste ManagementE Waste Management
E Waste Management
 
Species composition, diversity and community structure of mangroves in Barang...
Species composition, diversity and community structure of mangroves in Barang...Species composition, diversity and community structure of mangroves in Barang...
Species composition, diversity and community structure of mangroves in Barang...
 
Hot Sexy call girls in Nehru Place, 🔝 9953056974 🔝 escort Service
Hot Sexy call girls in Nehru Place, 🔝 9953056974 🔝 escort ServiceHot Sexy call girls in Nehru Place, 🔝 9953056974 🔝 escort Service
Hot Sexy call girls in Nehru Place, 🔝 9953056974 🔝 escort Service
 
Gandhi Nagar (Delhi) 9953330565 Escorts, Call Girls Services
Gandhi Nagar (Delhi) 9953330565 Escorts, Call Girls ServicesGandhi Nagar (Delhi) 9953330565 Escorts, Call Girls Services
Gandhi Nagar (Delhi) 9953330565 Escorts, Call Girls Services
 
办理学位证(KU证书)堪萨斯大学毕业证成绩单原版一比一
办理学位证(KU证书)堪萨斯大学毕业证成绩单原版一比一办理学位证(KU证书)堪萨斯大学毕业证成绩单原版一比一
办理学位证(KU证书)堪萨斯大学毕业证成绩单原版一比一
 
Sustainable Clothing Strategies and Challenges
Sustainable Clothing Strategies and ChallengesSustainable Clothing Strategies and Challenges
Sustainable Clothing Strategies and Challenges
 

Atlantic multidecadal overterning cirrulation presentation

  • 1. Presentation of the Review Article: Weakening of the Atlantic Meridional Overturning Circulation (AMOC) 1. Caesar, L., Rahmstorf, S., Robinson, A., & Feulner, G. (2018). Article Observed fingerprint of a weakening Atlantic Ocean overturning circulation. 2. Rahmstorf, S., Box, J. E., Feulner, G., Mann, M. E., Robinson, A., Rutherford, S., & Scha, E. J. (2015). Exceptional twentieth- century slowdown in Atlantic Ocean overturning circulation. 5(March). https://doi.org/10.1038/N CLIMATE2554.
  • 2. INTRODUCTION PAPER ONE AMOC is one of Earth’s major ocean circulation systems, redistributing heat on our planet and thereby affecting its climate DEFINNITION OF TERMS The twentieth- century AMOC weakening DIFFERENT INDICATORS FOR ATLANTIC OCEAN CIRCULATION CAUSES OF THE WEAKENING AND IMPLICATIONS FOR THE FUTURE EVIDENCE OF AMOC WEAKENING
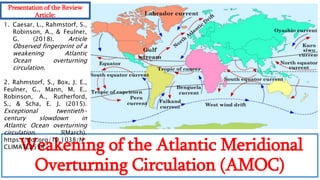
  • 3. Definition of the AMOC index. the AMOC index IAMOC as the difference between the mean SST of the geographic region that is most sensitive to a reduction in the AMOC (the subpolar gyre region, sg) and that of the whole globe: Definition of the subpolar gyre region SST differences in the subpolar North Atlantic relative to the global mean SST are dominated by variations in the AMOC AMOC index for a certain year The mean SST in the subpolar gyre region for the following November−May season, minus the global mean SST for that season. ACC: Antarctica circumpolar current Definition of the Gulf Stream region the Gulf Stream region is defined as the region that covers the above-average long- term warming east of the US coast that results from an AMOC slowdown in both observations and model the terms “Gulf Stream region” and “subpolar gyre” region do not refer directly to ocean circulation features, but rather to SST features
  • 4. Black circles : grid points of the region under consideration White : model-average 2 ◦C cooling contour from a climate model intercomparison1in which the models were subject to a strong AMOC reduction induced by adding a freshwater anomaly to the northern Atlantic. analysis for 1901–2000. Global equal area map (Hammer projection) for 1901–2013; white indicates insufficient/inho mogeneous/poor data coverage EVIDENCE OF AMOC WEAKENING
  • 5. Time series of the maximum overturning stream function (red) and the AMOC index (blue). • Thin lines show annual values, thick lines smoothed curves over 11 years. Connection between the AMOC stream function and the temperature- based AMOC index in a global warming scenario (RCP8.5) The twentieth-century AMOC weakening Spectral analysis of the proxy- based AMOC index subpolar gyre reaches nearly its lowest temperatures of the past millennium in the late twentieth century Reconstructing the AMOC index over the past millennium • Reconstructing AMOC index based on • the Northern Hemisphere mean temperature and SST of the subpolar gyre. • the land-and-ocean reconstruction with the Errors in variables(EIV) method using all the available proxies based on Reduction of Error and Coefficient of Efficiency. • this series provides a skilful reconstruction back to AD 900 and beyond (95% significance compared to a red-noise null). AMOC index
  • 6. DIFFERENT INDICATORS FOR ATLANTIC OCEAN CIRCULATION temperature-based AMOC index index based on NASA GISS temperature data48 (scale on left). curve with uncertainty range shows coral proxy data25 (scale on right). Analyses of data from hydrographic sections across the Atlantic at 25◦ N, where a 1 K change in the AMOC index corresponds to a 2.3 Sv change in AMOC transport based on the model simulation Annually resolved δ15 N data represent a tracer for water mass changes in the region. • high values are characteristic of the presence of Labrador Slope Water. • The time evolution of the 15N tracer agrees well with that of the reconstructed AMOC index Other estimates from oceanographic data similarly suggest relatively strong AMOC in the 1950s and 1960s, weak AMOC in the 1970s and 1980s and stronger again in the 1990s oceanic nitrogen- 15 proxy data from corals off the US north-east coast
  • 7. CAUSES OF THE WEAKENING AND IMPLICATIONS FOR THE FUTURE Mass balance terms of the Greenland Ice Sheet. • Cumulative anomaly relative to the mean over 1840–1900, • pre-industrial period during which the Greenland Ice Sheet was approximately in balance. Dilution of the surface ocean could have weakened deep-water formation, slowing the AMOC Indirect evidence from multiple sources provides a consistent picture of causes of the weakening:  The time evolution of surface temperature  ocean circulation  Greenland ice mass balance Further freshening of the subpolar Atlantic in the next few decades might lead to further weakening of the AMOC within a decade or two,  and possibly even more permanent shutdown of Labrador Sea convection as a result of global warming
  • 8. COMPARING CLIMATE MODEL AND SST OBSERVATIONS PAPER TWO AMOC SEASONAL VARIATION IN SSTS IN THE SUBPOLAR GYRE REGION AMOC Time Evolution Impacts and Conclusion PERFORMANCE OF THE AMOC INDEX IN MODELS
  • 9. COMPARING CLIMATE MODEL AND SST OBSERVATIONS linear trend in SST over the ‘CO2-doubling’ experiment and the corresponding control run, compared with the observed trend from 1870 to 2016 for November–May season. Scales are of differing amounts of CO2 forcing Both patterns comprise an area of below-average warming (normalized trend < 1) and cooling (normalized trend < 0) in the subpolar gyre region Comparison of time series of SST anomalies and the strength of the overturning circulation in the CM2.6 model. anomaly of the actual AMOC overturning rate relative to the control run
  • 10. SEASONAL VARIATION IN SSTS IN THE SUBPOLAR GYRE REGION annual-mean, global-mean warming The SST trends in the subpolar gyre region are well below the global- mean warming year-round (differences are given in numbers along the x axis for the CM2.6 model (light grey) and the HadISST data (dark grey) and highlighted by arrows), yet are smallest during the cold part of the year for both observations and model
  • 11. PERFORMANCE OF THE AMOC INDEX IN MODELS The graph shows the linear trend in the simulated AMOC decline versus the SST- based AMOC index in the CMIP5 ensemble regression analysis  The region defining the subpolar cold patch is chosen to be large enough to encompass the cooling found across all models, because its exact location differs in each model shows the linear 1870–2016 trend in the AMOC index, as well as in the actual AMOC, in these models
  • 12. AMOC Time Evolution Time evolution of the AMOC, reconstructed from observational SST data (blue curve)from the period 1870–2016 using the calibration factor 3.8 Sv K −1 found from the CMIP5 models The calibration factor is obtained through regression analysis,
  • 13. Impacts and Conclusion Over Europe, Summer precipitation decreases (increases) in northern (southern) Europe has been associated with a negative summer North Atlantic Oscillation signal  E.g 2015 European heat wave in addition to Stationary Rossby wave event  Increase in storms in Europe.  Sea Level rise and extreme warming observed at the US’s east coast and increase in draught in Sahel.  Change in hydrological cycle, sea ice IMPACTS  Amoc weakening by 15% (3 ± 1 sv)  Cooling in subpolar gyer region due to reduction in heat transport and warming of gulf stream region and northward shift of gulf stream  High resolution cliamate models with increased carbon dioxide concentration  Reduced northward heat transfer  Emerging northward shift of the gulf stream  Direct measurements from RAPID_AMOC project and other studies show low AMOC values in recent years. CONCLUSION