1. Fig. 1 – Location of the four meteorological stations on
tops of the Tuscan Apennine Alps. Abetone is AB,
Camaldoli is CA, Campigna is CP, La Verna is LA, and
Vallombrosa is VA.
Modification of season length?
Conclusions
This study contributes to highlight the importance of further exploring the causes of
variability in trends of temperature at the local level when effects of climate
variability are investigated;
In some sites, warmer periods have occurred in the past. This would suggest
continuing to monitor climate variability at the site level and spatial scale;
Master series of mean temperature may fail in detecting alterations that occur at the
monthly level and especially when climate variability is implemented in planning and
management of natural resources in mountain regions. In forested areas, trends in
temperature at the regional or higher scale may smooth variability at the local level
that can have relevant effects on tree growth and health instead.
Although a main tendency of temperature to increase over recent decades seems to be
present, any potential tendency to the homogenization of trends and changes in the
extent of seasons may have strong effects on mountain forest ecosystems. If so, the
causes of this phenomenon, which has to be verified at the regional scale, need to be
investigated.
Changes in the length of seasons can also have relevant impacts in the phenology and
growth of plant species. This would require to approach the monitoring of trends in
climate variability by implementing phenological and/or plant growth monitoring.
VARIABILITY IN TRENDS OF ANNUAL MEAN TEMPERATURE
AMONG FORESTED AREAS IN THE APENNINE ALPS (MIDDLE ITALY)
F. D’Aprile(1) and N. Tapper(2)
(1) School of Earth, Atmosphere and Environment, Monash University, Clayton Campus, Melbourne VIC 3800, Australia (fabrizio.daprile@monash.edu )
(2) Professor, School of Earth, Atmosphere and Environment, Monash University, Clayton Campus, Melbourne VIC 3800, Australia (nigel.tapper@monash.edu )
Annual mean temperature over time shows that similarity in trends among sites is
highly non-stationary and varies irregularly during the previous and the current
centuries (Fig.4a). Similarity spans between moderate and highly positive values and
negative values.
However, a change in trends’ similarity seems to occur from the 1980’ (Fig. 4b); the
variability of similarity appears reduced and/or occurring relatively more regularly.
Fig. 2 – Annual mean temperature at the five study sites. AB is Abetone, CM is
Camaldoli, CP is Campigna, LA is La Verna, and VAL is Vallombrosa.
Table 1 – Elevation (m. asl), UTM coordinates, and
period of data available for the four meteorological
stations.
Aim of the research
In 2006 the School of Geography and
Environmental Sciences of Monash University in
collaboration with the Italian Forest Corps (Corpo
Forestale dello Stato), Uffici Territoriali per la
Biodiversità di Vallombrosa (Florence) and
Pratovecchio (Arezzo) started to monitor the
variability in temperature and rainfall in the Tuscan
Apennine Alps (Middle Italy) (Fig.1). First results
showed unexpected variability in trends of both the
climate variables and in particular very high
variability in similarity of trends among sites even
at short distance. Although the time series are
ultra-centenary in some sites, trends in temperature
and rainfall at the monthly level would show an
increase in temperature in the last decades.
However, in some sites a relative cooling is shown
in the 2000s; and, similar warm periods occurred
various decades ago. In the area, climate warming
appears to reach levels that may have relevant
implications for forest composition and shift. The
relatively fast increase in temperature during the
last 3-4 decades further strengthens the importance
to continue monitoring climate variability to a
deeper level and extend the understanding of its
effects at the local level.
After years, this uncertainty poses the question
whether the phenomenon was due to some
anomaly in the periodical oscillations of 6-7 years
of length (spectral Fourier analysis) or the
dominant trends in variability of monthly
temperature are changed.
Annual temperature trends
Statistical analysis show different trends in annual mean temperature at the
five sites (Fig. 2). For example, the 1960s at Abetone feature a very warm
period that does not occur at the other study sites; at Camaldoli,
temperature decreases during the 1900s while it increases at Vallombrosa.
Smoothing of the annual mean temperature series is made by moving
averages; spectral Fourier analysis would suggest the presence of 6-7 years
sub-periods in temperature variability.
Seven-years moving averages highlight some relevant differences in trends
of annual mean temperature among sites (Fig. 3), and previous occurrence
of periods warmer than in recent decades (i.e; VA during the 1940s). From
the 1980s, differences in values of annual mean temperature seem to
decrease among sites although the level in similarity of trends may still
vary among sites in some cases.
A general moderate level of similarity among annual mean temperature
series is confirmed by matrix correlation (Table 2.); in some cases,
similarity is good (i.e.: CM-LA, VA-CP).
Table 2 – Higher values of Pearson coefficients of correlation of annual mean temperature
when tested versus the seasonal mean temperatures at the other study sites (Camaldoli, La
Verna, and Vallombrosa)
Fig. 5a – Dendrogram of monthly mean temperature series among sites produced by
agglomerative hierarchical clustering.
Variability in similarity of annual mean temperature trends
European Geosciences Union
General Assembly 2016
Session
‘Mountain climates: processes, change and related impacts’
Vienna, Austria, 17 – 22 May 2016
Fig. 4a – Pearson’s r correlation of 7-yrs moving averages between paired sites.
Elev.
(m. asl)
UTM Coordinates Period available
N E Temp. (oC) Prec. (mm)
Abetone
(AB) 1345 4888677 633856 1951-2005 1921-2014
Camaldoli
(CA) 1111 4854670 726599 1885-2015 1916-2014
Campigna
(CP) 1050 4861300 720730 1947-2014 1934-2010
La Verna
(LA) 1125 4843497 736176 1956-2014 1924-2014
Vallombrosa
(VA) 975 4845229 705916 1872-2015 1872-2014
Fig. 3 – Seven-years moving averages of annual mean temperature at the five study
sites. AB is Abetone, CM is Camaldoli, CP is Campigna, LA is La Verna, and VA is
Vallombrosa.
Correlations of 7-Years Moving Averages of Annual Mean Temperature.
Pearson’s r. Correlations are significant at p < 0.0500. N=33 (Casewise deletion of missing data)
AB Year CM Year CP Year LA Year VA Year
AB Year r = 1.00 p = --- r = -0.18 p = 0.33 r = 0.35 p = 0.05 r = -0.21 p = 0.23 r = 0.22 p = 0.22
CM Year r = -0.18 p = 0.33 r = 1.00 p = --- r = 0.41 p = 0.02 r = 0.83 p = 0.00 r = 0.49 p = 0.04
CP Year r = 0.35 p = 0.05 r = 0.41 p = 0.02 r = 1.00 p = --- r = 0.61 p = 0.00 r = 0.78 p = 0.00
LA Year r = -0.21 p = 0.23 r = 0.83 p = 0.00 r = 0.61 p = 0.00 r = 1.00 p = --- r = 0.60 p = 0.00
VA Year r = 0.22 p = 0.22 r = 0.49 p = 0.004 r = 0.78 p = 0.00 r = 0.60 p = 0.00 r = 1.00 p = ---
Tuscan Apennine Alps (Middle Italy)
Monthly mean temperature (o
C)
Cluster analysis. Complete linkage, Euclidean distances
Period 1956-2014
Aug
Aug
Aug
Aug
Jul
Jul
Jul
Jul
Sep
Sep
Sep
Sep
Jun
Jun
Jun
Jun
Oct
Oct
Oct
Oct
May
May
May
May
Nov
Nov
Nov
Nov
Apr
Apr
Apr
Apr
Mar
Mar
Mar
Mar
Feb
Feb
Feb
Feb
Dec
Dec
Dec
Dec
Jan
Jan
Jan
Jan
0
20
40
60
80
100
120
LinkageDistance
Tuscan Apennine Alps (Middle Italy)
Monthly mean temperature (o
C)
Cluster analysis. Complete linkage, Euclidean distances
Period 1885-2014
ABSep
LAAug
CPAug
VAAug
CMAug
LAJul
CPJul
VAJul
CMJul
VASep
LASep
CPSep
CMSep
LAJun
VAJun
CPJun
CMJun
ABAug
ABJul
ABNov
LAMay
CPMay
VAMay
CMMay
ABJun
LAOct
VAOct
CPOct
CMOct
ABOct
ABMay
VAApr
LAApr
CPApr
CMApr
VANov
LANov
CPNov
CMNov
ABApr
VAMar
LAMar
CPMar
CMMar
VADec
CPDec
LADec
CMDec
ABDec
ABMar
VAFeb
CPFeb
LAFeb
CMFeb
ABFeb
VAJan
CPJan
LAJan
CMJan
ABJan
0
20
40
60
80
100
120
140
160
180
LinkageDistance
Tuscan Apennine Alps (Middle Italy)
Annual Mean Temperature (o
C)
AB Year
CM Year
CP Year
LA Year
VA Year1872 1882 1892 1902 1912 1922 1932 1942 1952 1962 1972 1982 1992 2002 2012
4
5
6
7
8
9
10
11
12
o
C
Tuscan Apennine Alps (Middle Italy)
Annual mean temperature (o
C)
Seven-years moving averages and long-term means
AB Year
AB Mean
CM Year
CM Mean
CP Year
CP Mean
LA Year
LA Mean
VA Year
VA Mean1872 1882 1892 1902 1912 1922 1932 1942 1952 1962 1972 1982 1992 2002 2012
5
6
7
8
9
10
11
o
C
Tuscan Apennine Alps (Middle Italy)
Annual mean temperature (o
C)
Pearson's Correlation of 7-Years Moving Averages
Period 1950-2014
AB-CM
AB-CP
AB-LA
AB-VA
CM-CP
CM-LA
CM-VA
CP-LA
CP-VA1953 1957 1961 1965 1969 1973 1977 1981 1985 1989 1993 1997 2001 2005 2009
-1.0
-0.8
-0.6
-0.4
-0.2
0.0
0.2
0.4
0.6
0.8
1.0
Pearson'sr
Tuscan Apennine Alps (Middle Italy)
Annual Mean Temperature (o
C)
Pearson's Correlation of 7-Years Moving Averages
Period 1885-2014
AB-CM
AB-CP
AB-LA
AB-VA
CM-CP
CM-LA
CM-VA
CP-LA
CP-VA
LA-VA1890 1899 1908 1917 1926 1935 1944 1953 1962 1971 1980 1989 1998 2007
-1.0
-0.9
-0.8
-0.7
-0.6
-0.5
-0.4
-0.3
-0.2
-0.1
0.0
0.1
0.2
0.3
0.4
0.5
0.6
0.7
0.8
0.9
1.0
o
C
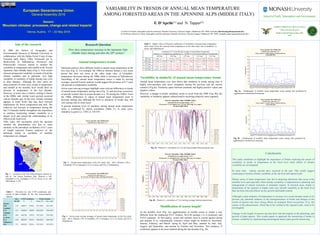
At the monthly level (Fig. 5a), agglomeration of months seems to cluster a way
different from the traditional D-J-F (winter), M-A-M (spring), J-L-A (summer), and
S-O-N (autumn). At first glance, winter and summer seem to extend against spring
and autumn. If so, schematically (warmer) winter might be formed by December,
January, February, and March; spring by April and May; summer by June, July,
August, and September; and autumn by October and November. This tendency, if
confirmed, appears to be more marked during the last decades (Fig. 5b).
Fig. 4b – Pearson’s r correlation of 7-yrs moving averages between paired sites.
Fig. 5b – Dendrogram of monthly mean temperature series among sites produced by
agglomerative hierarchical clustering.
CORPO FORESTALE DELLO STATO
Ufficio Territoriale per la
Biodiversità di Pratovecchio (AR)
Italy
School of Earth, Atmosphere and Environment
Research Question
How does temperature increase in the Apennine Alps
(Middle Italy) during and after the 20th century?