1. Abstract
Summary
2
Previous works have looked at the influence of key atmospheric circulation
patterns on sea ice in the Antarctic in terms of the atmosphere’s seasonal
cycle. This study examines the influence of one of these atmospheric
patterns, the zonal wave three (ZW3), in terms of the sea ice’s seasons from
19792009 in order to better understand the response of the sea ice. An
index to represent the amplitude of the ZW3 was calculated using zonal
anomalies of 850 hPa geopotential heights taken from the ERAInterim
data set. Sea ice concentrations (SIC), taken from the Hadley Center sea ice
and sea surface temperature data set, were found to be significantly
positively correlated with the ZW3 index during the ice advance season
(March to August) in the Ross and Weddell Seas and off the Amery ice
shelf. These regions align with where cold, southerly flow associated with
the ZW3 are found. In the AmundsenBellingshausen Seas region, SIC was
found to be negatively correlated with the ZW3 index, which coincides
with where the warm, northerly flow of the wave is found in this region.
Regression analysis showed SIC to be significantly dependent upon the
ZW3 in parts of the Ross Sea, the ice edge in the Amundsen
Bellingshausen Seas and off the Amery ice shelf during ice advance season.
The results suggest that the ZW3 plays a role in the occurrence of the
observed sea ice trends in the Ross Sea, AmundsenBellingshausen Seas
(ABS), Weddell Sea and off the Amery ice shelf regions during the ice
advance season, the critical period for sea ice growth. The results also
demonstrate that reexamining the influence of relevant atmospheric
patterns on sea ice in terms of the ice’s seasonal cycles could allow firmer
connections to be established between sea ice trends and atmospheric
patterns.
Figure 1. a) Composite differences in the 850 hPa geopotential height of
positive minus negative ZW3 phases over the period 1979-2014. 10m ERA-
Interim winds for b) advance and c) retreat seasons averaged over the period
1980-2013.
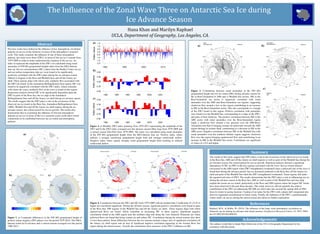
Figure 2. a) Monthly ZW3 index spanning from 1979-2013 representing the amplitude of the
ZW3 and b) the ZW3 index averaged over the advance season (Mar-Aug) from 1979-2009 and
c) retreat season (Oct-Feb) from 1979-2009. The index was calculated using zonal anomalies
at the 850 hPa geopotential height from the ERA-Interim data set. Positive index values
indicate a strongly meridional geopotential height field and stronger north/south airflow.
Negative index values signify strongly zonal geopotential height field resulting in reduced
north/south airflow.
Figure 3. Correlations between zonal anomalies at the 850 hPa
geopotential height and sea ice extent (SIE) during advance season for
the a) Ross/Amundsen b) ABS and c) Weddell Sea sectors. SIE in the
Ross/Amundsen sea sector is negatively correlated with zonal
anomalies over the ABS and Ross/Amundsen sea regions, suggesting
clockwise flow around a low in this region contributing to an increase
in SIE in the Ross/Amundsen sector. This also corresponds to a trough
of the ZW3 found in this region. Positive correlation with anomalies
were found over the Weddell Sea, corresponding to a ridge of the ZW3,
and parts of East Antarctic. The positive correlation between SIE in the
ABS sector with zonal anomalies over the Ross/Amundsen region
imply a clockwise flow around a low pressure over the ABS-Ross/
Amundsen area that is bringing warmer air polewards towards the ABS
region through its eastern flank, contributing to a decrease in SIE in the
ABS sector. Negative correlation between SIE in the Weddell Sea with
zonal anomalies over the southern Atlantic region suggests clockwise
flow over the region bringing equatorward flow and contributing to an
increase in SIE in the Weddell Sea sector. Correlations are significant
at values of ± 0.4 and higher.
Figure 4. Correlations between the ZW3 and SIC from 1979-2009 with de-trended data. Coefficients of ± 0.35 or
higher are considered significant. During the advance season, significant positive correlations were found in parts
of the Ross Sea, NW regions of the Weddell Sea and off the Amery ice shelf. These regions align with where
equatorward flows are found, which contribute to increasing SIC in these regions. Significant negative
correlations found in the ABS region near the northern edge and along the west Antarctic Peninsula are where
poleward flows are found that bring warmer air and reduce SIC. Correlations during the retreat seasons also show
a wave three pattern. Some differences between the two seasons include a larger area of significant correlation off
the Amery ice shelf region and an area of significant negative correlation appearing in the western Ross Sea
region during the retreat season. Overall, the correlations show presence of the ZW3’s influence on SIC.
The results of this study suggest that ZW3 plays a role in the occurrence of the observed sea ice trends
in the Ross Sea, ABS and off the Amery ice shelf regions as well as parts of the Weddell Sea during the
ice advance season, the critical period for sea ice growth. Statistical analyses showed a significant
dependence of SIC on ZW3 in the key regions associated with the wave. Sea ice extent reduced
(increased) in the ABS region when ZW3 strengthened (weakened) since a poleward arm of the wave is
found here during the advance period. Sea ice increased (reduced) in the Ross Sea, off the Amery ice
shelf and parts of the Weddell Sea when the ZW3 strengthened (weakened). These regions fall under
the equatorward arms of ZW3. The results demonstrate that the ZW3 plays a role in influencing sea ice
during the advance season in the Ross Sea, ABS as well as parts of the Weddell Sea and may help
explain the recent sea ice trends, particularly in the Ross and ABS regions where the largest SIC trends
have been observed in the past three decades. This study, however, did not quantify the relative
contribution of the ZW3 on influencing SIC/SIE nor did it take into account the spatial shift of ZW3
from its winter to spring location. Creation of an index for the ZW3 with a phase shift component also
deserves important consideration in future works. Finally, the influence of the ZW3, a predominantly
winter mode, on sea ice during the retreat season also deserves further exploration.
The In'luence of the Zonal Wave Three on Antarctic Sea Ice during
Ice Advance Season
Hana Khan and Marilyn Raphael
UCLA, Department of Geography, Los Angeles, CA.
Raphael, M.N., & Hobbs, W. (2014). The influence of the large‐scale atmospheric circulation on
Antarctic sea ice during ice advance and retreat seasons. Geophysical Research Letters, 41, 5037–5045.
doi:10.1002/2014GL060365.
a)
c)
The authors would like to thank Matt Zebrowski of the UCLA Geography Department for his
assistance with this poster.
a) b)
c)
References
Acknowledgements
a)
b) c)
b)