NSF Supported Facts on 2011 Tohoku Earthquake & Tsunami
1. This work is supported by the National Science Foundation’s
Transforming Undergraduate Education in STEM program within the
Directorate for Education and Human Resources (DUE-1245025). Questions, contact education-AT-unavco.org
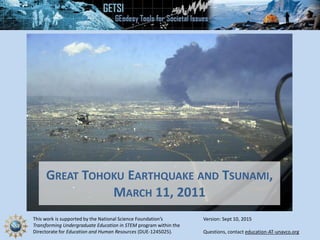
GREAT TOHOKU EARTHQUAKE AND TSUNAMI,
MARCH 11, 2011
Version: Sept 10, 2015
2. TOHOKU EARTHQUAKE & TSUNAMI FACTS
• Magnitude 9.0 – March 11, 2011
• Societal preparation had
been for ~Mag 8
• ~20,000 people dead or
missing
• Fukushima nuclear disaster
• >1 million buildings
damaged or destroyed
• In 2015, >200,000 people
still displaced
3. HAZARD VERSUS RISK
• Hazard: Physical process that has the potential
to cause loss or damage to something valued
by an individual or a society
• Risk: Likelihood of asset or life damage/loss
due to an extreme event
6. FINANCIAL COST OF DAMAGE
$0 $20 $40 $60 $80 $100 $120 $140
Other
Utilities
Infrastructure
Buildings
Total = >$200 billion (16.9 trillion yen)
Damage estimate as of June 2011
Subsequent estimates are as high as $300 billion
Source: Cabinet Office of Japan, 24 June 2011
11. COSEISMIC DISPLACEMENTS
Horizontal Vertical
Preliminary highly smoothed model of coseismic slip for the 11 March main shock. Red and yellow vectors show horizontal (left) and vertical (right)
predicted and observed displacements respectively. Model is constrained by both GPS displacements and 12 DART buoy tsunami records. GPS
offsets are derived from 5 minute epoch time series processed by the ARIA team at JPL and Caltech. Displacements due aftershocks have been
isolated and removed. This model was generated by Caltech Tectonics Observatory as part of the ARIA project. All original GEONET RINEX data
provided to Caltech by the Geospatial Information Authority (GSI) of Japan. (https://www.unavco.org/highlights/2011/M8.9-Japan.html)
12. REFLECTING ON WHAT YOU HAVE LEARNED
• What surprised you most in what you have
learned about the 2011 Tohoku Japan
Earthquake?
• What else would you like to know about this
earthquake?
Editor's Notes
Image from "SH-60B helicopter flies over Sendai" by U.S. Navy photo. This Image was released by the United States Navy with the ID 110312-N-0000X-003 (next). Licensed under Public Domain via Commons - https://commons.wikimedia.org/wiki/File:SH-60B_helicopter_flies_over_Sendai.jpg#/media/File:SH-60B_helicopter_flies_over_Sendai.jpg
It is critical that students understand the difference between hazard and risk. Societies do not have control over the geohazards that exist. However, decisions we make most definitely determine the risk to our valued assets (including human life).
Modified from InTeGrate module “Natural Hazards and Risk” Unit 1
http://serc.carleton.edu/integrate/teaching_materials/hazards/unit1.html
Show the class one of the better videos that students find, which depicts ongoing damage from the tsunami or earthquake.
Example:
https://www.youtube.com/watch?v=pTtneXyhoPA&list=PLNspHwmzscYE2-cUkOfHo92ATHZUqqsPH&index=2&feature=iv&src_vid=j0YOXVlPUu4&annotation_id=annotation_1885845763
Ask them to identify what things they see are the HAZARD and which are the RISK.
If you choose, you can come out of presentation mode and type what students say directly into the pptx OR write on a nearby chalk or white board.
Types of answer to look for:
Hazard (the main process being observed): in most cases this will be a visual of the tsunami itself or possibly earthquake shaking
Risk: the placement of the city where it is, the way the city and maybe sea wall were constructed, the mobility of boats and other items being moved, the strength of the buildings, etc.
Potential questions:
How many people were exposed to shaking that has the potential to cause moderate to heavy damage to resistant structures?
How is this illustrated in the figure in the upper right?
All images from USGS PAGER alert: http://earthquake.usgs.gov/earthquakes/pager/events/us/c0001xgp/index.html, in public domain
Potential questions:
Start by NOT showing the graph and asking students to predict the most costly type of damage from the earthquake and tsunami.
Discuss briefly and then show the graph. Were they correct or not?
Data from Cabinet Office of Japan.
Figure modified from http://www.bbc.com/news/world-asia-17219008
Additional details can be found at https://en.wikipedia.org/wiki/Aftermath_of_the_2011_T%C5%8Dhoku_earthquake_and_tsunami#Economic_impact
Potential questions:
How many times higher than natural background radiation was the average for the 20 km evacuation area?
What type of health effects could have occurred for unprotected people on the Fukushima plant grounds?
Left image: "Towns evacuated around Fukushima on April 11th, 2011" by User:Mayhewderivative work: derived from original work by User:Lincun - File:Iitate_vs_Fukushima_evacuation_zones_large.svgderivative work: original source is File:Iitate_in_Fukushima_Prefecture_Ja.svg. Licensed under CC BY-SA 3.0 via Commons - https://commons.wikimedia.org/wiki/File:Towns_evacuated_around_Fukushima_on_April_11th,_2011.png#/media/File:Towns_evacuated_around_Fukushima_on_April_11th,_2011.png
Right image: "Fukushima7" by Rama C. Hoetzlein (Rchoetzlein at en.wikipedia) - Own work. Released in public domain.. Licensed under CC0 via Commons - https://commons.wikimedia.org/wiki/File:Fukushima7.png#/media/File:Fukushima7.png
The earthquake occurred along the bounding fault between the Pacific and Amur (Eurasian) plates.
Potential questions:
What sort of plate boundary is this? What are at least two lines of evidence for this?
Source: USGS event poster: http://earthquake.usgs.gov/earthquakes/eqarchives/poster/2011/20110311.php, in public domain
Potential questions:
How many prefectures accounted for most of the life loss?
Where are the highest observed tsunami heights?
When did the tsunami arrive at these locations?
Tsunami due largely to static (long-term) displacements.
Left image source: http://earthquake-report.com/japan-march-11-tsunami/ (Permission for non-commercial use)
Right image source: https://www.ngdc.noaa.gov/hazard/img/2011_0311.jpgin public domain
Seismic waves (and GPS displacements) can be used to model the slip on the fault surface at depth.
Potential questions:
What was the maximum slip?
What was the length of the portion of fault that slipped in the strike direction? Use the 1m contour to define the main slip patch.
What was the length of the portion of fault that slipped in the dip direction? Use the 1m contour to define the main slip patch.
What was the area of the fault that slipped?
Note that moment = slip * Area * stiffness of the surrounding rock. This is a measure of the size of the earthquake. The moment magnitude is based on the log of the moment.
Source: http://earthquake.usgs.gov/earthquakes/eqinthenews/2011/usc0001xgp/finite_fault.php, in public domain
In addition to shaking the ground also experienced long-term (static) displacement.
Potential questions:
How far, and in what direction, did the east coast of Japan, near Sendai, move horizontally?
How far, and in what direction, did the east coast of Japan, near Sendai, move vertically?
Images source: UNAVCO https://www.unavco.org/highlights/2011/M8.9-Japan.html
These questions are included to help students reflect on their learning process. Reflection on learning (or “metacognition”) is a critical component of solidifying learning.