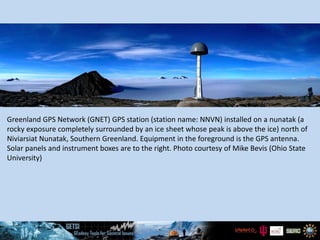
1. Greenland GPS Network (GNET) GPS station (station name: NNVN) installed on a nunatak (a
rocky exposure completely surrounded by an ice sheet whose peak is above the ice) north of
Niviarsiat Nunatak, Southern Greenland. Equipment in the foreground is the GPS antenna.
Solar panels and instrument boxes are to the right. Photo courtesy of Mike Bevis (Ohio State
University)
2. GNET GPS station (name: HJOR) in SE
Greenland. GPS antenna is visible in the photo.
Site was constructed in 2007. Photo by Dana
Caccamise, Ohio State University.
3. GNET GPS station (name: PLPK) on Pilgupik
Island, SE Greenland. The glacier visible across
the water is Laube Glacier. Photo by Michael
Willis, Cornell University.
4. Landsat image of Helheim Glacier, 2006. The bright, reflective surface on the right side of the
image is called an ice melange—a composite of sea ice and icebergs.
5. Left: Digital elevation model (DEM) of Helheim Glacier, 2006. Red star represents study
location for ice elevation data. Brown represents the eleavation of the land surface.
Blue represents elevation of the ice and ocean (Stearns and Hamilton, 2007.)
Right: Vertical displacement (thinning) of the surface of Helheim Glacier from 1995-
2012 derived from repeat satellite and airborne altimetry. Notice that elevation changes
(Csatho et al., 2014).
6. Vertical displacement of GPS receiver located on bedrock adjacent to Helheim Glacier from
2000-2011 (after Bevis et al., 2012).
7. Elevation of the surface of Helheim Glacier from 2000-2012 derived from repeat satellite and
airborne altimetry (Csatho et al., 2014).
8. This work is supported by the National Science Foundation’s Transforming Undergraduate Education in STEM program within the
Directorate for Education and Human Resources (DUE-1245025).
9. Left: 2010 melting day anomaly map for Greenland. The shading on the map illustrates the number of extra days of melting in 2010 relative to the average number of
melting days considering the 1979-2009 data. Students will be focusing on SE Greenland in Unit 4. NASA Earth Observatory image by Robert Simmon, based on data from
Marco Tedesco, City College of New York.
Right: 2010 uplift anomaly and melting day map for selected Greenland GPS stations. The green arrows illustrate uplift in 2010 relative to the trend from site installation
date (~2000 for most sites). The shading on the map illustrates the number of extra days of melting in 2010 relative to the average number of melting days considering the
1979-2009 data. Students will be focusing on SE Greenland in Unit 4. From Bevis et al., 2012.
Editor's Notes
Greenland GPS Network (GNET) GPS station (station name: NNVN) installed on a nunatak (a rocky exposure completely surrounded by an ice sheet whose peak is above the ice) north of Niviarsiat Nunatak, Southern Greenland. Equipment in the foreground is the GPS antenna. Solar panels and instrument boxes are to the right. Photo courtesy of Mike Bevis (Ohio State University)
GNET GPS station (name: HJOR) in SE Greenland. GPS antenna is visible in the photo. Site was constructed in 2007. Photo by Dana Caccamise, Ohio State University.
GNET GPS station (name: PLPK) on Pilgupik Island, SE Greenland. The glacier visible across the water is Laube Glacier. Photo by Michael Willis, Cornell University.
Landsat image of Helheim Glacier, 2006. The bright, reflective surface on the right side of the image is called an ice melange—a composite of sea ice and icebergs.
Left: Digital elevation model (DEM) of Helheim Glacier, 2006. Red star represents study location for ice elevation data. Brown represents the elevation of the land surface. Blue represents elevation of the ice and ocean (Stearns and Hamilton, 2007.) Right: Vertical displacement (thinning) of the surface of Helheim Glacier from 1995-2012 derived from repeat satellite and airborne altimetry. Notice that elevation changes (Csatho et al., 2014).
Csatho, Beata M., Anton F. Schenk, Cornelis J. van der Veen, Gregory Babonis, Kyle Duncan, Soroush Rezvanbehbahani, Michiel R. van den Broeke, Sebastian B. Simonsen, Sudhagar Nagarajan, and Jan H. van Angelen. 2014. Laser altimetry reveals complex pattern of Greenland Ice Sheet dynamics. PNAS 2014 111 (52) 18478-18483, doi:10.1073/pnas.1411680112
Stearns, Leigh, and Gordon S. Hamilton. 2007. Rapid volume loss from two East Greenland outlet glaciers quantified using repeat stereo satellite imagery. Geophysical Research Letters. Vol. 34, L05503, doi:10.1029/2006GL028982.
PNAS (Proceedings of the National Academy of Science) allows reuse of published figures for non-commercial and educational uses. (http://www.pnas.org/site/aboutpnas/authorfaq.xhtml). Geophysical Research Letters allows reuse of a single figure from an article for non-commercial and education uses.
Vertical displacement of GPS receiver located on bedrock adjacent to Helheim Glacier from 2000-2011 (after Bevis et al., 2012).
Bevis, Michael, John Wahr, Shfaqat A. Khan, Finn Bo Madsen, Abel Brown, Michael Willis, Eric Kendrick, Per Knudsen, Jason E. Box, Tonie van Dam, Dana J. Caccamise II, Bjorn Johns, Thomas Nylen, Robin Abbott, Seth White, Jeremy Miner, Rene Forsberg, Hao Zhou, Jian Wang, Terry Wilson, David Bromwich, and Olivier Francis. 2012. Bedrock displacements in Greenland manifest ice mass variations, climate cycles and climate change. PNAS 2012 109 (30) 11944-11948, 2012, doi:10.1073/pnas.1204664109
PNAS (Proceedings of the National Academy of Science) allows reuse of published figures for non-commercial and educational uses. (http://www.pnas.org/site/aboutpnas/authorfaq.xhtml).
Elevation of the surface of Helheim Glacier from 2000-2012 derived from repeat satellite and airborne altimetry (Csatho et al., 2014).
Csatho, Beata M., Anton F. Schenk, Cornelis J. van der Veen, Gregory Babonis, Kyle Duncan, Soroush Rezvanbehbahani, Michiel R. van den Broeke, Sebastian B. Simonsen, Sudhagar Nagarajan, and Jan H. van Angelen. 2014. Laser altimetry reveals complex pattern of Greenland Ice Sheet dynamics. PNAS 2014 111 (52) 18478-18483, doi:10.1073/pnas.1411680112
PNAS (Proceedings of the National Academy of Science) allows reuse of published figures for non-commercial and educational uses. (http://www.pnas.org/site/aboutpnas/authorfaq.xhtml).
Students use this figure to plot sea level change in SE Greenland from 2000-2011 due to ice discharge from Helheim and bedrock rebound from removal of ice.
Left: 2010 melting day anomaly map for Greenland. The shading on the map illustrates the number of extra days of melting in 2010 relative to the average number of melting days considering the 1979-2009 data. Students will be focusing on SE Greenland in Unit 4. NASA Earth Observatory image by Robert Simmon, based on data from Marco Tedesco, City College of New York.
Right: 2010 uplift anomaly and melting day map for selected Greenland GPS stations. The green arrows illustrate uplift in 2010 relative to the trend from site installation date (~2000 for most sites). The shading on the map illustrates the number of extra days of melting in 2010 relative to the average number of melting days considering the 1979-2009 data. Students will be focusing on SE Greenland in Unit 4 (Bevis et al., 2012).
PNAS (Proceedings of the National Academy of Science) allows reuse of published figures for non-commercial and educational uses. (http://www.pnas.org/site/aboutpnas/authorfaq.xhtml).