Downloaded 17 times
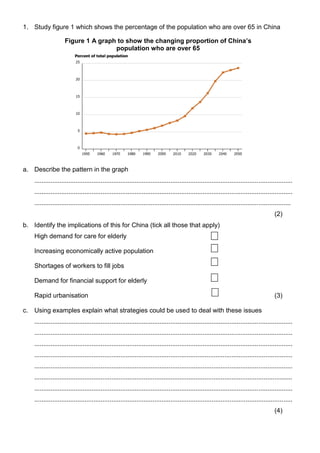


Figure 1 shows the increasing percentage of China's population that is over 65 years old. This aging population will lead to high demand for elderly care, a shortage of workers, and increased need for financial support of the elderly. China could deal with these issues by implementing strategies to support its aging population. Figure 2 shows that worker remittances, or money sent home by migrants, has greatly increased for developing countries from 1980 to 2002. One negative impact of emigration on source countries is a loss of skilled workers. Figure 3 depicts migration routes from Africa to Europe. It shows increased movement from Africa to northern coastal areas like Italy and Greece. Conflict, poverty, and desire for better opportunities likely drive this migration, but