A robust, agnostic molecular biosignature based on machine learning

The search for definitive biosignatures—unambiguous markers of past or present life—is a central goal of paleobiology and astrobiology. We used pyrolysis–gas chromatogra-phy coupled to mass spectrometry to analyze chemically disparate samples, including living cells, geologically processed fossil organic material, carbon- rich meteorites, and laboratory- synthesized organic compounds and mixtures. Data from each sample were employed as training and test subsets for machine- learning methods, which resulted in a model that can identify the biogenicity of both contemporary and ancient geologically processed samples with ~90% accuracy. These machine- learning methods do not rely on precise compound identification: Rather, the relational aspects of chromatographic and mass peaks provide the needed information, which underscores this method’s utility for detecting alien biology.

Recommended
Recommended
More Related Content
Similar to A robust, agnostic molecular biosignature based on machine learning
Similar to A robust, agnostic molecular biosignature based on machine learning (20)
More from Sérgio Sacani
More from Sérgio Sacani (20)
Recently uploaded
Recently uploaded (20)
A robust, agnostic molecular biosignature based on machine learning
- 1. PNAS 2023 Vol. 120 No. 41 e2307149120 https://doi.org/10.1073/pnas.2307149120 1 of 7 RESEARCH ARTICLE | Significance We report a significant advance to one of the most important problems in astrobiology—the development of a simple, reliable, and practical method for determining the biogenicity of organic materials in planetary samples, both on other worlds and for the earliest traces of life on Earth. We have developed a robust method that combines pyrolysis GC- MS measurements of a wide variety of terrestrial and extraterrestrial carbonaceous materials with machine- learning- based classification to achieve ~90% accuracy in the differentiation between samples of abiotic origins vs. biotic specimens, including highly- degraded, ancient, biologically- derived samples. Such discrimination points to underlying “rules of biochemistry” that reflect the Darwinian imperative of biomolecular selection for function. Author contributions: H.J.C. and R.M.H. designed research; H.J.C., G.D.C., and S.E. performed research; G.D.C. and R.M.H. contributed new reagents/analytic tools; H.J.C., G.H., A.P., M.L.W., S.E., and R.M.H. analyzed data; and H.J.C., G.H., A.P., M.L.W., G.D.C., S.E., and R.M.H. wrote the paper. The authors declare no competing interest. This article is a PNAS Direct Submission. Copyright © 2023 the Author(s). Published by PNAS. This article is distributed under Creative Commons Attribution- NonCommercial- NoDerivatives License 4.0 (CC BY- NC- ND). 1 To whom correspondence may be addressed. Email: rhazen@carnegiescience.edu. This article contains supporting information online at https://www.pnas.org/lookup/suppl/doi:10.1073/pnas. 2307149120/- /DCSupplemental. Published September 25, 2023. EARTH, ATMOSPHERIC, AND PLANETARY SCIENCES BIOCHEMISTRY A robust, agnostic molecular biosignature based on machine learning H. James Cleaves IIa,b,c , Grethe Hystadd , Anirudh Prabhua , Michael L. Wonga,e , George D. Codya , Sophia Economonf , and Robert M. Hazena,1 Edited by Roger Summons, Massachusetts Institute of Technology, Cambridge, MA; received April 29, 2023; accepted July 17, 2023 The search for definitive biosignatures—unambiguous markers of past or present life—is a central goal of paleobiology and astrobiology. We used pyrolysis–gas chromatogra- phy coupled to mass spectrometry to analyze chemically disparate samples, including living cells, geologically processed fossil organic material, carbon- rich meteorites, and laboratory- synthesized organic compounds and mixtures. Data from each sample were employed as training and test subsets for machine- learning methods, which resulted in a model that can identify the biogenicity of both contemporary and ancient geologically processed samples with ~90% accuracy. These machine- learning methods do not rely on precise compound identification: Rather, the relational aspects of chromatographic and mass peaks provide the needed information, which underscores this method’s utility for detecting alien biology. biosignatures | organic chemistry | machine learning | taphonomy | carbonaceous meteorites Is there something fundamentally different about the chemistry of life compared to the chemistry of the inanimate world? Are there “chemical rules of life” that influence the diversity and distribution of biomolecules? Can we deduce those rules and use them to guide our efforts to model life’s origins or to detect subtle signs of life on other worlds? Here, we report research predicated on the hypothesis that deeply rooted aspects of bio chemistry differ fundamentally from abiotic chemistry. Unlike molecules in nonliving systems, life’s organic molecular building blocks have been selected for their function, including their ability to store and replicate information, efficiently gather energy and material from the environment, build and maintain their own structures, control their environments, and more (1, 2). Synthesizing such biomolecules requires energy and infor mation—precious commodities in a competitive Darwinian world. The diversity and distribution of organic molecules in living systems are expected to be different (though perhaps subtly so) from organic molecular suites produced by abiotic processes. The evolutionary selection for function should lead to different frequency distributions of biotic molecules compared to what emerges from purely abiotic processes in which such entailed processes do not arise or operate. This phenomenon is already evident: The sets of molecules found in carbonaceous meteorites, prebiotic simulation experiments, organic geopolymers (e.g., coal, oil, kero gen), and organisms themselves can all be distinguished in various ways, for example, via type, carbon isotope composition, and/or chirality of components such as amino acids (3). In terms of thermodynamics, the efficient coupling of physical processes to the per formance of work and energy dissipation, which also results in the construction of com pounds that spontaneously self- assemble to perform the same function, likely requires some structural cohesion, e.g., the formation of a manifold (like a steam or combustion engine, or a cell) that concertedly focuses the work in question (4). These coupling pro cesses connect planetary energy flow to the organic molecules it produces. Consequently, the resulting molecules retain information about the processes that made them. Which suites of molecules enable open- ended evolution? Terrestrial biology has evolved several ways to couple work and system- produced structure, resulting in recognizable core cellular motifs, for example chemiosmosis coupled to ATP production (5), which is further coupled to cytosolic energy production. Such cellular reaction networks may thus be indicators of life in general, in that cells are the fundamental organizing aspects of physical material that enable work to be done in a heritable manner. Biological systems on other worlds might not produce identical, or even broadly similar, suites of organic molecules to those found in modern terrestrial biology. Rather, we suggest that even alien biochemical systems that might differ significantly from Earth’s biochemistry would still display molec ular frequency distributions that are distinct from those of background abiotic synthetic processes (6). For example, it is plausible that life on any world will display a systematic Downloaded from https://www.pnas.org by Sergio Sancevero on October 15, 2023 from IP address 177.173.237.248.
- 2. 2 of 7 https://doi.org/10.1073/pnas.2307149120 pnas.org skew toward producing greater quantities of a few highly func tional compounds compared to abiotic synthesis, which would represent a potentially universal feature of living systems generated by systemic feedback catalysis. We suggest that these types of dif ferences between biotic and abiotic molecular suites can be detected and quantified using our techniques. We used a robust, space flight- ready analytical method—pyrol ysis gas chromatography coupled to electron impact ionization mass spectrometry (Pyr- GC- EI- MS)—for molecular analyses of varied complex organic mixtures (complex in terms of the number of components in the mixture, not necessarily in terms of the structural complexity of the individual molecules). We couple these measurements with mathematical modeling and machine learning to characterize the distribution of organic molecular mix tures from other worlds or early Earth, including molecules from carbonaceous meteorites, organic residues from paleozoic fossils, or carbon- bearing black cherts from Earth’s Archean Eon. This approach demonstrates robust, reproducible, and unambiguous differences in the distributions of organic molecules derived from living vs. nonliving systems. At a deeper level, we speculate that the evolution of biological mechanisms to manufacture functional molecules may be fundamentally different from undirected syn thesis in abiotic systems—a motivation for developing biosigna tures that might reveal underlying rules of biochemistry. The Nature of Biosignatures A biosignature in the context of astrobiology is any substance or phenomenon that provides diagnostic evidence of past or present life (7–12). Biosignatures can range across both temporal and spatial reference frames and may take the form of individual (bio)markers or relational aspects among multiple measurable phenomena. Of special importance in the context of the search for life on other worlds is the concept of “agnostic biosignatures,” which are attrib utes of a system that point to a biosphere, but that are not idiosyn cratic properties resulting from the biochemistry of familiar terrestrial organisms (8, 13). Various biosignatures have been proposed (11). Easily recog nized biosignatures include body fossils and other biologically deposited objects at scales from microns to kilometers, such as shells, teeth, and bones, but also microbial mats, tracks and trails, colonial structures such as stromatolites and reefs, concretions, and cells preserved in fine- grained rock (14, 15). Chemical and isotopic biosignatures have been invoked in numerous terrestrial samples, with distinctive distributions of carbon, nitrogen, sulfur, and/or iron isotopes receiving special attention (e.g., refs. 16 and 17). In this context, molecular biosignatures hold special promise. In some instances, prior researchers have proposed the presence of a specific molecule or group of molecules as a plausible biosig nature (18); for example, specific genetic polymers such as DNA (19), lipids (20), or certain collections of homochiral molecules (21). Similarly, various atmospheric molecules that purportedly result mainly from metabolic processes have also been cited as possible biosignatures (22, 23). A complementary strategy for identifying agnostic biosignatures is to examine collective attributes of multiple sample components, including minerals and molecules. For example, distributions of minerals on Earth, as represented by network analysis (24) and statistical analyses of mineral diversity and distribution (25), have been suggested to reflect the influence of the biosphere. Likewise, Wong and coworkers (26) have applied network analysis to atmos pheric reaction networks to identify patterns that differentiate living and nonliving worlds. Recent efforts to identify collective molecular biosignatures have also focused on the distribution of monomer abundances (27), the topologies of organic molecular reaction networks (28), and relative distributions and abundances of unassigned features in complex mass spectra (29). Cronin and colleagues have also recently explored the molecular complexity of sample components as a potential biosignature (30, 31). We here propose a complementary strategy based on machine- learning analysis of the higher- dimensional relationships in suites of mol ecules as analyzed by Pyr- GC- EI- MS, which is currently deployed as an analytical technique on various Solar System exploration missions (32–38). Abiotic/Biotic Discrimination Our method for molecular biosignature detection involved three steps: (1) Collection of 134 diverse carbon- bearing samples (SI Appendix, Table S1). Abiotic samples include natural molecular suites from carbonaceous meteorites, as well as laboratory synthe sis experiments and a number of pure synthetic chemicals, which serve as an important baseline of molecular complexity. Modern biotic samples were obtained from varied organisms, and a range of taphonomic samples such as fossil leaves and wood, fossil fuels (coal, petroleum, asphaltum, and oil shales), and more ancient carbon- bearing sediments. (2) Subjecting each sample to Pyr- GC- EI- MS (SI Appendix and Analytical Methods). Pyr- GC- EI- MS has already been adapted for spaceflight missions (32–38) and enables rapid organic sample introduction from mineral matrices directly to a GC instrument with little to no sample preparation. Because pyrolysis products rapidly combine to generate compounds not present in the original sample, the datasets generated are highly complex and do not map 1:1 to the original components of the sample. This aspect of Pyr- GC- EI- MS analysis motivates the machine learning approach that we employ below. (3) Training random forest machine- learning models using three- dimensional chromatographic retention time/mass to charge ratio/intensity data from each sample analysis (SI Appendix and Machine- Learning Methods). In this work, chroma tographic retention time is also called scan number, as we measure when a particular feature arises in the analysis. In this Pyr- GC- EI- MS workflow, volatile compounds generated by pyrolysis are separated by GC and further subjected to EI- MS, which provides significant structural information based on fragmentation patterns (39), especially when these data can be compared with EI- MS libraries (40). After evaluating Pyr- GC- EI- MS features in all 134 samples, the random forest model correctly predicted the biogenicity of samples with ~90% accuracy. Thus, the generalized testing error using nested cross- validation (CV) was 10.4% with an area under the receiver operating characteristic curve of 91.2%. The 20 most important features were selected based on the Gini splitting index for Principal Component Analysis (PCA) plots— an index that provides a measure of variance that highlights how often a randomly chosen element of a decision tree is misclassified (41). The highest scoring features on the Gini splitting index were the variables most relevant for predicting discrimination. While the influence of the selected set of attributes has yet to be fully elucidated, the extent to which molecular distributions in abiotic and biotic samples are demonstrably different is evident from summed three- dimensional representations of the data from sub sets of samples, for example, carbonaceous meteorite samples vs. microbial communities (Fig. 1 A and B, respectively). Fig. 2 shows Downloaded from https://www.pnas.org by Sergio Sancevero on October 15, 2023 from IP address 177.173.237.248.
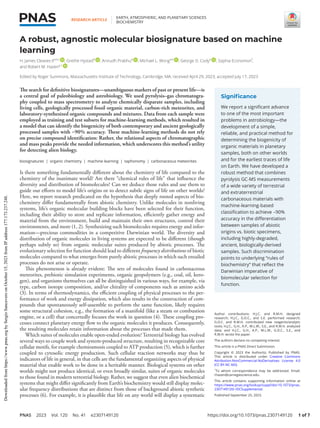
- 3. PNAS 2023 Vol. 120 No. 41 e2307149120 https://doi.org/10.1073/pnas.2307149120 3 of 7 the PCA plot of the training data with the scores of the test data projected into the same PCA space as the scores of the training data. The scales of the test data were obtained from the mean and SD of the training data. The first two principal components explain ~ 54.9% of the variation in the training data (Fig. 2). Discussion We analyzed collective molecular distributions from varied abiotic, biological, and taphonomically altered biological mixtures of organic molecules to demonstrate clear differences between suites of organic molecules synthesized by life vs. those produced abiot ically. Importantly, we find that signs of biogenicity are preserved despite extensive organic maturation, in some instances over peri ods of hundreds of millions of years. What molecular characteristics might contribute to the observed differences among abiotic, modern living, and taphonomically altered specimens? We explored the products of a variety of abiotic reactions that combine the diversity- generating properties of sugar degradation (e.g., the formose reaction) with the diversity- generating propensity of amines in combination with carbohy drates, such as Maillard reactions of diverse amino acids with glucose (42). Organic molecular suites derived from carbonaceous meteorites have been suggested to be derived from formose- like chemistry (43). Formose and Maillard reactions are known to producesignificantamountsofdiversepolarhetero- atom- containing products such as pyrazines, furans, and diketopiperazines (44)— compounds that are not typically well preserved in the geological record (45). Their detection can thus be considered as a marker for the recent abundance of sugars and amines, which could be derived from formose- like chemistry or from biological processes. Biochemistry also encompasses a wide variety of disparate chemistries in contemporary organisms (46). Regardless of the diversity of chemical processes that might enable life, the abundant coexistence of water- soluble and water- insoluble organic species appears to be one of life’s hallmarks. A significant fraction by dry weight of most terrestrial organisms is composed of sugar- derived compounds, including cellulose, glycogen, chitin, and ribose and deoxyribose in nucleic acids (47). These species produce charac teristic pyrolysis products (including furans and pyrans), plus a peptidic fraction that produces other distinctive pyrolysis products (including pyrazines and Maillard- like cross products with the sugar- derived pyrolysis product pool). Accordingly, we suggest that the coexistence of molecules of diverse polarity in detectable quantities points to the existence of recent life or more generally the functional structural organization of cells. Most preserved biological geocarbon is composed of break down products of cell membrane and cell wall material, for example, in the form of petroleum and coal (48). Petroleum is generally thought to derive from thermal degradation of type I kerogen that arises from the algal biopolymers. Coal is mostly derived from the ligno- cellulosic biopolymers of plant vascular tissue; high- volatile bituminous coals have been transformed during diagenesis such that no molecular signatures of either lignin or cellulose remain. These degraded molecular suites tend to be derived from materials of lower water solubility—mole cules that point to cellular origins. The systematic differences between abiotic and biologically derived materials suggest possible underlying reasons for the robust discriminators we find using Pyr- GC- EI- MS data. Chr omatographic retention time on any given solid GC support can be related via a Kovats index, which helps to normalize compound volatility and polarity with retention time (49). Thus, material derived from cells will have a nonpolar component derived from cell membrane/wall material that elutes late chromatographically, as well as a polar cytoplasmic component that elutes early (depend ing on the chromatographic matrix). Samples exhibiting both types of chromatographically- behaving materials are typically derived from cells, which produce both polar and nonpolar com pounds in a coordinated manner. In contrast, abiotic diversity- generating reactions that produce both polar and nonpolar com pounds do so in an uncoordinated fashion such that there will be a skewed balance between the two types of materials. It is unlikely that both polar and nonpolar compounds would occur in com parable ratios because no known abiotic processes produce bal anced amounts of nonpolar products in the absence of polar organics. As an example, while nonpolar, heteroatom- poor mate rial is a common convergence point for aged organic material from meteorites, such material is easily distinguishable from aged bio logical deposits such as coal and petroleum because these types of materials preserve observable polar molecular irregularities, such as even- odd disparities in fatty acids and other hydrocarbons. Even–odd disparities in alkanes and fatty acids tend to disappear as oil matures through diagenetic “smoothing.” Consequently, even–odd characteristics provide a measure of an oil sample’s age. Fig. 1. Combined three- dimensional Pyr- GC- EI- MS data for complex organic mixtures in carbonaceous meteorites (A) and microbial samples (B). These graphs display peak intensities (vertical scale, normalized to the highest peak intensity) for 3,000 elution time bins (right- hand scale) and their mass spectra over 150 m/z bins (left- hand scale). Green circles with vertical “stems” do not represent intensity values, but rather features the machine- learning algorithm recognizes as important discriminants among samples. Downloaded from https://www.pnas.org by Sergio Sancevero on October 15, 2023 from IP address 177.173.237.248.
- 4. 4 of 7 https://doi.org/10.1073/pnas.2307149120 pnas.org Implications Prospects for Analyzing Samples of Uncertain Biogenicity. Our method can potentially be used to resolve the biogenicity of data already in hand. An important example is the 3.5 Ga Apex chert from the Pilbara Craton in Western Australia, whose purported biogenicity has evoked significant debate (50, 51). In addition, samples measured by the Pyr- GC- MS instruments on the Mars Viking lander and the Curiosity rover (34, 43, 52) deserve new evaluation. While our method must first be calibrated to the specific thermal ramping and maximum temperature conditions of those instruments, these and other machine- learning methods hold promise for the evaluation of the biogenicity of samples of extraterrestrial provenance before they are returned to Earth (53). Of special interest in this regard is the possible role of environmental chemicals, such as perchlorate on Mars (54), as well as radiation- altered molecular suites (55), which might significantly influence the properties of the resulting molecular mixtures. Fig. 2. Grouping of samples according to the machine- learning methods explored here. Biologically derived samples (green/blue) are distinguished from abiotic samples (orange). Taphonomically altered biological samples (blue) lie along a trend distinct from that of contemporary biological samples (green). Downloaded from https://www.pnas.org by Sergio Sancevero on October 15, 2023 from IP address 177.173.237.248.
- 5. PNAS 2023 Vol. 120 No. 41 e2307149120 https://doi.org/10.1073/pnas.2307149120 5 of 7 Rules of Biochemistry. The identified systematic differences among the molecular distributions in abiotic and biotic samples suggest that biochemistry is intrinsically different from abiotic organic chemistry. Our working hypothesis is that biomolecules, unlike those in abiotic molecular suites (for example in a carbonaceous meteorite), are selected for function. That difference results in biomolecules that are more limited in number, and perhaps in some instances more complex in structure (30, 31), than organic molecules in abiotic suites. A deeper examination of the specific constellation of attributes identified in this study is a next step in testing this hypothesis. Despite the observation that taphonomic processes inevitably lead to loss of information (56–58), our method is able to distinguish ancient, geologically processed biotic samples from abiotic organics, while possibly providing a qualitative metric for degree of taphonomic degradation. In this regard, it is important to note that abiotic molecular systems are not intrinsically simple. For example, the suites of molecules extracted from the Murchison carbonaceous chondrite are remarkably complex in both their structural diversity and numerosity (59). There likely exist aspects of molecular complexity that differentiate living and nonliving systems, as explored by Cronin and coworkers (30, 31). However, the diagnostic high- dimensional differences between abiotic and biotic molecular distributions we document here do not lie in the complexity or diversity of individual analytes but rather in their relational properties. Our Proposed Biosignature is Agnostic. An important finding of this study is that abiotic, living, and taphonomic suites of organic molecules display well- defined clusters in their high- dimensional space, as illustrated in Fig. 2. At the same time, large “volumes” of this attribute space are unpopulated by either abiotic suites or terrestrial life. This topology suggests the possibility that an alien biochemistry might be recognized by forming its own attribute cluster in a different region of Fig. 2—a cluster that reflects the essential role in selection for function in biotic systems, albeit with potentially very different suites of functional molecules. Abiotic systems tend to cluster in a very narrow region of this phase space, which could in principle allow for easy identification of anomalous signals that are dissimilar to abiotic geochemical systems or known terrestrial life. Methods Sample Characterization. We assembled 134 carbon- bearing samples from variedabioticandbiotic,andsometimesambiguous,sources.Alistof thesesam- ples and their attributes is provided in SI Appendix,Table S1. Analytical Methods. Pyr- GC- EI- MS analyses were performed with a CDS 1000 pyroprobe (CDS Analytical, Inc., Oxford, PA) interfaced with a Hewlett- Packard 6890seriesgaschromatographinterfacedwithanAgilent5972quadrupolemass spectrometer.AnAgilent 30 M 5% phenyl polymethylsiloxane column was used for chromatographic separation.The GC oven temperature was programmed to holdat50°Cfor1min,thenincreasefrom50°Cto300°Catarateof 5°Cmin−1 , and then to remain at 300 °C for 15 min. Helium (UHP 5.5 grade) was used as the carrier gas, operating in constant flow mode. Approximately 1 mg samples were loaded into preashed quartz tubes (precombusted under air at 550 °C for 3 h),which were then inserted into the platinum filament- coil of the pyroprobe. Subsequently, the pyroprobe was inserted into the helium- filled interface and flashpyrolyzed(ramprate500°Cs−1 )to610°Candheldfor10s.Thepyrolysates were immediately swept onto the GC column by the He gas and analyzed. The sourcewasoperatedinelectronionization(EI)modewith70eVionizationenergy at 250 °C.The mass selective detector scan rate was 0.80 s/decade over a range of m/z 50 to 700, with an interscan delay of 0.20 s. In many Pyr- GC- EI- MS applications, the data output is compared to EI- MS libraries to identify specific molecular compounds. Available EI- MS libraries may comprehensively cover the compounds present in common terrestrial sam- ples seeking to find “analytes of interest” (e.g.,drugs,steroids,and pesticides). Estimates of organic isomerism,however, predict that the majority of possible stable low molecular weight organics are “as yet unknown or unsynthesized compounds” (60,61).Using our methodology,precise compound identification is useful but not necessary: Rather, relational aspects of chromatographic and mass peaks are of interest.This approach underscores this method’s utility for detecting alien biology, which also aligns with earlier concepts of relational biology (32, 62). We did not collect MS data for the first 2 min after injection to avoid over- loading the detector with small volatiles such as CO2 and H2O.In addition,since manyof thesampleswerecuratedindependentlyanddisplayedsignalsfromC16 (palmitic) and C18 (stearic) fatty acids which are common components of finger- printsand“slipagents”addedtoplasticsamplebagstokeepthemfromsticking together,we excluded the regions of the chromatograms after the region where these common contaminants elute.Note,however,there is still a contribution to the examined chromatographic complexity from derivatives of such compounds (forexample,straightandbranchedlong- chainalkanes,alkenes,andrearranged aldehydeandketonederivativesof thesespecies)thatcontributetotheprecutoff region’s molecular complexity.We found that there was little signal beyond m/z 200;thus,theregionconsideredinthecomputationalmethodswaslimitedfrom 2 to 35 min and m/z 50 to 200.Each sample was reduced to a two- dimensional matrix with 489,240 elements representing signal intensities as a function of massandretentiontime,althoughmanyof theintensityvalueswerezero(Fig.1). Machine- Learning Analysis. Wetrainedmachine- learningmodelsusingthree- dimensionalchromatographicretentiontime/mass- to- chargeratio/intensitydata from each sample. The data generated and analyzed in this manuscript can be found on the Open Science Framework repository titled “A robust molecular biosignature based on machine learning” (https://doi.org/10.17605/OSF.IO/ EMBH8). The code for the paper can be found at https://github.com/ghystad/ Machine_learning_and_preprocessing_pyr_GSMS_data/tree/master. All data, code, and materials used in the analysis are available to any researcher for pur- poses of reproducing or extending the analysis. Licenses for the data and code usage and relevant attribution information will be updated on the respective repositories. Here, peak intensity was normalized on a scale from 0 to 1, while time and mass/chargewereanalyzedascollectedin3,240scantimesteps(witheachscan representing 3 s) and one m/z increments over the range from m/z 50 to 200, respectively. Our machine- learning strategy allows identification of diagnostic sets of attributes of retention time and m/z values that highlight differences between abiotic and biotic samples. Our nested CV methods overcome the con- cern of overfitting to the training data. We also plan to improve upon the gen- eralization of our model in future work by focusing on Monte Carlo simulations, adding more samples to the training and test sets, and monitoring the change in test and training errors. Preprocessing. The134analyzedsamplesincluded59of bioticoriginand75of abioticorigin.Eachsamplewasrepresentedasatwo- dimensionalmatrix,where the rows and columns represent the scan numbers and m/z ratios, respectively, andtheentriesarethecorrespondingintensities.Foreachsampleandm/zvalue, we performed the preprocessing steps in the chromatographic direction, stabi- lizedthevarianceof theintensityvaluesbytakingthesquareroot,smoothedthe valuesbytakingthemovingaverageof itscurrentanditsimmediatefivenearest observations on each side,and subtracted the baseline,where the baseline esti- mation was based on the Statistics- sensitive Non- linear Iterative Peak- clipping algorithm (63), using the R- library, MALDIquant (64). Intensity values were normalized via min- max normalization (65),followed by peak detection in the chromatographic direction for each m/z ratio. Peaks were detected as local maxima above 4× signal to noise ratio, where the noise was estimated by calculating the median absolute deviation using the R- library, MALDIquant (64).After eliminating near- zero variance and strongly correlated features using the R- library caret (66), the data were reduced to 8,149 features, which are the detected combination of scan number and m/z values. These 134 Pyr- GC- MS data files are available at https://osf.io/emb- h8/?view_only=89695d38b8484af28dae80ce4de3b33c (DOI: 10.17605/ OSF.IO/EMBH8). Downloaded from https://www.pnas.org by Sergio Sancevero on October 15, 2023 from IP address 177.173.237.248.
- 6. 6 of 7 https://doi.org/10.1073/pnas.2307149120 pnas.org Model Choice. Of the various classification methods we explored, the random forest method quickly yielded the best results in terms of accurately distinguish- ing biotic from abiotic samples and thus was used to train the final model. The random forest method is an ensemble classification method that constructs a collection of decorrelated decision trees (67).There may be better methods and we are exploring the relative benefits of other methods for future publications. We used the random forest model from the R- library mlr3 (68). Model Validation. We used two validation strategies for the trained machine- learning model. First, the data were split into a training set of 95 samples and a test set of 39 samples using stratified random sampling, where the model was trained with parameter tuning on the training set using 10- fold CV. The final trained random forest model was subsequently applied to predict the biotic or abiotic origin of the test data. Second, we used nested CV (69) on all 134 sam- ples to gain an unbiased estimate of the predictive performance of the machine learning method.The nested CV used 10- fold CV in the inner loop and five- fold CV in the outer loop. The algorithm was terminated after 20 evaluations using random search. Data, Materials, and Software Availability.Thedatageneratedandanalyzedin thismanuscript[Pyr- GC- MSdatafiles(134files)]canbefoundontheOpenScience Framework repository titled “A robust molecular biosignature based on machine learning”(70).Thecodeforthepapercanbefoundat https://github.com/ghystad/ Machine_learning_and_preprocessing_pyr_GSMS_data/tree/master(71).Alldata, code,andmaterialsusedintheanalysisareavailabletoanyresearcherforpurposes of reproducing or extending the analysis. Licenses for the data and code usage and relevant attribution information are available on the respective repositories. ACKNOWLEDGMENTS. We thank Stuart Bartlett,Carol Cleland,and two anony- mous reviewers for valuable discussions and detailed reviews of an early version of this contribution. We also thank Editor Roger Summons for his careful and patient handling of the manuscript. We are especially grateful to John Saul for the donation of 80 of the samples employed in this study. Studies of molecular biosignatures have been supported by the John Templeton Foundation Grant 61783.AdditionalsupporthasbeenprovidedbytheNASAAstrobiologyInstitute ENIGMA team, grant 80NSSC18M0093. Any opinions, findings, or recommen- dations expressed herein are those of the authors and do not necessarily reflect the views of the NASA. Author affiliations: a Earth and Planets Laboratory, Carnegie Institution for Science, Washington, DC 20015; b Earth Life Science Institute, Tokyo Institute of Technology, Tokyo 152- 8550, Japan; c Blue Marble Space Institute for Science, Seattle, WA 98104; d Department of Mathematics and Statistics, Purdue University Northwest, Hammond, IN 46323; e Sagan Fellow, NASA Hubble Fellowship Program, Space Telescope Science Institute, Baltimore, MD 21218; and f Department of Earth and Planetary Sciences, Johns Hopkins University, Baltimore, MD 21218 1. C. M. Dobson, Chemical space and biology. Nature 432, 824–828 (2004). 2. M. L.Wong,A. Prabhu, Cells as the first data scientists. Interface 20, 20220810 (2023). 3. K. Kvenvolden et al., Evidence for extraterrestrial amino- acids and hydrocarbons in the Murchison meteorite. Nature 228, 923–926 (1970). 4. S. Kauffman, Is there a fourth law for non- ergodic systems that do work to construct their expanding phase space? Entropy 24, 1383 (2022). 5. P. Mitchell, Coupling of phosphorylation to electron and hydrogen transfer by a chemi- osmotic type of mechanism. Nature 191, 144–148 (1961). 6. C. P. McKay,What is life—and How do we search for it in other worlds? PLoS Biol. 2, e302 (2004). 7. J. D. Farmer, D.J. Des Marais, Exploring for a record of ancient Martian life. J. Geophys. Res. Planets 104, 26977–26995 (1999). 8. S. S.Johnson et al., Fingerprinting non- terran biosignatures. Astrobiology 18, 915–922 (2018). 9. E.W. Schwieterman et al., Exoplanet biosignatures: A review of remotely detectable signs of life. Astrobiology 18, 663–708 (2018). 10. S. I.Walker et al., Exoplanet bio-signatures: Future directions. Astrobiology 18, 779–824 (2018). 11. M.A.Chan et al.,Deciphering biosignatures in planetary contexts.Astrobiology 19,1075–1101 (2019). 12. S. Bartlett et al.,Assessing planetary complexity and potential agnostic biosignatures using epsilon machines. Nat.Astro. 6, 387–392 (2022). 13. C. E. Cleland, The Nature of Life: The Quest for a Universal Theory of Life: Searching for Life (University of Cambridge Press, 2019). 14. J. P. Grotzinger,A. H. Knoll, Stromatolites in Pre- cambrian carbonates: Evolutionary mileposts or environmental dipsticks? Ann. Rev. Earth Planet Sci. 27, 313–358 (1999). 15. N. Noffke, Microbially induced sedimentary structures in clastic deposits: Implication for the prospection for fossil life on Mars. Astrobiology 21, 866–892 (2021). 16. J. Farquhar, H. Bao, M.Thiemens,Atmospheric influence of Earth’s earliest sulfur cycle. Science 289, 756–758 (2000). 17. Y. Shen, R. Buick, D. E. Canfield, Isotopic evidence for microbial sulphate reduction in the early Archaean era. Nature 410, 77–81 (2001). 18. R. E. Summons et al., Molecular biosignatures. Space Sci. Rev. 135, 133–159 (2016). 19. M. Dannenmann et al.,Toward detecting biosignatures of DNA, lipids, and metabolic intermediates from bacteria in ice grains emitted by enceladus and Europa. Astrobiology 23, 60–75 (2023). 20. C. D. Georgiou, D.W. Deamer, Lipids as universal biomarkers of extraterrestrial life. Astrobiology 14, 541–549 (2014). 21. D.Avnir,Criticalreviewof chiralityindicatorsof extraterrestriallife.NewAstron.Rev.92,101596(2021). 22. C.R.Websteretal.,MarsmethanedetectionandvariabilityatGalecrater.Science347,415–417(2015). 23. V. S. Meadows et al., Reflections on O2 as a biosignature in exoplanetary atmospheres. Astrobiology 18, 630–662 (2018). 24. S.M.Morrison et al.,Network analysis of mineralogical systems.Am.Mineral. 102,1588–1596 (2017). 25. G. Hystad et al., Bayesian estimation of Earth’s undiscovered mineralogical diversity using noninformative priors. Math. Geosci. 51, 401–417 (2019). 26. M.Wong et al.,Towards network- based planetary biosignatures: Revisiting atmospheric chemistry as unipartite, unweighted, undirected networks. J. Geophys. Res. Planets 128, e2022JE007658 (2023). 27. E. D. Dorn et al., Monomer abundance distribution patterns as a universal biosignature: Examples from terrestrial and digital life. J. Mol. Evol. 72, 283–295 (2011). 28. C.Jolley,T. Douglas,Topological biosignatures: Large- scale structure of chemical networks from biology and astrochemistry. Astrobiology 12, 29–39 (2012). 29. N. Guttenberg et al., Classification of the biogenicity of complex organic mixtures for the detection of extraterrestrial life. Life 11, 234 (2021). 30. S. M. Marshall,A. R. Murray, L. Cronin,A probabilistic framework for identifying biosignatures using pathway complexity. Philos.Trans. Royal Soc.A 375, 20160342 (2017). 31. S. M. Marshall et al., Identifying molecules as biosignatures with assembly theory and mass spectrometry. Nat. Commun. 12, 3033 (2021). 32. J. E. Lovelock,A physical basis for life detection experiments. Nature 207, 568–570 (1965). 33. P. G. Simmonds,Whole microorganisms studied by pyrolysis- gas chromatography- mass spectrometry: Significance for extraterrestrial life detection experiments. Appl. Microbio. 20, 567–572 (1970). 34. K. Biemann, On the ability of the Viking gas chromatograph–mass spectrometer to detect organic matter. Proc. Natl Acad. Sci. U.S.A. 104, 10310–10313 (2007). 35. P. R. Mahaffy et al.,The sample analysis at Mars investigation and instrument suite. Space Sci. Rev. 170, 401–478 (2012). 36. R.A. Mathies et al., Feasibility of detecting bioorganic compounds in Enceladus plumes with the Enceladus Organic Analyzer. Astrobiology 17, 902–912 (2017). 37. L. Chou et al., Planetary mass spectrometry for agnostic life detection in the Solar System. Front. Astron. Space Sci. 8, 755100 (2021). 38. T. L. Salter et al., Mass spectrometric fingerprints of bacteria and archaea for life detection on icy moons. Astrobiology 22, 143–157 (2022). 39. E. Pretsch et al., Structure Determination of Organic Compounds (Springer- Verlag, 2000). 40. E. L. Schymanski et al., Consensus structure elucidation combining GC/EI- MS, structure generation, and calculated properties. Anal. Chem. 84, 3287–3295 (2012). 41. H. Han et al.,Variable selection using mean decrease accuracy and mean decrease gini based on random forest. IEEE Int. Conf. Software Eng. Service Sci. 7, 219–224 (2016). 42. G. P. Ellis,The maillard reaction. Adv. Carbohydrate Chem. 14, 63–134 (1959). 43. Y.Kebukawa,A.D.Kilcoyne,G.D.Cody,Exploringthepotentialformationof organicsolidsinchondrites andcometsthroughpolymerizationof interstellarformaldehyde.Astrophys.J.771,19(2013). 44. E. L.Wick, I. Hornstein, R.Teranishi, Flavor Chemistry (3Island Press, 1999). 45. G. Dungworth et al., Distribution of amino acids, amino sugars, purines and pyrimidines in a Lake Ontario sediment core. Chem. Geol. 19, 295–308 (1977). 46. P. Mazzarello,A unifying concept: The history of cell theory. Nat. Cell Biol. 1, E13–E15 (1999). 47. R. Milo, R. Phillips, Cell Biology by the Numbers (CRC Press, Boca Raton, FL, 2015). 48. V.J. Killops, S. D. Killops, Introduction to Organic Geochemistry (Wiley, 2013). 49. V. E. Kovats, Gas- chromatographische charakterisierung organischer verbindungen.Teil 1: Retentionsindices aliphatischer halogenide, alkohole, aldehyde und ketone. Helvet. Chim.Acta 41, 1915–1932 (1958). 50. C. P. Marshall et al., Structural characterization of kerogen in 3.4 Ga Archaean cherts from the Pilbara Craton,Western Australia. Precambrian Res. 155, 1–23 (2007). 51. M. Bourbin, S. Derenne, F. Robert, Limits in pyrolysis–GC–MS analysis of kerogen isolated from Archean cherts. Org. Geochem. 52, 32–34 (2012). 52. NASA, “SAM for scientists.” https://mars.nasa.gov/msl/spacecraft/instruments/sam/for- scientists/. Accessed 15 April 2021. 53. V. DaPoian et al., Science autonomy and the ExoMars mission: Machine learning to help find life on Mars. Computer 54, 69–77 (2021). 54. D. P. Glavin et al., Evidence for perchlorates and the origin of chlorinated hydrocarbons detected by SAM at the Rocknest aeolian deposit in Gale Crater. J. Geophys. Res. Planets 118, 1955–1973 (2013). 55. A.A. Pavlov et al., Rapid radiolytic degradation of amino acids in the martian shallow subsurface: Implications for the search for extinct life. Astrobiology 22, 1009–1115 (2022). 56. D. R. Lawrence,Taphonomy and information losses in fossil communities. Geol. Soc.Am. Bull. 79, 1315–1330 (1968). 57. A. K. Behrensmeyer, S. M. Kidwell, R. A. Gastaldo, “Taphonomy and paleobiology” in Deep Time: Paleobiology’s Perspective, D. H. Erwin and S. L. Wing, Eds. (The Paleontological Society, 2000), pp. 103–147. 58. S. L. Potter- McIntyre et al.,Taphonomy of microbial biosignatures in spring deposits: A comparison of modern, Quaternary and Jurassic examples. Astrobiology 17, 216–230 (2017). 59. P. Schmitt- Kopplin et al., High molecular diversity of extraterrestrial organic matter in Murchison meteorite revealed 40 years after its fall. Proc. Natl.Acad. Sci. U.S.A. 107, 2763–2768 (2010). 60. A.Arya et al.,An open source computational workflow for the discovery of autocatalytic networks in abiotic reactions. Chem. Sci. 13, 4838–4853 (2022). Downloaded from https://www.pnas.org by Sergio Sancevero on October 15, 2023 from IP address 177.173.237.248.
- 7. PNAS 2023 Vol. 120 No. 41 e2307149120 https://doi.org/10.1073/pnas.2307149120 7 of 7 61. S. Devata et al., Comparative evaluation of electron ionization mass spectral prediction methods. J. Am. Soc. Mass Spectrom. 34, 1584–1592 (2023). 62. N. Rashevsky, Outline of a unified approach to physics, biology and sociology. Bull. Math. Biophys. 31, 159–198 (1969). 63. C. G. Ryan et al., Snip, a statistics- sensitive background treatment for the quantitative analysis of pixe spectra in geoscience applications. Nuclear Instr. Methods Phys. Res. B 34, 396–402 (1988). 64. S. Gibb, K. Strimmer, MALDIquant: A versatile R package for the analysis of mass spectrometry data. Bioinformatics 28, 2270–2271 (2012). 65. S. G. Patro, K. K. Sahu, Normalization: A preprocessing stage. arXiv [Preprint] (2015). https://doi. org/10.48550/ARXIV.1503.06462 (Accessed 23 August 2023). 66. M. Kuhn, Classification and regression training, package, caret. https://github.com/topepo/caret/ (2022). 67. T. K. Ho, Random decision forest. Proc. Int. Conf. Document Anal. Recogn. 3, 278–282 (1995), 10.1109/ICDAR.1995.598994. 68. M. Lang et al., mlr3: A modern object- oriented machine learning framework in R. J. Open Source Softw. 4, 1903 (2019), https://joss.theoj.org/papers/10.21105/joss.01903. 69. T. Hastie, R.Tibshirani,J. Friedman, “Model assessment and selection” in The Elements of Statistical Learning (Springer Series in Statistics, Springer, 2009). 70. H. Cleaves,A robust molecular biosignature based on machine learning. Open Science Framework. https://doi.org/10.17605/OSF.IO/EMBH8. Deposited 7 June 2023. 71. G. Hystad,A. Prabhu,A robust molecular biosignature based on machine learning applied to three- dimensional pyrolysis GC- MS data (Version 1.0, Computer Software, Github, San Francisco, CA 2023). https://github.com/ghystad/Machine_learning_and_preprocessing_pyr_GSMS_data/tree/ master.Accessed 22 August 2023. Downloaded from https://www.pnas.org by Sergio Sancevero on October 15, 2023 from IP address 177.173.237.248.