2. 8078 K. P. Wyche et al.: Mapping gas-phase organic reactivity and concomitant SOA formation
strates that such an ensemble of chemometric mapping has
the potential to be used for the classification of more com-
plex spectra of unknown origin. More specifically, the addi-
tion of mesocosm data from fig and birch tree experiments
shows that isoprene and monoterpene emitting sources, re-
spectively, can be mapped onto the statistical model struc-
ture and their positional vectors can provide insight into their
biological sources and controlling oxidative chemistry. The
potential to extend the methodology to the analysis of am-
bient air is discussed using results obtained from a zero-
dimensional box model incorporating mechanistic data ob-
tained from the Master Chemical Mechanism (MCMv3.2).
Such an extension to analysing ambient air would prove a
powerful asset in assisting with the identification of SOA
sources and the elucidation of the underlying chemical mech-
anisms involved.
1 Introduction
Biogenic volatile organic compounds (BVOCs) are ubiq-
uitous in the global troposphere, being emitted primarily
from terrestrial plant life (Kanakidou et al., 2005). It is
estimated that the total annual emission rate of all (non-
methane) BVOCs is roughly 10 times that of all anthro-
pogenic volatile organic compounds (VOCs), being around
750 Tg C yr−1 (Sindelarova et al., 2014). With the excep-
tion of methane, the most dominant species of BVOCs in
terms of emission strength, reactivity and their impact upon
the atmosphere are terpenes (Reinnig et al., 2008), a subdi-
vision of BVOCs that primarily comprise the hemiterpene,
isoprene (C5), monoterpenes (C10) and sesquiterpenes (C15)
(e.g. Atkinson and Arey, 2003a; Kanakidou et al., 2005).
Within the troposphere terpenes are able to react with OH,
O3 and NO3 at appreciable rates (e.g. Calvert et al., 2000;
Koch et al., 2000; Fantechi et al., 2002; Capouet et al., 2004;
Kroll et al., 2006) such that their atmospheric lifetimes are
of the order of minutes to hours (e.g. Calogirou et al., 1999).
Because of their large emission rates and high reactivities,
terpenes have a strong impact upon the chemistry of the tro-
posphere at the local, regional and global scales (e.g. Jaoui
and Kamens, 2001; Paulot et al., 2012; Surratt, 2013). For in-
stance, terpenes have high photochemical ozone creation po-
tentials (Derwent et al., 2007) and extensive photochemical
oxidation pathways that lead to the production of a complex
array of oxygenated and nitrated products, some of which are
able to form secondary organic aerosol (SOA) (e.g. Calvert et
al., 2000; Capouet et al., 2004; Jenkin, 2004; Baltensperger
et al., 2008; Kanakidou et al., 2005; Surratt et al., 2006; Kroll
and Seinfeld, 2008; Hallquist et al., 2009).
Aerosol particles are natural components of the Earth’s at-
mosphere responsible for a range of well-documented im-
pacts, ranging from visibility impairment on the local scale
to climate change, with suspended particles being able to
perturb the Earth’s radiative budget via both direct and in-
direct mechanisms (Solomon et al., 2007). Furthermore, fine
airborne particles have been shown to have numerous detri-
mental effects on human health, particularly in vulnerable
members of the population (Harrison et al., 2010; Heal et al.,
2012).
Biogenic SOA (BSOA) has been estimated to account for
a significant fraction of total global SOA. Modelling stud-
ies suggest the annual global production rate of BSOA is of
the order of 16.4 Tg yr−1 (Henze and Seinfeld, 2006). How-
ever, despite its importance and the significant amount of
investigation conducted upon it, the formation mechanisms
and chemical composition of BSOA are still not well charac-
terised (e.g. Librando and Tringali, 2005; Wang et al., 2013).
Indeed under certain conditions as much as 80–90 % of anal-
ysed SOA mass is unknown (Limbeck et al., 2003; Kalberer
et al., 2006). In particular, there remains a significant lack
of information regarding the composition and evolution of
the complex organic gas-phase matrix during aerosol forma-
tion, and its linkage to SOA (Kroll et al., 2005; Librando and
Tringali, 2005). Indeed, in the many studies conducted on
BSOA, very few gas-phase oxidation products of the precur-
sor are routinely identified and reported.
The chemistry of the atmospheric system is highly non-
linear and can be studied by experiments ranging from highly
controlled laboratory studies of a single process, to field stud-
ies of the whole complex system. A significant proportion
of the findings gained regarding SOA over the last decade
and more have come from atmospheric simulation chamber
experiments, intermediate in complexity between classical
single-process experiments and the fully open system (for
various different chamber systems and VOC precursors, see
for example, Pandis et al., 1991; Odum et al., 1996; Hoff-
mann et al., 1997; Griffin et al., 1999; Glasius et al., 2000;
Cocker et al., 2001; Jaoui and Kamens, 2003; Kleindienst et
al., 2004; Presto et al., 2005; Bloss et al., 2005; Rohrer et
al., 2005; Ng et al., 2006, 2007; Dommen et al., 2006; Surrat
et al., 2006; Grieshop et al., 2007; Chan et al., 2007; Wyche
et al., 2009; Hildebrandt et al., 2009; Rickard et al., 2010;
Camredon et al., 2010; Chhabra et al., 2011; Hennigan et al.,
2011; Jenkin et al., 2012). Chamber experiments produce a
large amount of data, the interpretation of which can often be
highly complex and time consuming even though the set-up
of the chamber constrains the complexity to a large degree.
In the current “big data” age, advanced monitoring tech-
niques are producing increasingly larger, more complex and
detailed data sets. Modern chamber experiments, monitored
by state-of-the-art gas- and particle-phase instrumentation,
often yield so much data that only a fraction is subse-
quently used in a given analysis. For example, during a
typical 6 h environmental simulation chamber experiment,
VOC monitoring chemical-ionisation reaction time-of-flight
mass spectrometry (CIR-TOF-MS) will produce roughly
1.1 × 10⁷ data points. In order to keep pace with instrument
development and maximise the information extracted from
Atmos. Chem. Phys., 15, 8077–8100, 2015 www.atmos-chem-phys.net/15/8077/2015/
3. K. P. Wyche et al.: Mapping gas-phase organic reactivity and concomitant SOA formation 8079
sometimes-complex experiments, it is crucial that we ad-
vance our data analysis methods and introduce new data min-
ing techniques.
The work reported here focuses on detailed organic
gas-phase and particle-phase composition data, recorded
during SOA atmospheric simulation chamber experiments,
using CIR-TOF-MS and liquid-chromatography ion-trap
mass spectrometry (LC-MS/MS), respectively, as well as
broad (i.e. generic composition “type”: oxygenated or-
ganic aerosol, nitrated, sulfated) aerosol composition data,
recorded by compact time-of-flight aerosol mass spectrom-
etry (cTOF-AMS). The goal of this paper is to demon-
strate and evaluate the application of an ensemble reductive
chemometric methodology for these comprehensive oxida-
tion chamber data sets, to be used as a model framework to
map chemical reactivity from mesocosm systems, thus pro-
viding a link from model systems to more “real” mixtures
of organics. The intermediate complexity offered by simula-
tion chamber experiments makes them an ideal test bed for
the methodology. Application of the methodology to resul-
tant particle-phase data also aims to provide a level of par-
ticle composition classification in the context of gas-phase
oxidation.
Similar approaches using statistical analyses have been re-
cently applied to both detailed and broad ambient aerosol
composition data (e.g. Heringa et al., 2012; Paglione et al.,
2014), particularly in the context of source apportionment
(e.g. Alier et al., 2013). Different methods have been at-
tempted by several groups to deconvolve organic aerosol
spectra measured by the aerosol mass spectrometer (AMS)
in particular (e.g. Zhang et al., 2005, 2007; Marcolli et al.,
2006; Lanz et al., 2007). Zhang et al. (2005) applied a cus-
tom principal component analysis (CPCA) method to extract
two distinct sources of organic aerosols in an urban environ-
ment using linear decomposition of AMS spectra and later
applied a multiple-component analysis technique (MCA; an
expanded version of the CPCA) to separate more than two
factors in data sets from 37 field campaigns in the North-
ern Hemisphere (Zhang et al., 2007). Marcolli et al. (2006)
applied a hierarchical cluster analysis method to an ambient
AMS data set, and reported clusters representing biogenic
VOC oxidation products, highly oxidised organic aerosols
and other small categories. Receptor modelling techniques
such as positive matrix factorisation (PMF) employ similar
multivariate statistical methods in order to deconvolve a time
series of simultaneous measurements into a set of factors
and their time-dependent concentrations (Paatero and Tap-
per, 1994; Paatero, 1997). Depending on their specific chem-
ical and temporal characteristics, these factors may then be
related to emission sources, chemical composition and at-
mospheric processing. For example, Lanz et al. (2007) and
Ulbrich et al. (2009) applied PMF to the organic fraction of
AMS data sets and were able to conduct source apportion-
ment analysis identifying factors contributing to the com-
position of organic aerosol at urban locations. Slowik et
al. (2010), combined both particle-phase AMS and gas-phase
proton transfer reaction mass spectrometry (PTR-MS) data
for the PMF analysis of urban air, and were able to success-
fully obtain “regional transport, local traffic, charbroiling and
oxidative-process” factors. By combining the two data sets,
Slowik and colleagues were able to acquire more in-depth in-
formation regarding the urban atmosphere than could be de-
rived from the analysis of each of the sets of measurements
on their own.
Because receptor models require no a priori knowledge
of meteorological conditions or emission inventories, they
are ideal for use in locations where emission inventories are
poorly characterised or highly complicated (e.g. urban areas),
or where atmospheric processing plays a major role. How-
ever, because all of the values in the profiles and contribu-
tions are constrained to be positive, the PMF model can have
an arbitrary number of factors and the user must select the
“best” solution that explains the data. This subjective step of
PMF analysis relies greatly on the judgment and skill of the
user.
The central methodology employed in this work is based
around the application of principal component analysis
(PCA), hierarchical cluster analysis (HCA) and positive
least-squares discriminant analysis (PLS-DA) of single-
precursor oxidant chemistry in environmental simulation
chambers. Colloquially, we can describe these three ap-
proaches as providing dimensions along which the data are
separable (PCA), tests of relatedness (HCA) and checks for
false positives (PLS-DA).
Such dimension reduction techniques can be very pow-
erful when used in chemometrics, enabling large and of-
ten complex data sets to be rendered down to a relatively
small set of pattern-vectors to provide an optimal descrip-
tion of the variance of the data (Jackson, 1980; Sousa et
al., 2013; Kuppusami et al., 2015). Unlike other statistical
techniques such as PMF, the ensemble methodology pre-
sented here does not require the use of additional external
databases (comprising information regarding different envi-
ronments/reference spectra), is simpler to use and less labour
intensive, and places less importance on user skill in the pro-
duction of accurate and meaningful results. Moreover, the
primary focus of techniques such as PMF is on source identi-
fication/separation, whereas here the focus is placed on com-
positional isolation.
The analysis conducted in this work shows that “model”
biogenic oxidative systems can be clearly separated and clas-
sified according to their gaseous oxidation products, i.e. iso-
prene from β-caryophyllene from non-cyclic monoterpenes
and cyclic monoterpenes. The addition of equivalent meso-
cosm data from fig and birch tree experiments shows that
large isoprene and large monoterpene emitting sources re-
spectively, can be mapped onto the statistical model structure
and their positional vectors can provide insight into the ox-
idative chemistry at play. The analysis is extended to particle-
phase data to show further classifications of model systems
www.atmos-chem-phys.net/15/8077/2015/ Atmos. Chem. Phys., 15, 8077–8100, 2015
4. 8080 K. P. Wyche et al.: Mapping gas-phase organic reactivity and concomitant SOA formation
Table 1. Summary of experiments conducted.
Experiment ID Precursor Structure k(OH)/k(O3)a/ Experiment VOC / NOx RH/%
cm3 molec−1 s−1 type (no.) range range
ISOP1 – 10b,c Isoprene 9.9 × 10⁻¹¹/1.2 × 10−17 Photooxidation (10) 1.3–20.0 49–72
40
10. Tables
Table 1: Summary of experiments conducted
Experiment ID Precursor Structure k(OH) / k(O3)4
/ cm3
molec-1
s-1
Experiment Type (no.) VOC/NOx Range RH / % Range
ISOP1 – 10 isoprene 9.9 × 10⁻¹¹
/ 1.2 × 10⁻¹⁷
Photooxidation (10) 1.3 – 20.0 49 – 72
APIN1 – 42,3
α-pinene 5.3 × 10⁻¹¹
/ 8.4 × 10⁻¹⁷
Photooxidation (4) 1.3 – 2.01
49 – 73
LIM1 – 62,3
limonene 1.7 × 10⁻¹⁰
/ 2.1 × 10⁻¹⁶
Photooxidation (6) 1.4 – 2.01
501
– 82
BCARY1 – 102,3
β-caryophyllene 2.0 × 10⁻¹⁰
/ 1.2 × 10⁻¹⁴
Photooxidation (10) 0.6 – 2.01
501
– 72
MYRC1 – 22,3
myrcene 2.1 × 10⁻¹⁰
/ 4.7 × 10⁻¹⁶
Photooxidation (2) 1.4 – 1.9 52 – 54
LINA1 – 22,3
linalool 1.6 × 10⁻¹⁰
/ 4.5 × 10⁻¹⁶
Photooxidation (2) 1.4 – 2.6 42 – 47
APIN1 – 4b,c,d,e α-pinene 5.3 × 10⁻¹¹/8.4 × 10−17 Photooxidation (4) 1.3–2.0f 49–73
40
10. Tables
Table 1: Summary of experiments conducted
Experiment ID Precursor Structure k(OH) / k(O3)4
/ cm3
molec-1
s-1
Experiment Type (no.) VOC/NOx Range RH / % Range
ISOP1 – 10 isoprene 9.9 × 10⁻¹¹
/ 1.2 × 10⁻¹⁷
Photooxidation (10) 1.3 – 20.0 49 – 72
APIN1 – 42,3
α-pinene 5.3 × 10⁻¹¹
/ 8.4 × 10⁻¹⁷
Photooxidation (4) 1.3 – 2.01
49 – 73
LIM1 – 62,3
limonene 1.7 × 10⁻¹⁰
/ 2.1 × 10⁻¹⁶
Photooxidation (6) 1.4 – 2.01
501
– 82
BCARY1 – 102,3
β-caryophyllene 2.0 × 10⁻¹⁰
/ 1.2 × 10⁻¹⁴
Photooxidation (10) 0.6 – 2.01
501
– 72
MYRC1 – 22,3
myrcene 2.1 × 10⁻¹⁰
/ 4.7 × 10⁻¹⁶
Photooxidation (2) 1.4 – 1.9 52 – 54
LINA1 – 22,3
linalool 1.6 × 10⁻¹⁰
/ 4.5 × 10⁻¹⁶
Photooxidation (2) 1.4 – 2.6 42 – 47
LIM1 – 6b,d,e Limonene 1.7 × 10⁻¹⁰ / 2.1 × 10⁻¹⁶ Photooxidation (6) 1.4–2.0f 50f–82
40
10. Tables
Table 1: Summary of experiments conducted
Experiment ID Precursor Structure k(OH) / k(O3)4
/ cm3
molec-1
s-1
Experiment Type (no.) VOC/NOx Range RH / % Range
ISOP1 – 10 isoprene 9.9 × 10⁻¹¹
/ 1.2 × 10⁻¹⁷
Photooxidation (10) 1.3 – 20.0 49 – 72
APIN1 – 42,3
α-pinene 5.3 × 10⁻¹¹
/ 8.4 × 10⁻¹⁷
Photooxidation (4) 1.3 – 2.01
49 – 73
LIM1 – 62,3
limonene 1.7 × 10⁻¹⁰
/ 2.1 × 10⁻¹⁶
Photooxidation (6) 1.4 – 2.01
501
– 82
BCARY1 – 102,3
β-caryophyllene 2.0 × 10⁻¹⁰
/ 1.2 × 10⁻¹⁴
Photooxidation (10) 0.6 – 2.01
501
– 72
MYRC1 – 22,3
myrcene 2.1 × 10⁻¹⁰
/ 4.7 × 10⁻¹⁶
Photooxidation (2) 1.4 – 1.9 52 – 54
LINA1 – 22,3
linalool 1.6 × 10⁻¹⁰
/ 4.5 × 10⁻¹⁶
Photooxidation (2) 1.4 – 2.6 42 – 47
BCARY1 – 10b,d,e β-caryophyllene 2.0 × 10⁻¹⁰/1.2 × 10−14 Photooxidation (10) 0.6–2.0f 50f–72
40
10. Tables
Table 1: Summary of experiments conducted
Experiment ID Precursor Structure k(OH) / k(O3)4
/ cm3
molec-1
s-1
Experiment Type (no.) VOC/NOx Range RH / % Range
ISOP1 – 10 isoprene 9.9 × 10⁻¹¹
/ 1.2 × 10⁻¹⁷
Photooxidation (10) 1.3 – 20.0 49 – 72
APIN1 – 42,3
α-pinene 5.3 × 10⁻¹¹
/ 8.4 × 10⁻¹⁷
Photooxidation (4) 1.3 – 2.01
49 – 73
LIM1 – 62,3
limonene 1.7 × 10⁻¹⁰
/ 2.1 × 10⁻¹⁶
Photooxidation (6) 1.4 – 2.01
501
– 82
BCARY1 – 102,3
β-caryophyllene 2.0 × 10⁻¹⁰
/ 1.2 × 10⁻¹⁴
Photooxidation (10) 0.6 – 2.01
501
– 72
MYRC1 – 22,3
myrcene 2.1 × 10⁻¹⁰
/ 4.7 × 10⁻¹⁶
Photooxidation (2) 1.4 – 1.9 52 – 54
LINA1 – 22,3
linalool 1.6 × 10⁻¹⁰
/ 4.5 × 10⁻¹⁶
Photooxidation (2) 1.4 – 2.6 42 – 47
MYRC1 – 2b,d,e Myrcene 2.1 × 10⁻¹⁰/4.7 × 10−16 Photooxidation (2) 1.4–1.9 52–54
40
10. Tables
Table 1: Summary of experiments conducted
Experiment ID Precursor Structure k(OH) / k(O3)4
/ cm3
molec-1
s-1
Experiment Type (no.) VOC/NOx Range RH / % Range
ISOP1 – 10 isoprene 9.9 × 10⁻¹¹
/ 1.2 × 10⁻¹⁷
Photooxidation (10) 1.3 – 20.0 49 – 72
APIN1 – 42,3
α-pinene 5.3 × 10⁻¹¹
/ 8.4 × 10⁻¹⁷
Photooxidation (4) 1.3 – 2.01
49 – 73
LIM1 – 62,3
limonene 1.7 × 10⁻¹⁰
/ 2.1 × 10⁻¹⁶
Photooxidation (6) 1.4 – 2.01
501
– 82
BCARY1 – 102,3
β-caryophyllene 2.0 × 10⁻¹⁰
/ 1.2 × 10⁻¹⁴
Photooxidation (10) 0.6 – 2.01
501
– 72
MYRC1 – 22,3
myrcene 2.1 × 10⁻¹⁰
/ 4.7 × 10⁻¹⁶
Photooxidation (2) 1.4 – 1.9 52 – 54
LINA1 – 22,3
linalool 1.6 × 10⁻¹⁰
/ 4.5 × 10⁻¹⁶
Photooxidation (2) 1.4 – 2.6 42 – 47
LINA1 – 2b,d,e Linalool 1.6 × 10⁻¹⁰/4.5 × 10−16 Photooxidation (2) 1.4–2.6 42–47
41
Experiment ID Precursor Structure k(OH) / k(O3)4
/ cm3
molec-1
s-1
Experiment Type (no.) VOC/NOx Range RH / % Range
BIR1 – 2 birch trees Multiple emissions5
Multiple emissions Mesocosm
Photooxidation (2)
5.5 – 5.6 73 – 84
FIG1 – 2 fig trees Multiple emissions5
Multiple emissions Mesocosm
Photooxidation (2)
2.7 – 9.4 65 – 75
TOL1 – 5 toluene 3.7 × 10⁻¹²
/ - Photooxidation (5) 1.3 – 11.6 2 – 6
1 = Estimated using known volume of reactants injected
2 = LC-MS/MS filter data available for at least one of these experiments (MAC)
3 = c-TOF-AMS data available for at least one of these experiments (MAC)
4 = From (Atkinson and Arey, 2003b;Sun et al., 2012;Khamaganov and Hites, 2001) and references therein
5 = See Wyche et al., 2014
BIR1 – 2b Birch trees Multiple emissionsg Multiple emissions Mesocosm 5.5–5.6 73–84
Photooxidation (2)
FIG1 – 2b Fig trees Multiple emissionsg Multiple emissions Mesocosm 2.7–9.4 65–75
Photooxidation (2)
TOL1 – 5h Toluene 3.7 × 10⁻¹²/– Photooxidation (5) 1.3–11.6 2–6
41
Experiment ID Precursor Structure k(OH) / k(O3)4
/ cm3
molec-1
s-1
Experiment Type (no.) VOC/NOx Range RH / % Range
BIR1 – 2 birch trees Multiple emissions5
Multiple emissions Mesocosm
Photooxidation (2)
5.5 – 5.6 73 – 84
FIG1 – 2 fig trees Multiple emissions5
Multiple emissions Mesocosm
Photooxidation (2)
2.7 – 9.4 65 – 75
TOL1 – 5 toluene 3.7 × 10⁻¹²
/ - Photooxidation (5) 1.3 – 11.6 2 – 6
1 = Estimated using known volume of reactants injected
2 = LC-MS/MS filter data available for at least one of these experiments (MAC)
3 = c-TOF-AMS data available for at least one of these experiments (MAC)
4 = From (Atkinson and Arey, 2003b;Sun et al., 2012;Khamaganov and Hites, 2001) and references therein
5 = See Wyche et al., 2014
a From Atkinson and Arey (2003b), Sun et al. (2012), Khamaganov and Hites (2001) and references therein; b experiments conducted in the MAC; c experiments conducted in the PSISC;
d LC-MS/MS filter data available for at least one of these experiments (MAC); e cTOF-AMS data available for at least one of these experiments (MAC); f estimated using known volume
of reactants injected; g see Wyche et al. (2014); h experiments conducted in the EUPHORE.
based on both broad and detailed SOA composition measure-
ments.
The methodology described and the results presented (sup-
ported by findings obtained from zero-dimensional box mod-
elling) indicate that there is some potential that the approach
could ultimately provide the foundations for a framework
onto which it would be possible to map the chemistry and
oxidation characteristics of ambient air measurements. This
could in turn allow “pattern” typing and source origina-
tion for certain complex air matrices and provide a snap-
shot of the reactive chemistry at work, lending insight into
the type of chemistry driving the compositional change of
the contemporary atmosphere. There are similarities between
this approach to discovery science in the atmosphere and
metabolomic strategies in biology (e.g. Sousa et al., 2013;
Kuppusami et al., 2015).
2 Experimental details
2.1 Choice of precursors
Six different BVOCs and one anthropogenic VOC were cho-
sen for analysis. The target compounds, their structures and
reaction rate constants with respect to OH and O3 are given
in Table 1. The BVOCs were chosen according to their at-
mospheric prevalence, structure and contrasting photooxida-
tive reaction pathways; all have previously been shown to
form SOA under simulation chamber conditions (e.g. Hoff-
mann et al., 1997; Griffin et al., 1999; Glasius et al., 2000;
Jaoui and Kamens, 2003; Presto et al., 2005; Ng et al.,
2006; Surratt et al., 2006; Dommen et al., 2006; Lee et al.,
2006; Hallquist et al., 2009; Alfarra et al., 2013, and ref-
erences therein). Isoprene is a C5 diene that accounts for
around 62 % (∼ 594 Tg yr−1) of total annual non-methane
BVOC emissions (Sindelarova et al., 2014). After isoprene,
monoterpenes (C5H16) have the next largest annual emis-
sion rate; they account for around 11 % (∼ 95 Tg yr−1) of
total annual non-methane BVOC emissions (Sindelarova et
al., 2014). α-pinene and limonene were chosen for analy-
sis here alongside isoprene, the former acting as a model
system to represent bicyclic monoterpenes, and the latter to
represent monocyclic diene terpenes. In this work, α-pinene
and limonene together generically represent (and are referred
to hereafter as) “cyclic” monoterpenes (i.e. monoterpenes
that contain one six-member carbon ring). In order to ex-
plore the chemistry of non-cyclic monoterpenes, myrcene,
an acyclic triene monoterpene, was also included, as was the
structurally similar acyclic diene oxygenated VOC (OVOC),
Atmos. Chem. Phys., 15, 8077–8100, 2015 www.atmos-chem-phys.net/15/8077/2015/
5. K. P. Wyche et al.: Mapping gas-phase organic reactivity and concomitant SOA formation 8081
Table 2. Key technical features of MAC, EUPHORE and PSISC (Alfarra et al., 2012; Becker, 1996; Bloss et al., 2005; Camredon et al.,
2010; Paulsen et al., 2005; Zador et al., 2006).
Chamber Material Environment Size Light source Spectrum
MAC FEP Teflon Indoor 18 m3, 1 × 6 kW Xe arc lamp λ range = 290–800 nm
3(H) × 3(L) × 2(W) m Bank of halogen lamps jNO2
= 1.1 × 10⁻³ s−1 (290–422 nm)
EUPHORE FEP Teflon Outdoor 200 m3, Solar Solar; 75 % transmission at 290 nm,
(hemispherical) 85 % transmission > 320 nm
jNO2
= ∼ 5–9 × 10⁻³ s−1
PSISC FEP DuPont Tedlar Indoor 27 m3, 4 × 4 kW Xenon λ range = 290–800 nm
3(H) × 3(L) × 3(W) m arc lamps jNO2
= 2 × 10⁻³ s−1
linalool. In this work, myrcene and linalool together gener-
ically represent (and are referred to hereafter as) “straight
chain” monoterpenes/BVOCs (note: linalool is not techni-
cally a monoterpene, but does contain the same carbon back-
bone as myrcene; consequently, it is expected to exhibit
similar photooxidative chemistry). Finally, β-caryophyllene
was included to represent sesquiterpenes, which have an-
nual emissions of the order of 20 Tg yr−1 (Sindelarova et
al., 2014). In order to test the ability of the methodology
to distinguish between biogenic and anthropogenic systems,
toluene was also included. Toluene is often used as a model
system to act as a proxy for aromatic species in general
(Bloss et al., 2005). For contrasting plant mesocosm sys-
tems, Ficus benjamina and Ficus cyathistipula (fig) and Be-
tula pendula (birch) species were chosen to represent tropical
rainforest and European environs, respectively.
The VOC precursors employed have certain similarities
in terms of reaction rate constants with respect to OH and
O3, e.g. limonene, myrcene, linalool and β-caryophyllene
all have atmospheric lifetimes with respect to OH of the or-
der of 40–50 min (Alfarra et al., 2013; Atkinson and Arey,
2003b). β-caryophyllene has the shortest lifetime with re-
spect to O3 (ca. 2 min) and isoprene and α-pinene have the
longest lifetimes with respect to both OH and O3, e.g. iso-
prene and α-pinene have atmospheric lifetimes with respect
to OH of the order of 1.4–2.7 h (Alfarra et al., 2013; Atkinson
and Arey, 2003b). In order to ensure the various systems had
progressed sufficiently down their respective photooxidative
reaction pathways, the experiment duration was set to be suf-
ficiently long so that the majority of the precursor would be
consumed by the conclusion of the experiment.
2.2 Chamber infrastructure
Experiments were carried out across three different European
environmental simulation chamber facilities over a number
of separate campaigns. The chambers used, included (1)
The University of Manchester Aerosol Chamber (MAC), UK
(Alfarra et al., 2012); (2) The European Photoreactor (EU-
PHORE), ES (Becker, 1996); and (3) The Paul Scherrer In-
stitut Smog Chamber (PSISC), CH (Paulsen et al., 2005). A
brief technical description of each facility is given in Table 2.
2.3 Experiment design
Table 1 provides a summary of the experiments conducted,
which can be divided into three separate categories: (1) pho-
tooxidation, indoor chamber (Wyche et al., 2009; Alfarra et
al., 2012, 2013); (2) photooxidation, outdoor chamber (Bloss
et al., 2005; Camredon et al., 2010); and (3) mesocosm pho-
tooxidation, indoor chamber (Wyche et al., 2014). In each
case the reaction chamber matrix comprised a temperature
(T = 292–299 K) and humidity (49–84 % for photooxida-
tion, indoor chamber and < 2–6 % for photooxidation, out-
door chamber) controlled synthetic air mixture. For all exper-
iments the chamber air matrix also contained a pre-defined
initial quantity of NO and NO2 (VOC / NOx ratios in the
range 0.6–20, but typical ∼ 2). The VOC precursor was intro-
duced into the reaction chamber in liquid form via a heated
inlet. In the case of the mesocosm photooxidation experi-
ments, a known volume of air containing the precursor VOCs
was transferred to the reaction chamber from a separate, il-
luminated plant chamber, which contained several tree speci-
mens. For the indoor chamber systems, the experiments were
initiated, after introduction of all reactants, by the switching
on of artificial lights. For the outdoor chamber systems, the
opening of the chamber cupola marked the start of the exper-
iment. Experiments were typically run for 4–6 h.
2.4 Instrumentation
CIR-TOF-MS was used to make real-time (i.e. 1 min) mea-
surements of the complex distribution of VOCs ( VOC, i.e.
the sum of VOCs, oxygenated VOCs – OVOCs and nitrated
VOCs – NVOCs) produced in the gas-phase during oxidation
of each parent compound. In brief, the CIR-TOF-MS com-
prises a temperature controlled (T = 40 ◦C) ion source/drift
cell assembly coupled to an orthogonal time-of-flight mass
spectrometer equipped with a reflectron array (Kore Tech-
nology, UK). Proton transfer reaction (PTR) from hydro-
nium (H3O+) and hydrated hydronium (H3O+(H2O)n) was
www.atmos-chem-phys.net/15/8077/2015/ Atmos. Chem. Phys., 15, 8077–8100, 2015
6. 8082 K. P. Wyche et al.: Mapping gas-phase organic reactivity and concomitant SOA formation
employed as the ionisation technique during all experiments
(Jenkin et al., 2012; Wyche et al., 2007). Further details re-
garding the CIR-TOF-MS can be found in Blake et al. (2004)
and Wyche et al. (2007).
Aerosol samples were collected on 47 mm quartz fibre fil-
ters at the end of certain experiments and the water-soluble
organic content was extracted for analysis using LC-MS/MS.
Reversed-phase LC separation was achieved using an HP
1100 LC system equipped with an Eclipse ODS-C18 column
with 5 µm particle size (Agilent, 4.6 mm × 150 mm). Mass
spectrometric analysis was performed in negative ionisation
mode using an HCT-Plus ion trap mass spectrometer with
electrospray ionisation (Bruker Daltonics GmbH). Further
details can be found in Hamilton et al. (2011).
For several experiments, real-time broad chemical charac-
terisation of the SOA was made using a cTOF-AMS (Aero-
dyne Research Inc., USA). The cTOF-AMS was operated
in standard configuration, taking both mass spectrum (MS)
and particle time-of-flight (PTOF) data; it was calibrated for
ionisation efficiency using 350 nm monodisperse ammonium
nitrate particles, the vaporiser was set to ∼ 600 ◦C and a col-
lection efficiency value of unity was applied (Alfarra et al.,
2006). For further details, refer to Drewnick et al. (2005) and
Canagaratna et al. (2007).
Filter and cTOF-AMS data were collected only during
photooxidation experiments conducted at the MAC. Repeat
experiments conducted at the MAC were carried out under
similar starting conditions (e.g. VOC / NOx ratio; Alfarra et
al., 2013).
Each chamber was additionally instrumented with online
chemiluminescence/photolytic NOx analysers, UV photo-
metric O3 detectors, and scanning mobility particle sizers
and condensation particle counters for aerosol size and num-
ber concentration, as well as temperature, pressure and hu-
midity monitors. For full details regarding the various in-
strument suites employed at each chamber see Alfarra et
al. (2012), Paulsen et al. (2005), Camredon et al. (2010) and
references therein.
2.5 Model construction
In order to aid analysis, the composition and evolution of
the gas-phase components of the α-pinene chamber system
were simulated using a chamber optimised photochemical
box model incorporating the comprehensive α-pinene atmo-
spheric oxidation scheme extracted from the Master Chemi-
cal Mechanism website (Jenkin et al., 1997, 2012; Saunders
et al., 2003; http://mcm.leeds.ac.uk/MCM). The α-pinene
mechanism employed (along with an appropriate inorganic
reaction scheme) contained approximately 313 species and
942 different reactions. The box model employed also in-
corporated a series of “chamber-specific” auxiliary reactions
adapted from Bloss et al. (2005), Zador et al. (2006) and Met-
zger et al. (2008) in order to take into account background
chamber reactivity. Photolysis rates were parameterised for
the PSI chamber and constrained using measured values of
(j(NO2)). All simulations were run at 295 K and 50 % rel-
ative humidity. NO, NO2, HONO and α-pinene were either
initialised or constrained, depending on the scenario inves-
tigated. For further details regarding the chamber auxiliary
mechanism and similar modelling exercises, see for example
Rickard et al. (2010).
3 Data analysis
3.1 Data processing
All CIR-TOF-MS data were recorded at a time resolution of
1 min. In order to remove the time dimension and simulta-
neously increase detection limit, the individual mass spectra
were integrated over the entire experiment; as such, no ac-
count is taken of overall reaction time in the CIR-TOF-MS
analysis. Removing the time dimension acts to reduce the di-
mensionality of the data, whilst maintaining the central char-
acteristic spectral fingerprints produced by the photooxida-
tion process. On average across all experiments studied, 98 %
of the precursor had been consumed by the conclusion of the
experiment; hence, it is assumed that sufficient reaction took
place in each instance to provide summed-normalised mass
spectra that fully capture first- and higher-generation product
formation.
The resultant summed spectra were normalised to 106
primary reagent ion counts (i.e. (H3O++ H3O+(H2O)n)).
Similarly normalised background spectra (recorded prior
to injection of the precursor) were then subtracted
from the summed-and-normalised experiment spectra. The
65 < m/z < 255 channels of the background removed spec-
tra were extracted to comprise the region of interest. These
ions tend to carry the most analyte-specific information, with
lower m/z features tending to comprise either generic frag-
ment ions that provide little chemical information (Blake
et al., 2006) and/or small “common” compounds, some of
which can be emitted from illuminated chamber walls (e.g.
Bloss et al., 2005; Zador et al., 2006; Metzger et al., 2008).
The extracted data were refined further by the application of
a Mann–Whitney test (see Statistical Analysis for details),
leaving residual spectra that comprised only the integrated-
over-time signals corresponding to the VOC precursor and
any product VOCs formed within the chamber during the ex-
periment. Finally, the signal counts (in units of normalised
counts per second; ncps) in each mass channel of the residu-
als, were expressed as a percentage of the total ion count in
the refined region of interest.
The LC-MS/MS signal intensity data for the region
51 < m/z < 599 were extracted for analysis. For the AMS
data, a 10 min average was produced at 4 h after lights
on (hour-4; roughly around the time when SOA mass had
reached a peak and towards to the end of the experiment)
and the region 40 < m/z < 150 (again the region carrying the
Atmos. Chem. Phys., 15, 8077–8100, 2015 www.atmos-chem-phys.net/15/8077/2015/
7. K. P. Wyche et al.: Mapping gas-phase organic reactivity and concomitant SOA formation 8083
most information; Alfarra et al., 2006) was extracted. Similar
to the gas-phase data sets, the LC-MS/MS and cTOF-AMS
data were filtered using a Mann–Whitney test. Finally, for
each data set all signal counts were expressed as a percentage
of the total ion count in the respective m/z region of interest.
3.2 Statistical analysis
Before any multivariate analysis was conducted, the pro-
cessed CIR-TOF-MS, LC-MS/MS and cTOF-AMS spectra
were first filtered to remove unwanted data that were deemed
not to be statistically significant. In order to do this, the mass
spectra were initially grouped by structure of the precursor
employed, giving seven separate groups for the CIR-TOF-
MS data and three groups (owing to the smaller number
of precursor species investigated) for the LC-MS/MS and
cTOF-AMS data, respectively. A two-sided Mann–Whitney
test was then used to assess whether signals reported in in-
dividual mass channels were significantly different from the
corresponding signals measured during a blank experiment.
SPSS V20 (IBM, USA) was used for the analysis. A p value
of < 0.05 was considered statistically significant. The final
summed-normalised and filtered spectra were then subjected
to a series of multivariate statistical analysis techniques in
order to probe the underlying chemical information. PLS-
Toolbox (Eigenvector Research Inc., USA), operated in Mat-
Lab (Mathworks, USA; PLS-Tool Box), was used for the
analysis.
To begin with, to reduce the data and identify similarities
between the precursor oxidation systems, a PCA was con-
ducted on the BVOC data set and the model generated was
then employed to map the reactivity of fig and birch tree
mesocosm systems and to investigate the fit of a typical an-
thropogenic system (toluene) into the PCA space (both intro-
duced into the model as test data sets). An unsupervised pat-
tern recognition, hierarchical cluster analysis was also con-
ducted on the data and a dendrogram was produced to test
relatedness, support the PCA and help interpret the precursor
class separations achieved. The dendrogram was constructed
using PCA scores, the centroid method and Mahalanobis dis-
tance coefficients. Finally, a supervised pattern recognition
PLS-DA analysis was employed as a check for false positives
and as a quantitative classification tool to test the effective-
ness of classification of the various systems in the model.
For the superposition of “classification” confidence lev-
els onto the results of the PCA and HCA and for clas-
sification discrimination in the PLS-DA, prior to analysis
the experiments were grouped according to the structure of
the precursor investigated. Group 1 = isoprene (hemiterpene)
and group 2 = α-pinene and limonene (both cyclic monoter-
penes with an endocyclic double bond). Although limonene
also has an exocyclic double bond in a side chain, we jus-
tify this classification on account of the endocyclic dou-
ble bond in limonene being much more reactive towards
ozone and slightly more reactive towards OH (Calvert et
Figure 1. (a) NOx, O3, myrcene and 4-vinyl-4-pentenal (primary
aldehyde product), and (b) particle mass (not wall loss corrected
and assuming ρ = 1.3) and size evolution within the MAC during a
typical photooxidation experiment.
al., 2000). Group 3 = β-caryophyllene (sesquiterpene) and
group 4 = myrcene (straight chain monoterpene) and linalool
(straight chain OVOC). Strictly speaking, linalool is an
OVOC (structure C10H18O) and not a monoterpene (struc-
ture C10H16); however we justify this grouping on account of
both myrcene and linalool comprising primary BVOCs (of-
ten co-emitted; Bouvier-Brown et al., 2009; Kim et al., 2010;
Wyche et al., 2014) with certain structural similarities.
4 Results
4.1 Experiment overview
The temporal evolution of various key gas-phase (a) and
particle-phase (b) parameters measured during a typical pho-
tooxidation experiment, are shown in Fig. 1 in order to pro-
vide background context. In this instance the precursor was
myrcene and the facility employed was the MAC. Full de-
tails describing the underlying chemical and physical mech-
anisms at play within such experiments can be found else-
where (e.g. Larsen et al., 2001; Bloss et al., 2005; Paulsen et
al., 2005; Surratt et al., 2006, 2010; Wyche et al., 2009, 2014;
Camredon et al., 2010; Rickard et al., 2010; Eddingsaas et
al., 2012a and b; Hamilton et al., 2011; Jenkin et al., 2012;
Alfarra et al., 2012, 2013, and references therein).
4.2 Mapping gas-phase composition
Of the 191 different mass channels extracted from the CIR-
TOF-MS data for analysis (i.e. 65 < m/z < 255), the Mann–
Whitney test identified 151 as significant for one or more of
the terpene precursor groups tested. These data were subse-
quently subjected to PCA. From inspection of the Eigenval-
ues derived, four principal components (PCs) were selected
for analysis, which collectively accounted for 96 % of the
variance within the data, with PCs 1 and 2 accounting for
the vast majority, i.e. 63 and 18 %, respectively. This step,
therefore, reduced the temporal traces of 191 mass spectrum
peaks to four composite and orthogonal dimensions.
www.atmos-chem-phys.net/15/8077/2015/ Atmos. Chem. Phys., 15, 8077–8100, 2015
8. 8084 K. P. Wyche et al.: Mapping gas-phase organic reactivity and concomitant SOA formation
−0.4 −0.2 0 0.2 0.4 0.6 0.8
−0.5
−0.4
−0.3
−0.2
−0.1
0
0.1
0.2
0.3
0.4
0.5
PC 1 (62.86%)
PC2(18.19%)
M65
M66
M67
M68
M70
M72
M73
M75
M76
M77
M78
M83
M85
M87
M93
M95
M97
M99
M101
M107
M108
M109
M111
M123
M127
M135
M139
M141M143
M147
M149
M151
M153
M163
M165
M169
M177
M191
M203
M206
M207M209
M219
M221
M235
M237
M253
isoprene
c−m−terpene
sesquiterpene
s−m−terpene
mz
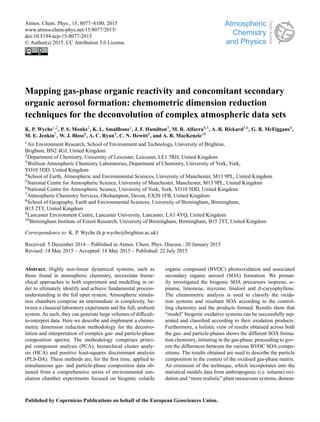
Figure 2. PCA loadings bi-plot of the second vs. first principal components derived from the PCA analysis of the isoprene, cyclic
monoterpene (c-m-terpene in the legend; α-pinene and limonene), sesquiterpene (β-caryophyllene) and straight chain biogenic (s-m-
terpene in the legend; myrcene and linalool) chamber data. Classification confidence level is 95 %. Tentative assignments of major ions,
include m/z 71 – methyl vinyl ketone and methacrolein, 75 – hydroxy acetone, 83 – C5-hydroxy carbonyls/3-methyl furan, 87 – C4-
hydroxycarbonyls/methacrylic acid, m/z 237 – β-caryophyllene aldehyde, 235 and 253 – β-caryophyllene secondary ozonide (and isomers
thereof), m/z 107, 151 and 169 – piononaldehyde and limononaldehyde, 139 – limonaketone, m/z 93 – 4-vinyl-4-pentenal and 4-hydroxy-
4-methyl-5-hexen-1-al. See main text (Sect. 4.2 and Table 3) for further information. For clarity, the scale has been set to show the bulk of
the data; hence, precursor parent ions and m/z 71 are not shown.
Figure 2 shows a loadings bi-plot of PC2 vs. PC1. It is
clear from Fig. 2, that the model is able to successfully sep-
arate the four different classes of biogenic systems investi-
gated. β-caryophyllene mass spectra are grouped in the upper
left-hand quadrant of Fig. 2, the monoterpenes in the lower
left-hand quadrant and isoprene to the centre right. More-
over, the principal component analysis is able to distinguish
between the cyclic monoterpene experiments of limonene
and α-pinene (grouped into one class), and the straight chain
monoterpene experiments of myrcene and linalool (grouped
into a second class), albeit with the latter having a greater
spread in confidence.
The m/z loadings of the PCA allow us to understand how
the spectral fingerprints of the different terpene oxidation
systems are grouped/separated by the PCA model. The first
set of ions that contribute to separation of the different ter-
pene systems comprises the protonated parent ions (MH+) of
the precursors themselves (and major fragments thereof), i.e.
m/z 69 for isoprene, 137 (and fragment 81) for all monoter-
penes (regardless of structure) and 205 for β-caryophyllene.
Important contributions are to be expected from the respec-
tive parent ions (being the basis for the use of chemical-
ionisation mass spectrometry as an analyser of gas mixtures;
Blake et al., 2009). Our purpose here goes beyond identifi-
cation of precursor and intermediate VOCs to an interpreta-
tion of reaction pathways in complex mixtures and potential
linkages to SOA. In doing this, a certain amount of disam-
biguation of isobaric compounds becomes possible; indeed,
as discussed in more detail below, Fig. 2 clearly shows sepa-
ration between cyclic and non-cyclic monoterpene oxidation
groups, both of which have precursors of molecular weight
(MW) 136 g mol−1. Note, for clarity within Fig. 2, the scale
has been set to show the bulk of the data; hence, precursor
parent ions and m/z 71 are not shown.
Moving past the precursors into the detailed chem-
ical information provided by the oxidation products
formed within the chamber, we can see from the
data and Fig. 2 that amongst others, m/z 71 (methyl
vinyl ketone and methacrolein), 72 (methyl vinyl ketone
and methacrolein C13 isotope), 75 (hydroxy acetone),
83 (C5-hydroxy carbonyls/3-methyl furan) and 87 (C4-
hydroxycarbonyls/methacrylic acid) all contribute to separa-
tion of the isoprene group, and m/z 237 (β-caryophyllene
aldehyde) and 235 and 253 (β-caryophyllene secondary
ozonide and isomers thereof) to that of the β-caryophyllene
group. The monoterpene groupings are influenced by the
Atmos. Chem. Phys., 15, 8077–8100, 2015 www.atmos-chem-phys.net/15/8077/2015/
9. K. P. Wyche et al.: Mapping gas-phase organic reactivity and concomitant SOA formation 8085
presence of m/z 107, 151 and 169 (primary aldehydes, pi-
ononaldehyde and limononaldehyde) and 139 (primary ke-
tone, limonaketone) ions in their mass spectra. Helping to
separate the straight chain from cyclic monoterpenes are
m/z 95 and 93, relatively dominant features in both the
myrcene and linalool spectra (relative abundance 10–24 %
for m/z 93). m/z 93 has previously been identified as a major
fragment ion of first generation myrcene and linalool prod-
ucts 4-vinyl-4-pentenal and 4-hydroxy-4-methyl-5-hexen-1-
al, respectively (Shu et al., 1997; Lee et al., 2006). A list of
major ions contributing to the separation of spectra in sta-
tistical space is given in Table 3 along with potential identi-
ties and precursors. It is worthy of note here that these ions
and the overall fragmentation patterns observed in this study
are largely in-line with those reported by Lee et al. (2006),
in their comprehensive PTR-MS analysis of a wide range of
BVOC precursors and their associated oxidation products.
4.3 Implementation of the model to classify mesocosm
data
Having employed the terpene data as a training set to con-
struct a PCA model, a test set of mesocosm data was intro-
duced in order to investigate the ability of the model to map
the classification of more complex biogenic mixtures. In this
instance the mesocosm test set comprised two birch tree and
two fig tree photooxidation experiments, containing a more
complex and “realistic” mixture of various different VOCs
(Wyche et al., 2014). The resultant scores plot is shown in
Fig. 3.
Figure 3 demonstrates that the model can successfully dis-
tinguish between the two different types of mesocosm sys-
tems. Moreover, the model correctly classifies the meso-
cosm systems within the PCA space, with the birch trees,
which primarily emit monoterpenes and only small quantities
of isoprene (Wyche et al., 2014), grouped with the single-
precursor monoterpene cluster and the fig trees, which pri-
marily emit isoprene and camphor and only a small amount
of monoterpenes (Wyche et al., 2014), grouped between
the monoterpene and isoprene clusters. Investigation of the
mesocosm mass spectra and PCA loadings shows that mass
channels 137, 139, 107, 95, 93, 81 and 71 are amongst fea-
tures important in classifying the birch tree systems, with the
relatively strong presence of m/z 93 suggesting the emis-
sion of non-cyclic as well as cyclic monoterpenes from the
birch trees. This was confirmed by cross reference with GC-
MS analysis, which showed that the acyclic monoterpene,
ocimene, was the third most abundant monoterpene present
in the birch tree emissions (Wyche et al., 2014). For the fig
tree systems, mass channels 153, 81, 73, 71 and 69 are key
for classification, with the presence of small quantities of
camphor (m/z 153) and monoterpenes (m/z 81) causing the
group to undergo a lateral shift in the PCA space, along PC1
away from the single-precursor isoprene cluster.
−30 −20 −10 0 10 20 30 40 50 60
−30
−20
−10
0
10
20
30
Scores on PC 1 (62.86%)
ScoresonPC2(18.19%)
isoprene
c−m−terpene
sesquiterpene
s−m−terpene
Fig
Birch
95% Confidence Level
Figure 3. PCA scores plot of the second vs. first principal compo-
nents derived from the PCA analysis of the mesocosm test set using
the PCA model derived from the isoprene, cyclic monoterpene (α-
pinene and limonene), sesquiterpene (β-caryophyllene) and straight
chain monoterpene (myrcene and linalool) chamber data. Classifi-
cation confidence level is 95 %.
−30 −20 −10 0 10 20 30 40 50 60
−30
−20
−10
0
10
20
30
Scores on PC 1 (62.86%)
ScoresonPC2(18.19%)
isoprene
c−m−terpene
sesquiterpene
s−m−terpene
toluene
95% Confidence Level
Figure 4. PCA scores plot of the second vs. first principal compo-
nents derived from the PCA analysis of the toluene test set using
the PCA model derived from the isoprene, cyclic monoterpene (α-
pinene and limonene), sesquiterpene (β-caryophyllene) and straight
chain monoterpene (myrcene and linalool) chamber data. Classifi-
cation confidence level is 95 %.
As a further test of the technique to distinguish between
and to classify VOCs and the matrix of oxidised organic
compounds that may derive from their atmospheric chem-
istry, test data from an anthropogenic system was introduced
into the model. In this instance, the toluene photooxidation
system was employed. Toluene is an important pollutant in
urban environments, originating for example from vehicle
exhausts and fuel evaporation; furthermore, it represents a
model mono-aromatic, SOA precursor system (e.g. Bloss et
al., 2005). As can be seen from the resultant scores plot in
Fig. 4, the model is also able to discriminate the anthro-
www.atmos-chem-phys.net/15/8077/2015/ Atmos. Chem. Phys., 15, 8077–8100, 2015
11. K. P. Wyche et al.: Mapping gas-phase organic reactivity and concomitant SOA formation 8087
0 0.2 0.4 0.6 0.8 1 1.2 1.4 1.6 1.8
0
5
10
15
20
25
30
35
Distance Between Cluster Centers
I1
I3
I8
I4
I5
I6
I2
I7
I9
I10
FT1
FT2
A1
A4
L3
L4
A2
L1
L6
A3
BT1
L5
L2
BT2
M1
LN1
M2
LN2
B1
B4
B2
B3
B7
B6
B9
B5
B10
B8
Figure 5. Dendrogram showing the grouping relationship between the various gas-phase matrices of systems examined. Red – isoprene, pink
– fig, green – cyclic monoterpenes (α-pinene and limonene), yellow – birch, light-blue – straight chain monoterpenes (myrcene and linalool)
and dark-blue – sesquiterpene (β-caryophyllene).
pogenic system from those of biogenic origin. Besides the
protonated toluene parent ion, those ions contributing to the
positioning of the toluene cluster within the PCA space, in-
clude the protonated parent ions m/z 107 and 109 respec-
tively, i.e. the ring retaining primary products benzaldehyde
and cresol; m/z 123, i.e. the ring retaining secondary prod-
uct, methyl benzoquinone; and m/z 99 and 85, i.e. higher-
generation, ring-opening products (e.g. 4-oxo-2-pentenal and
butenedial, respectively). A brief discussion regarding aro-
matic BVOCs is provided separately in the Supplement.
4.4 Cluster analysis and classification
The relationships between the various terpene and mesocosm
systems and their groupings with respect to one another can
be explored further via the implementation of HCA; Fig. 5
gives the dendrogram produced. Inspection of Fig. 5 provides
further evidence that the various systems in the four classes
of terpenes investigated distinctly group together, with over-
all relatedness < 1 on the (centroid) distance between clusters
scale using the Mahalanobis distance measure (Mahalanobis,
1936). Figure 5 shows that the sesquiterpene oxidation sys-
tem has the most distinct spectral fingerprint (containing dis-
tinctive, higher mass oxidation products, e.g. m/z 253) and
that the cyclic and straight chain monoterpene systems ap-
pear the most similar (with some common features alongside
key, unique precursor/mechanism specific product patterns,
e.g. m/z 93 for myrcene and linalool), grouping together
with subclusters of cyclic and non-cyclic precursors. The
monoterpene dominated birch tree mesocosm experiments
are grouped with the cyclic monoterpenes and show a close
relationship with non-cyclic monoterpene systems. Being
dominated by isoprene emissions, yet with some monoter-
penes and camphor present, the fig tree mesocosm experi-
ments group separately but with a relatively close degree of
relation to the single-precursor isoprene experiments.
In order to advance our chemometric mapping of biogenic
systems beyond PCA and HCA (which do not consider user
supplied a priori observation “class” information) and to pro-
vide a degree of quantification to our analysis, a PLS-DA
using six latent variables (LVs) was conducted on the ter-
pene and mesocosm data. For the PLS-DA, the experiments
were grouped into their respective “classes”, i.e. hemiterpene
– isoprene; cyclic monoterpene – α-pinene and limonene;
sesquiterpene – β-caryophyllene; non-cyclic monoterpene –
myrcene and linalool; birch trees; fig trees. Figure 6 shows
a plot of the resultant scores on the first three LVs (account-
ing for ∼ 85 % of the variance), from which it is clear that the
PLS-DA is able to successfully discriminate between the four
terpene classes, and places the monoterpene dominant birch
www.atmos-chem-phys.net/15/8077/2015/ Atmos. Chem. Phys., 15, 8077–8100, 2015
12. 8088 K. P. Wyche et al.: Mapping gas-phase organic reactivity and concomitant SOA formation
Figure 6. Scores plot of the first three latent variables derived from
the PLS-DA model analysis of the isoprene, cyclic monoterpene
(α-pinene and limonene), sesquiterpene (β-caryophyllene), straight
chain monoterpene (myrcene and linalool), fig and birch chamber
data. Classification confidence level is 95 %.
experiments within the single-precursor monoterpene clus-
ter, and the isoprene dominant fig experiments close to the
single-precursor isoprene cluster within the statistical space.
The greater spread in confidence of the non-cyclic monoter-
pene group is likely to result, to some extend, from the low
number of repeat experiments employed (i.e. only two each
for myrcene and linalool).
As can be seen from inspection of Table 4, model classi-
fication sensitivity and specificity was high in each instance.
Each of the biogenic systems studied were predicted with
100 % sensitivity (with the exception of birch mesocosm),
meaning that each set of experiments (again, except birch
mesocosm) was predicted to fit perfectly within its class.
The relatively low sensitivity obtained for birch mesocosm
(50 %), is most likely a result of the use of only two repeat
experiments in the model, coupled with experiment limita-
tions and ageing trees producing slightly lower emissions
during the final birch mesocosm experiment. All of the sys-
tems were predicted with > 90 % specificity (four of the six
with 100 % specificity), indicating that all experiments are
highly unlikely to be incorrectly classified.
4.5 Mapping particle-phase composition
In order to explore similar classifications and linkages in
the concomitant particle-phase, the PCA, HCA and PLS-
DA techniques were also applied to the off-line LC-MS/MS
spectra obtained from analysis of filter samples and on-line
cTOF-AMS spectra.
As can be seen from inspection of Fig. 7, the detailed
LC-MS/MS aerosol spectra produce PCA results somewhat
similar to those of the gas-phase CIR-TOF-MS spectra,
with distinct clusters of cyclic monoterpenes, straight chain
monoterpenes and sesquiterpenes. From inspection of
the loadings components of the bi-plot (Fig. 7a), we can
see that m/z 237 (3-[2,2-dimethyl-4-(1-methylene-4-oxo-
butyl)-cyclobutyl]-propanoic acid), 251 (β-caryophyllonic
acid), 255 (4-(2-(2-carboxyethyl)-3,3-dimethylcyclobutyl)-
4-oxobutanoic acid), 267 (β-14-hydroxycaryophyllonic
acid and β-10-hydroxycaryophyllonic acid) and 271 (4-(2-
(3-hydroperoxy-3-oxopropyl)-3,3-dimethylcyclobutyl)-4-
oxobutanoic acid or 4-(2-(2-carboxy-1-hydroxyethyl)-3,3-
dimethylcyclobutyl)-4-oxobutanoic acid) are amongst those
ions dominant in classifying the sesquiterpenes. For further
details regarding β-caryophyllene oxidation products, see
for example Lee et al. (2006), Winterhalter et al. (2009),
Hamilton et al. (2011), Chan et al. (2011), Li et al. (2011)
and Jenkin et al. (2012) and references therein, as well as
Sect. 5. Of this set of oxidation products, β-caryophyllonic
acid is common between the gas (i.e. m/z 253) and particle
(i.e. m/z 251) phases.
Similarly, those ions (compounds) significant in isolat-
ing the cyclic monoterpenes include, m/z 169 (pinalic-3-
acid, ketolimononaldehyde and limonalic acid), 183 (pinonic
acid, limononic acid and 7-hydroxylimononaldehyde) and
185 (pinic acid and limonic acid), of which only those com-
pounds of m/z 169 were observed to be of significant contri-
bution to the gas-phase composition (observed as m/z 171;
relative contribution as high as 1–5 % during α-pinene exper-
iments). For further details regarding α-pinene and limonene
oxidation products, see for example Larsen et al. (2001),
Jaoui et al. (2003, 2006), Capouet et al. (2004), Jenkin
(2004), Lee et al. (2006), Ng et al. (2006), Camredon et
al. (2010) and Hamilton et al. (2011) and references therein
as well as Sect. 5. Comparatively little information is avail-
able on the speciated composition of myrcene and linalool
SOA; however from Fig. 7a it is clear that here, compared to
the cyclic monoterpenes, somewhat larger mass compounds
are important in classifying straight chain monoterpenes, e.g.
m/z 321 (adduct ion [M-H2+ FA + Na]− M = 254 Da; po-
tential formulae – C12H14O6, six double bond equivalents
or C13H18O5, five double bond equivalents; indicative of
oligomer formation), 325, 322 (the C13 peak for the m/z 321
ion), 227 (C10H11O6), 215 (C10H15O5) and 199 (C9H11O5).
Compounds of such high molecular weight were not ob-
served in the concomitant gas-phase spectra. A list of ma-
jor ions contributing to the separation of spectra in statistical
space is given in Table 3 along with potential identities and
precursors.
As with the PCA, the dendrogram produced via cluster
analysis of the LC-MS/MS particle-phase data gave three
distinct clusters (Fig. 7b), i.e. cyclic monoterpene, straight
chain monoterpene and sesquiterpene. The corresponding
PLS-DA analysis reported 100 % sensitivity in each case and
100 % specificity for all systems except sesquiterpenes (i.e.
β-caryophyllene = 83 %), suggesting a good level of model
classification for the three types of terpene systems studied.
Atmos. Chem. Phys., 15, 8077–8100, 2015 www.atmos-chem-phys.net/15/8077/2015/
13. K. P. Wyche et al.: Mapping gas-phase organic reactivity and concomitant SOA formation 8089
Table 4. PLS-DA model classification sensitivity and specificity for the gas-phase biogenic air matrices.
Cross- Isoprene Cyclic- Sesquiterpene Straight-chain- Fig tree Birch
validation monoterpene monoterpene tree
Sensitivity (%) 100.0 100.0 100.0 100.0 100.0 50.0
Specificity (%) 100.0 92.9 100.0 100.0 100.0 91.7
Figure 7. (a) Loadings bi-plot of the second vs. first principal components obtained from the PCA of LC-MS/MS aerosol spectra from a
subset of terpene experiments and (b) the corresponding HCA dendrogram. See main text (Sect. 4.5 and Table 3) for further information,
including ion assignments.
Despite utilising the somewhat destructive electron impact
(EI) ionisation technique, the cTOF-AMS produces spectra
of sufficient chemical detail such that the PCA and HCA are
able to successfully differentiate between the groups of ter-
penes tested (Fig. 8a and b). However, unlike the outputs
from the CIR-TOF-MS and LC-MS/MS PCAs, the cyclic
and straight chain monoterpenes in the cTOF-AMS PCA
do not group into two distinct classes, instead they tend to
group in their species-specific sub-classes within the upper
region of the PCA space. Indeed, the PLS-DA gave 100 %
sensitivity and specificity for the cyclic monoterpenes and
sesquiterpenes, but only 75 % sensitivity for the straight
chain monoterpenes, suggesting that the model does less
well at assigning myrcene and linalool cTOF-AMS spectra
to their defined class.
As can be seen from inspection of Fig. 8a, α-pinene,
limonene and linalool tend in general to cluster towards the
upper and right regions of the PCA space, primarily ow-
ing to the significant presence of m/z 43 and to some ex-
tent m/z 44, in their spectra; both ions constituting com-
mon fragments observed in AMS of SOA (Alfarra et al.,
2006). During such chamber experiments, the m/z 43 peak
tends to comprise the CH3CO+ ion, originating from ox-
idised compounds containing carbonyl functionalities; it is
usually representative of freshly oxidised material and semi-
volatile oxygenated organic aerosol (SV-OOA; Alfarra et al.,
2006, 2013).
From further inspection of the loadings bi-plot (Fig. 8a),
we see that the four sesquiterpene (β-caryophyllene) exper-
iments cluster towards the lower left-hand quadrant, their
clustering heavily influenced by the presence of m/z 41 in
their spectra as well as m/z 55, 79 and 95. In EI-AMS,
m/z 41 comprises the unsaturated C3H+
5 fragment (Alfarra
et al., 2006). As well as being influenced by the m/z 41
ion, the myrcene cluster (situated in the region of both the
α-pinene and β-caryophyllene clusters in the PCA space) is
also influenced by m/z 44, i.e. most likely the CO+
2 ion. In
this instance m/z 44 would tend to result from low volatility
oxygenated organic aerosol (LV-OOA), derived from highly
oxidised compounds, including oxo- and di-carboxylic acids
(Alfarra et al., 2004, 2006). For full details regarding the
particle-phase-specific experiments conducted at the MAC,
see Hamilton et al. (2011), Jenkin et al. (2012) and Alfarra et
al. (2012, 2013).
5 Discussion
5.1 Mapping chemistry
Figure 9 provides a highly simplified overview of the cur-
rent state of knowledge regarding the atmospheric oxidation
www.atmos-chem-phys.net/15/8077/2015/ Atmos. Chem. Phys., 15, 8077–8100, 2015
14. 8090 K. P. Wyche et al.: Mapping gas-phase organic reactivity and concomitant SOA formation
0 0.5 1 1.5 2 2.5 3
0
5
10
15
Distance Between Cluster Centers
APIN1
APIN2
LIM4
LIM1
LIM2
LIM3
BCAR1
BCAR2
BCAR3
BCAR4
LIN1
LIN2
MYRC1
MYRC2
c−m−terpene
s−m−terpene
sesquiterpene
sesquiterpene
s-m-terpene
c-m-terpene
cTOF-AMS
10
5
15
0
1 1.50 0.5 2
Distance Between Cluster Centers
32.5
(b)
−1 −0.5 0 0.5 1 1.5
−1
−0.5
0
0.5
1
PC 1 (53.67%)
PC2(40.72%)
APIN1APIN2
LIM1
LIM3
MYRC2
LIN2
M41
M42
M43
M44
M45
M54
M55
M56
M79
M95
M109
M121
c−m−terpene
s−m−terpene
sesquiterpene
mz
PC2(11.83%)
cTOF-AMS
M44
M41
M42
LIN2
MYRC2
s-m-terpene
mz
sesquiterpene
c-m-terpene
APIN2
M43
LIM3
LIM1
1 1.50-0.5 0.5-1
1
0
0.5
-1
-0.5
PC 1 (53.67%)
(a)
Figure 8. (a) Loadings bi-plot of the second vs. first principal components obtained from the PCA of cTOF-AMS aerosol spectra from of
a subset of terpene experiments and (b) the corresponding HCA dendrogram. See main text (Sect. 4.5 and Table 3) for further information,
including ion assignments.
of hemi-, sesqui-, cyclic and straight chain monoterpenes,
showing selected key steps and intermediates on route to
SOA formation. The mechanisms outlined in Fig. 9 underpin
the findings reported here and help to explain how the atmo-
spheric chemistry of the various terpene oxidation systems
and their SOA can be chemometrically mapped with respect
to one another.
From a review of recent literature and from the summary
presented in Fig. 9, it can be seen that isoprene can re-
act to form condensable second and higher-generation ni-
trates in the presence of NOx, e.g. C4-hydroxy nitrate peroxy
acetyl nitrate (C4-HN-PAN in Fig. 9) (Surratt et al., 2010), as
well as condensable OVOCs, e.g. hydroxymethyl-methyl-α-
lactone (HMML) (Kjaergaard et al., 2012) and methacrylic
acid epoxide (MAE) (Lin et al., 2013), via metharcolein
(MACR) and methacryloyl-peroxy nitrate (MPAN). Alter-
natively, under “low NOx” conditions (e.g. < 1 ppbV) iso-
prene can react to form condensable second-generation epox-
ides, e.g. isoprene epoxides (IEPOX), via primary perox-
ides (ISOPOOH) (Paulot et al., 2009a; Surratt et al., 2006).
Such C4 and C5 saturated, low volatility species consti-
tute the monomer building blocks that proceed to form rel-
atively high O : C ratio (nitrated in the presence of NOx
and sulfated in the presence of H2SO4) isoprene SOA
oligomers (e.g. 2-methyl tetrol dimer, O : C = 7 : 9) (Claeys
et al., 2004; Surratt et al., 2006, 2010; Worton et al.,
2013). Consequently, the gas-phase composition under con-
ditions forming isoprene SOA will therefore be dominated
by relatively low MW monomer precursors, e.g. MACR
(MH+ = m/z 71 in the CIR-TOF-MS spectra), isoprene ni-
trates (ISOPN in Fig. 9; MH+-HNO3 = m/z 85) and MPAN
(MH+H2O-HNO3 = m/z 103) under “high NOx” condi-
tions (e.g. ∼ 10s–100s ppbV (Paulot et al., 2009b; Surratt
et al., 2006, 2010), and ISOPOOH and IEPOX (MH+-
H2O = m/z 101) under “low NOx” conditions. For the “high
NOx” isoprene experiments conducted here, besides m/z 71,
i.e. MACR (measured together with methyl vinyl ketone),
m/z 87, 85, 83 and 75, i.e. (tentatively assigned to be)
C4-hydroxycarbonyls/methacrylic acid, ISOPN, C5-hydroxy
carbonyls (C5HC in Fig. 9)/3-methyl furan (3-MF) and hy-
droxy acetone, respectively, were significant in classifying
the isoprene group; MPAN at the m/z 103 ion was only a
minor contributor. It should be noted that in theory, both
HMML and MAE (MH+ = m/z 103) may produce fragment
ions of m/z 85 (i.e. MH+-H2O) following PTR ionisation;
however without further detailed characterisation we are un-
able at this stage to postulate their fractional contribution to
the measured m/z 85 signal.
Depending on the chemistry involved (Fig. 9), poten-
tial SOA forming monoterpene products will either be (six-
member) ring-retaining (e.g. from reaction with OH) or (six-
member) ring cleaved (e.g. from reaction with OH or O3),
leading to gas-phase spectra with mid-MW C9 and C10 oxy-
genated (and nitrated in the presence of NOx) products (e.g.
Kamens and Jaoui, 2001; Larsen et al., 2001; Capouet et al.,
2004; Yu et al., 2008; Camredon et al., 2010; Eddingsaas
et al., 2012a and b). Both (six-member) ring-retaining and
(six-member) ring-opening products have been observed in
monoterpene SOA (e.g. Yu et al., 1999; Larsen et al., 2001;
Camredon et al., 2010), with the latter generally being domi-
nant in terms of abundance (Camredon et al., 2010). Further-
more, (six-member) ring-opening products are believed to
undergo chemistry within the aerosol to form relatively low
O : C ratio oligomers (e.g. 10-hydroxy-pinonic acid-pinonic
acid dimer, O : C = 7 : 19) (Gao et al., 2004; Tolocka et al.,
2004; Camredon et al., 2010).
OH will react with straight chain monoterpenes, such as
myrcene, primarily by addition to either the isolated or the
conjugated double bond system. Reaction at the isolated
C=C bond can proceed via fragmentation of the carbon
backbone, producing acetone and mid-MW, unsaturated C7
OVOCs (and/or NVOCs, depending on NOx levels). Reac-
Atmos. Chem. Phys., 15, 8077–8100, 2015 www.atmos-chem-phys.net/15/8077/2015/
15. K. P. Wyche et al.: Mapping gas-phase organic reactivity and concomitant SOA formation 8091
isoprene
O
MACR
O
OONO2
MPAN
ISOPOOH
OOH
HO
O
HO
OHIEPOX
ONO2
HO
HO
O
O
O
ONO2
OONO2
HO
C4-HN-PAN
C4-HN-PAN
HO
O
OH
2-MG
IEPOX
OH
O
ONO2
HO
OH
HO
OH
OH
OH
2-MT
HO
OH
OH
C5-alkene triol
3-MF
O
OH
OH
OH
OH
OH
HOO
O
OH
OH
ONO2
HO
O
ONO2
ONO2
HO
OH
ISOPN
Nitrooxypolyol
Nitrooxypolyol
ONO2
ONO2
HO
O
O
OH
OH
OH / O2 / NO
OH / O2
/ NO2
OH / O2
/ NO
OH / O2 / NO
OH / O2 / NO
OH / O2 / HO2
OH / O2 / HO2 / NO
re.
re.
X
OH
O
OH
O
PINON
O
O
PINAL
O
OH
O
10-H-PINON
HO
Z
HO
X
OH
OH
O
Y
PINALIC / PINIC
O3 / O2 / HO2 , RO2
O
O
NORPINAL
OH / O2 / NO /
HO2 , RO2
α-pinene
PINON PINALIC / PINIC 10-H-PINON
OH
OH
HO
OOH
HO
ONO2
e.g. e.g.e.g.
HO
O O
O
O
O
OH
Oligomer formation, e.g.
GAS PHASE
AEROSOL PHASE
Oligomer formation
(+ 2-MG)
C5HC
AP1.1
AP1.2
AP1.3
APINBOH
APINCOOH
C720NO3
*
* * O3 / O2 / HO2 , RO2*
*
OH
O
O
OH
O
O
HMML
MAE
OH
HMML MAE
nitrate
Oligomer formationOligomer formation
O
O O OO
OH
OO
OH
ONO2
O
O O OO
OH
OO
XXX
BCSOZ
C141CO2H
BCAL
BCANO3
C126CHO
C141CO2H BCANO3
O
O O
O2NO
HO
BCSOZNO3
OO
OH
O
C131CO2H
e.g. e.g.
O
OH
O
OH
C126CHO
X
O
OH
O
OH
e.g.
O
O
OH
O
OHOO
HOO
HO
BCALOOH
O3
OH / O3 / NO, RO2
O3 / RO2 , HO2
O3
* * * *
myrcene
OH
Z
OH
O
+
OHO
O OH
O
O
OO3
OH
Y
ONO2
e.g.
MYR1.1
MYR1.2
MYR2.4
MYR3.2
MYR2.1
MYR2.2
MYR1.3
HO
O OH
MYR2.3
O
HO
O O
O
OHO
OHO
O OH
*
e.g. OH / O2 / NO
O
OH
ONO2
MYR3.1
e.g. OH / O2 / NO
MYR3.3
MYR3.O
MYR3.1
MYR2.1
MYR3.2
MYR2.2
MYR2.3
MYR3.3
? ?
OH
O
O
OH
e.g. OH / O2 / NO
e.g. OH / O2 / NO
MYR2.4
e.g. OH / O2 / NO
??
MYR1.3
O
O
OH
OH
O
O
OH
O
HO
O
O
OH OH
OH
OH
O
Potential oligomer formation
e.g.
BCAL
*
dec.
GAS PHASE
AEROSOL PHASE
e.g. OH / O2 / NO
Figure 9. Simplified schematic illustrating some of the important mechanistic pathways in the gas-phase oxidation of isoprene, α-pinene,
β-caryophyllene and myrcene, and the associated mass transfer to the particle phase (obtained from the current literature; see text, Sect. 5
for references). Red arrows and text represent “high NOx” pathways, green arrows and text – “low NOx” pathways, blue arrows and
text – ozonolysis reactions, grey arrow and text – speculative and dashed arrows – multiple steps. * represents multiple photooxidative
routes initiated by reaction with OH (i.e. involving the reactants – OH, O2, NO, HO2 and/or RO2), leading to structurally similar products
containing different functional groups. α-pinene mechanism – X = OH, =O, OOH or ONO2; Y = CHO or C(O)OH; Z = OH, OOH or
ONO2. β-caryophyllene mechanism – X = CH2OH(OH), CH2OH(OOH), CH2OH(ONO2) or = O. Myrcene mechanism – Y = OOH or
ONO2; Z = CHO or C(O)OH.
www.atmos-chem-phys.net/15/8077/2015/ Atmos. Chem. Phys., 15, 8077–8100, 2015
16. 8092 K. P. Wyche et al.: Mapping gas-phase organic reactivity and concomitant SOA formation
tion at the conjugated double bond system in myrcene would
be expected to form formaldehyde in conjunction with either
a C9 aldehyde or C9 ketone. Structure activity relationships
(SARs) predict that the conjugated double bond system ac-
counts for almost half of the OH reactivity. The conjugated
double bond would therefore be expected to have a partial
rate coefficient of the order of 1 × 10⁻¹⁰ cm3 molec−1 s−1
(i.e. similar to OH + isoprene) (Atkinson and Arey, 2003b).
Consistent with this, the reported yields of acetone and
formaldehyde from OH + myrcene are similar (Atkinson and
Arey, 2003b), suggesting that the isolated double bond and
the conjugated double bond system have comparable OH re-
activity, as such we would expect C9 and C7 co-products
to be formed in comparable yields. With a significant frac-
tion of reactions with OH leading to the loss of three carbon
atoms from the parent structure, the straight chain monoter-
pene gas-phase spectra tend to contain fewer features of
MW greater than that of the precursor and more mid-MW
features. It tends to be these mid-MW features, such as
m/z 111 and 93 (e.g. 4-vinyl-4-pentenal – MYR 1.2 in
Fig. 9, MH+ and MH+-H2O, respectively) and 113 (e.g.
2-methylenepentanedial, MH+; Lee et al., 2006) that assist
in the classification of the straight chain monoterpene ex-
periments within the statistical space. Besides these ions,
m/z 139 (primary myrcene C9 aldehyde and/or C9 ketone
product) also assists in separating the myrcene spectra from
those of α-pinene.
By comparing both the gas- and particle-phase PCA re-
sults for cyclic monoterpenes in Figs. 2 and 7a, it is evident
that the dominant loadings represent compounds of similar
MW, i.e. m/z 169, 151 and 107 (primary aldehyde product,
e.g. pinonaldehyde- PINAL in Fig. 9, parent ion and frag-
ments thereof) and 139 (primary ketone product parent ion)
for the gas phase and m/z 187, 185, 183 and 169 for the par-
ticle phase. Conversely, for the straight chain monoterpene
experiments the major gas-phase loadings represent com-
pounds of significantly smaller MW than their particle-phase
counterparts, i.e. m/z 113, 111 and 93, compared to m/z 325,
322, 321, 227 and 215. Indeed, the straight chain monoter-
pene LC-MS/MS spectra contained on average ∼ 10 % more
signal > 250 Da than the cyclic monoterpene spectra. Also,
the composition of the ions observed in the straight chain
monoterpene LC-MS/MS spectra suggests that the SOA par-
ticles contained both oligomers and highly oxidised species
with the C10 backbone intact (i.e. O : C = 0.6), similar in
structure to (but a little less oxidised than) extremely low
volatility organic vapours (ELV-VOC), which have been ob-
served previously in significant yield from α-pinene and
limonene (as well as 6-nonenal) ozonolysis chamber exper-
iments in the absence of an OH scavenger, as well as from
boreal forests in Finland (Ehn et al., 2014). Further evidence
to elucidate the type of SOA formed from the oxidation of
straight chain monoterpenes can be obtained from investiga-
tion of the grouping of myrcene spectra in the cTOF-AMS
PCA (Fig. 8a). In the hour-4 cTOF-AMS PCA loadings bi-
plot, we see that the grouping of the myrcene spectra is in-
fluenced somewhat by both m/z 41 and 44, indicating the
presence of unsaturated hydrocarbon material and LV-OOA
in the SOA, potentially a result of oligomerisation or further
oxidative heterogeneous chemistry involving reaction at re-
maining C=C double bond site(s).
β-caryophyllene readily forms particulate matter on oxi-
dation (e.g. Jaoui et al., 2003; Lee et al., 2006; Winterhalter
et al., 2009; Alfarra et al., 2012; Chen et al., 2012), with re-
action predominantly at one of the two C=C sites, e.g. with
OH or O3, although O3 attack occurs almost exclusively at
the endocyclic double bond (Jenkin et al., 2012), yielding
relatively low vapour pressure, unsaturated and oxygenated
primary products (Fig. 9), which have significant affinity for
the particle-phase (Jenkin et al., 2012). A further oxidation
step involving the second C=C site can result in increased
oxygen (and/or nitrogen, depending on NOx conditions) con-
tent, yet with little, if any reduction in the original C num-
ber. As with the cyclic monoterpene PCAs, the CIR-TOF-
MS and LC-MS/MS PCA bi-plots demonstrate similarities in
terms of classifying β-caryophyllene oxidation and SOA for-
mation with comparable MW species, e.g. primary products
β-caryophyllene aldehyde (MW 236, BCAL in Fig. 9) and
β-caryophyllene secondary ozonide in the gas-phase (MW
252, BCSOZ in Fig. 9), β-caryophyllonic acid (MW 252,
C141CO2H in Fig. 9) in both phases and secondary product
β-nocaryophyllinic acid (MW 254, C131CO2H in Fig. 9) in
the particle-phase. In the hour-4 cTOF-AMS PCA loadings
bi-plot, the myrcene and β-caryophyllene clusters are located
adjacent to one another, with β-caryophyllene classification
primarily influenced by the m/z 41 peak, which as described
above, is indicative of unsaturated hydrocarbon content (Al-
farra et al., 2012).
5.2 Mapping within a class
Within the cyclic monoterpene group there is a small de-
gree of separation between the limonene and α-pinene ex-
periments, with three out of the four α-pinene experiments
located to the upper and right region of the monoterpene clus-
ter. This distribution/separation within the group may be a
consequence of precursor-specific reaction pathways; for in-
stance, although structurally similar, α-pinene and limonene
react at somewhat different rates with respect to both OH and
O3 (Atkinson and Arey, 2003a). Over a fixed time period,
such system reactivity will govern the degree of oxygenated
content present within a closed analyte matrix and may facil-
itate the isolation of specific reaction pathways. Furthermore,
the separation of such similar gas-phase precursors within a
class cluster may help us to elucidate differences in resultant
SOA yield and composition (e.g. limonene tends to have a
larger SOA yield than α-pinene; Lee et al., 2006; Fry et al.,
2014). It therefore may be possible with the use of larger and
more detailed data sets, to employ loading information to de-
termine the importance of certain products to SOA composi-
Atmos. Chem. Phys., 15, 8077–8100, 2015 www.atmos-chem-phys.net/15/8077/2015/
17. K. P. Wyche et al.: Mapping gas-phase organic reactivity and concomitant SOA formation 8093
tion. However, additional data to those reported here would
be required to fully test this hypothesis.
5.3 Mapping reactivity
In order to explore how the PCA technique can be used
to investigate product distributions driven by certain start-
ing conditions, a separate analysis was conducted on the
five toluene experiments. In this instance we investigate the
product distribution dependency on initial VOC / NOx ra-
tios. The VOC / NOx ratios employed nominally represent
“low”, “medium” and “high” NOx conditions, with values of
roughly 11 (i.e. low NOx, “NOx-limited” ozone formation
conditions – as determined from simulation chamber ozone
isopleth plots; see Wagner et al., 2003; two experiments), 4
(i.e. moderate NOx; two experiments) and 1 (i.e. high NOx,
“VOC-limited”; one experiment), respectively. The resultant
PCA loadings bi-plot (produced using the methodology de-
scribed in Sect. 3) is given in Fig. 10.
From inspection of the PCA loadings bi-plot in Fig. 10,
it is clear that the toluene photooxidation spectra dis-
tribute in statistical space according to their respective ini-
tial VOC / NOx ratios. Figure 10 shows the low NOx, high
VOC / NOx ratio experiments grouped in the lower right-
hand quadrant of the PCA space, principally influenced by
loadings representing toluene (m/z 93 and 77, parent and
fragment ions, respectively; note m/z 93 off-scale in Fig. 10)
and cresol (m/z 109). Summed spectra containing larger
quantities of precursor would suggest the presence of a less
reactive environment, which is the case here, where low NOx
levels in the NOx limited regime, result in low [OH] (reduced
radical cycling) and low [O3] (less NO to NO2 conversions)
(see also Bloss et al., 2005). Similarly, the relatively large
contribution from cresol to the low NOx summed spectra,
originates from a larger net cresol concentration across the
experiment on account of low system reactivity (i.e. loss via
reaction with OH).
The moderate NOx, medium VOC / NOx experiments
group uniquely in the lower left-hand quadrant of the
PCA space in Fig. 10, principally on account of load-
ings representing benzaldehyde (m/z 107) and the ring-
opening products: citraconic anhydride (m/z 113); 4-oxo-2-
pentenal, maleic anhydride and/or angelicalactone (m/z 99)
and methyl glyoxal (m/z 73). The greater abundance of
higher-generation, ring-opening products implies a more re-
active environment (i.e. increased chemical processing) than
that formed under low NOx conditions. Larger net benzalde-
hyde concentrations are likely to originate from greater sys-
tem reactivity and greater abundance of NO to fuel the form-
ing RO2 + NO reaction.
The high NOx, low VOC / NOx ratio experiment is sited
in the left-hand half of Fig. 10, on account of it possess-
ing higher system reactivity (with respect to the low NOx
experiments) and the resultant greater proportion of ring-
opening product ions (as is the case for the moderate NOx
PC 1 (63.88%)
-0.6 -0.4 -0.2 0 0.2 0.4 0.6 0.8 1
PC2(23.93%)
-1
-0.5
0
0.5
T1
T2
T3
T4
T5
M65
M69
M71
M73
M77
M79
M83
M86
M87
M89
M94
M97
M99
M101
M105
M107
M108
M109
M110
M111M113 M123
M127
M129
M149
Low
Medium
High
mz
Figure 10. PCA loadings bi-plot of the second vs. first princi-
pal components derived from the PCA analysis of the toluene
experiments. Experiments were conducted under low NOx,
high VOC / NOx ratio (red diamonds), moderate NOx, medium
VOC / NOx ratio (green squares) and high NOx, low VOC / NOx
ratio (blue triangle) conditions. For clarity, the scale has been set to
show the bulk of the data; hence, m/z 93 and 85 are not shown.
experiments). However, the low VOC / NOx ratio experi-
ment is uniquely displaced into the upper region of the PCA
space owing to a large contribution from 2-butenedial and/or
2(5H)-furanone (m/z 85, off scale in Fig. 10) to the summed
spectra (the yields of both of which are likely to be impor-
tant under high NOx conditions, owing to reaction through
the RO2+ NO channel).
6 Atmospheric relevance and future directions
Having successfully used the mechanistic fingerprints in the
chamber data to construct descriptive statistical models of the
gas and particle phases, and having applied the methodology
to map mesocosm environments, a next logical step would be
to use this detailed chemical framework to investigate ambi-
ent VOC and SOA composition data, in an attempt to help
elucidate and deconvolve the important chemistry controlling
the gas- and particle-phase composition of inherently more
complex real-world environments.
If ambient biogenic gas/particle composition spectra of
unknown origin, uncertain speciated composition and/or a
high level of detail and complexity were to be mapped onto
the relevant statistical model (i.e. introduced as a separate test
set), their resultant vector description in the statistical space
could provide information regarding the type of precursors
present and the underlying chemical mechanisms at play, as
exemplified by the classifying of the mesocosm experiments
by the fraction of isoprene, monoterpene and sesquiterpene
www.atmos-chem-phys.net/15/8077/2015/ Atmos. Chem. Phys., 15, 8077–8100, 2015
18. 8094 K. P. Wyche et al.: Mapping gas-phase organic reactivity and concomitant SOA formation
chemistry in the experimental fingerprints. Furthermore, as
shown by the mapping of toluene photooxidation experi-
ments into a separate and distinct cluster, the methodology
is potentially able to be robust with respect to other chemical
compositions expected for a real-world environment that is
significantly impacted by both anthropogenic and biogenic
emissions (e.g. Houston, USA and the Black Forest – Mu-
nich, DE). This capability is important when attempting to
understand the complex interactions that exist between ur-
ban and rural atmospheres and when attempting to under-
stand VOC and SOA source identification.
One potential problem in moving from simulation cham-
ber data to real-world systems, would be the applicability
of using “static” experimental spectra (i.e. time averaged) to
build a model to accept “dynamic” data, in which there would
be potentially overlapping reaction coordinates and multiple
precursor and radical sources.
In order to investigate the impact of a more dynamic sys-
tem on the composition of the gas-phase matrix and hence on
the composition of the spectra employed to build the model,
a zero-dimensional chamber box model was constructed for
the α-pinene system and operated under three different sce-
narios:
1. Basic chamber simulation: α-pinene concentration
constrained to measurements (initial concentration
124 ppbV); NO and NO2 initialised according to mea-
surements (31 and 41 ppbV, respectively).
2. Spiked chamber simulation: α-pinene constrained as in
(1), but profile duplicated to represent a fresh injection
of the precursor (at the midpoint of the experiment) on
top of the already evolving matrix; constant 10 ppbV
HONO employed as NO and radical source.
3. Constant injection chamber simulation: α-pinene and
HONO constrained to constant values of 5 and 10 ppbV,
respectively.
It should be noted here that the model runs are not ide-
alised. The aim of these simulations is only to provide sys-
tematically more complex chemical systems with which to
compare and contrast a simulation representing the measured
data set. For work regarding the evaluation of the MCM with
respect to single VOC precursor chamber experiments (in-
cluding model-measurement intercomparison), see, for ex-
ample, Bloss et al. (2005) (toluene), Metzger et al. (2008) and
Rickard et al. (2010) (1,3,5-TMB), Camredon et al. (2010)
(α-pinene) and Jenkin et al. (2012) (β-caryophyllene).
The results of the three different model scenarios are given
in Fig. 11, mapped through to the resultant simulated mass
spectra (i.e. integrated across the experiment).
Figure 11a and b show the results from scenario (1). Fig-
ure 11a gives the evolution of the system over the molec-
ular weight region of interest with time and Fig. 11b gives
the scenario summed “model mass spectra”, i.e. the relative
Figure 11. Results from MCM α-pinene photooxidation simula-
tions. (a) and (b) represent basic α-pinene photooxidation; (c) and
(d) – spiked injection of α-pinene, continuous HONO input; (e) and
(f) – continuous α-pinene and HONO input. Left-hand image plots
show the evolution of the respective systems over the molecular
weight region of interest with time; colour scale represents relative
abundance (%). Right-hand plots represent (b) relative abundance
of simulated molecular weights during straight α-pinene photooxi-
dation; (d) difference in relative abundance of simulated molecular
weights between double injection of α-pinene continuous HONO
input and straight α-pinene photooxidation; (f) difference in rela-
tive abundance of simulated molecular weights between continuous
α-pinene and HONO input and straight α-pinene photooxidation.
See text for details.
abundance of all simulated compounds within the gas-phase
molecular weight region of interest (with relative contribu-
tions from isobaric species summed into a single “peak”).
Scenario (1) and Fig. 11a and b approximate the experimen-
tal data employed within this work and constitute the model
base case.
Figure 11c and d show the results from scenario (2). Fig-
ure 11c clearly shows the second α-pinene injection on top of
the evolving matrix and the resultant system evolution. Fig-
ure 11d shows the “difference model mass spectra” between
scenarios (1) and (2), from which it can clearly be seen that
there is very little difference between the spectra of the ba-
sic model and the “spiked” system. The difference in “mass
channel” relative abundance ( MC) is generally ≤ ±2 %,
Atmos. Chem. Phys., 15, 8077–8100, 2015 www.atmos-chem-phys.net/15/8077/2015/
19. K. P. Wyche et al.: Mapping gas-phase organic reactivity and concomitant SOA formation 8095
with the exceptions of MWs 168 and 186. MW 168 primar-
ily comprises pinonaldehyde, with a MC of around −6 %;
pinonaldehyde is a primary product and is slightly lower in
relative abundance in scenario (2) owing to the longer reac-
tion time employed and the greater proportion of pinonalde-
hyde reacted. MW 186 comprises a number of primary and
secondary products and has a MC of roughly +3 %.
The results from model scenario (3) are given in Fig. 11e
and f. As with scenario (2), there is no dramatic differ-
ence between the simulated mass spectra of scenario (3) and
the base-case scenario (1). In this instance MC is gener-
ally ≤ ±5 %, with the exceptions of MWs 136 and 168 and
MWs 121 and 245. The relative abundance of the precursor
is lower in this case on account of the constraining method
employed and once again the relative abundance of pinon-
aldehyde is slightly lower owing to the longer reaction time.
MW 121 solely comprises PAN and MW 245 primarily com-
prises a C10 tertiary nitrate (C10H15NO6, MCM designation:
C106NO3). Both species are slightly elevated with respect
to the base-case in scenario (3) owing to the longer reaction
time and the continual input of OH and NO into the model in
the form HONO.
Scenarios (2) and (3) represent complex mixtures with
overlapping reaction coordinates, each one step closer to a
real-world case than scenario (1) and the chamber data em-
ployed within this work. However, despite the increase in
complexity of the scenarios, both exhibit very little compo-
sitional difference to the base-case scenario and hence the
chamber data employed in this work. These results give some
confidence that despite being constructed from summed sim-
ulation chamber data, the statistical models employed here
represents a solid framework onto which real atmosphere
spectra could be mapped and interpreted.
A further step in increasing complexity and hence a further
step towards the real-world system, would be the addition of
other (potentially unidentified) precursors to the simulation,
which may be at different stages of oxidation or have passed
through different reactive environments. Further increases in
complexity, beyond the analysis discussed here, will form the
focus of future work.
7 Conclusions
A chemometric dimension reduction methodology, compris-
ing PCA, HCA and PLS-DA has been successfully applied
for the first time to complex gas- and particle-phase compo-
sition spectra of a wide range of BVOC and mesocosm envi-
ronmental simulation chamber photooxidation experiments.
The results show that the oxidised gas-phase atmosphere (i.e.
the integrated reaction coordinate) of each different structural
type of BVOC can be classified into a distinct group accord-
ing to the controlling chemistry and the products formed. In-
deed, a potential major strength of the data analysis method-
ology described here, could lie in the decoding of mecha-
nisms into pathways (i.e. separation within a group on ac-
count of different underlying chemistry) and consequently
linking chemical pathways to precursor compounds. Further-
more, the methodology was similarly able to differentiate
between the types of SOA particles formed by each differ-
ent class of terpene, both in the detailed and broad chemical
composition spectra. In concert, these results show the dif-
ferent SOA formation chemistry, starting in the gas-phase,
proceeding to govern the differences between the various ter-
pene particle compositions.
The ability of the methodology employed here to effi-
ciently and effectively “data mine” large and complex data
sets becomes particularly pertinent when considering that
modern instrumentation/techniques produce large quantities
of high-resolution temporal and speciated data over poten-
tially long observation periods. Such statistical mapping
of organic reactivity offers the ability to simplify complex
chemical data sets and provide rapid and meaningful insight
into detailed reaction systems comprising hundreds of reac-
tive species. Moreover, the demonstrated methodology has
the potential to assist in the evaluation of (chamber and real-
world) modelling results, providing easy to use, comprehen-
sive observational metrics with which to test and evaluate
model mechanisms and outputs, and thus help advance our
understanding of complex organic oxidation chemistry and
SOA formation.
The Supplement related to this article is available online
at doi:10.5194/acp-15-8077-2015-supplement.
Acknowledgements. The authors gratefully acknowledge the UK
Natural Environment Research Council (NERC) for funding the
APPRAISE ACES consortium (NE/E011217/1) and the TRAPOZ
project (NE/E016081/1); the EU-FP7 EUROCHAMP-2 programme
for funding the TOXIC project (E2-2009-06-24-0001); the EU AC-
CENT Access to Infrastructures program for funding work at the
PSI and the EU PEGASOS project (FP7-ENV-2010-265148) for
funding used to support this work. A. R. Rickard and M. R. Alfarra
were supported by the NERC National Centre for Atmospheric
Sciences (NCAS). The authors would like to thank the University of
Leicester Atmospheric Chemistry group for assistance throughout
all experiments, including Alex Parker, Chris Whyte, Iain White
and Timo Carr; co-workers at the University of Manchester for
assistance with MAC experiments; co-workers from Fundacion
CEAM, Marie Camredon and Salim Alam for assistance with
EUPHORE experiments and co-workers from the Laboratory of
Atmospheric Chemistry smog chamber facility at the Paul Scherrer
Institute (PSI) for assistance with PSISC experiments. The authors
are grateful to M. Wiseman from the University of Brighton, for
useful discussions regarding various statistical techniques.
Edited by: V. F. McNeill
www.atmos-chem-phys.net/15/8077/2015/ Atmos. Chem. Phys., 15, 8077–8100, 2015