
Recommended
Recommended
More Related Content
What's hot
What's hot (20)
Viewers also liked
Similar to Long term forest soil acidification
Similar to Long term forest soil acidification (20)
Recently uploaded
Recently uploaded (20)
Long term forest soil acidification
- 1. Ecological Modelling 244 (2012) 28–37 Contents lists available at SciVerse ScienceDirect Ecological Modelling journal homepage: www.elsevier.com/locate/ecolmodel Long-term forest soil acidification, nutrient leaching and vegetation development: Linking modelling and surveys of a primeval spruce forest in the Ukrainian Transcarpathian Mts. J. Hruˇskaa,∗ , F. Oulehlea,b , P. ˇSamonilc , J. ˇSebestad , K. Tahovskáe , R. Hlebd , J. Houˇskad , J. ˇSikla a Czech Geological Survey, Klárov 3, 118 21 Prague 1, Czech Republic b Centre for Ecology and Hydrology, Deiniol Road, Bangor LL57 2UW, United Kingdom c Department of Forest Ecology, The Silva Tarouca Research Institute for Landscape and Ornamental Gardening, Lidická 25/27, 657 20 Brno, Czech Republic d Faculty of Forestry and Wood Technology, Mendel University in Brno, Zemˇedˇelská 1, 613 00 Brno, Czech Republic e Department of Ecosystem Biology, Faculty of Science, University of South Bohemia, Braniˇsovská 31, 370 05 ˇCeské Budˇejovice, Czech Republic a r t i c l e i n f o Article history: Received 6 March 2012 Received in revised form 19 June 2012 Accepted 22 June 2012 Available online 28 July 2012 Keywords: Soil acidification MAGIC model Nitrogen leaching Acid deposition Transcarpathian Mts. Norway spruce Vegetation changes a b s t r a c t The biogeochemical model MAGIC was applied to simulate long-term (1880–2050) soil and stratified soil solution (30 and 90 cm depth) chemistry at a spruce dominated site in the western Ukraine (Pop Ivan, 1480 m a.s.l.) to evaluate the effects of acid deposition on soil acidification in a less polluted region of Europe. Since 2008, sulphur (S) deposition of 9 kg ha−1 year−1 and nitrogen (N) deposition of 8.5 kg ha−1 year−1 have been measured at Pop Ivan. The recent deposition of S and N is about 30% and 50% of those values estimated for the early 1980s, respectively. Acidic deposition caused the depletion of base cations (Ca, Mg, Na, K) from the soil cation exchange complex, which resulted in a decrease of calcium and magnesium saturation between 1935 and 2008 in the top mineral soil (0–30 cm) and deeper mineral soil (30–80 cm) by 67% and 88%, respectively. Base cation leaching acted as the major buffer mechanism against incoming acidity, therefore the measured inorganic aluminium (Al) concentration in soil solutions is ca. 10 mol L−1 and the subsequent molar (Ca + Mg + K)/Al ratio above 1. Recovery of the soil solution pH and Al is expected within the next 40 years, whereas the soil base saturation will only increase slowly, from 6% to 9.8% in the top soil and from 5.5% to 11% in the deeper mineral soil. Since the 1960s, modelled inorganic N leaching (as NO3) has started to increase following the trend in N deposition. Modelling and experimental evidence suggest that N availability from mineralization and deposition exceeds the rate of microbial and plant immobilization. Thus, soil N accumulation since the 1960s has been limited. A significant increase in nitrophilous species as well as a decrease of herb layer diversity was observed between 1936 and 1997. © 2012 Elsevier B.V. All rights reserved. 1. Introduction Emissions of potentially acidifying compounds have accelerated due to anthropogenic activities since the mid 19th century. Conse- quently, the transport and deposition of sulphur (S) and nitrogen (N) have resulted in the widespread acidification of many terrestrial and aquatic ecosystems (Reuss and Johnson, 1985). International agreements to reduce emissions of sulphur and nitrogen com- pounds (Bull et al., 2001) have resulted in an 80% reduction in SOx, 30% reduction in NH3 and 39% reduction in NOx emissions from EU countries since 1985. As the deposition of S has fallen dramatically across Europe, many surface waters have begun to recover from acidification, as manifested by trends of sulphate (SO4), increased ∗ Corresponding author. Tel.: +420 251085433. E-mail address: jakub.hruska@geology.cz (J. Hruˇska). pH and increased acid neutralising capacity (ANC) (Evans et al., 2001; Jenkins et al., 2003; Wright et al., 2005). Despite the fact that base cation leaching from soils has decreased, recovery of soils is a much slower process, limited by low weathering rates, declines in base cation deposition (Hedin et al., 1994) and by net biomass uptake at some sites (Hruˇska et al., 2002). As S deposition has decreased, N deposition has become increasingly important because of its contribution to soil acidification and eutrophication. It has been shown by studies examining the effects of atmo- spheric deposition on vegetation; acidification and eutrophication are among the most important factors responsible for diversity losses in the long term (Thimonier et al., 1994; Bobbink et al., 2010; Dupre et al., 2010; Maskell et al., 2010; van den Berg et al., 2011). Over the past few decades, significant changes in the species diver- sity and equitability of plant communities, increases of nitrophilous and acidophilous species and herb generalists in forests have revealed a common causative connection across various 0304-3800/$ – see front matter © 2012 Elsevier B.V. All rights reserved. http://dx.doi.org/10.1016/j.ecolmodel.2012.06.025
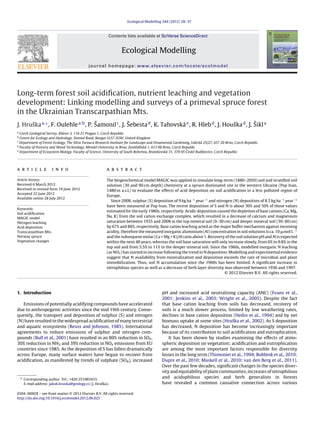
- 2. J. Hruˇska et al. / Ecological Modelling 244 (2012) 28–37 29 Fig. 1. Location of research sites Pop Ivan (Ukraine) and Naˇcetín (Czech Republic). ecosystems (Nygaard and Odegaard, 1999; Hedl, 2004; ˇSamonil and Vrˇska, 2007, 2008; Durak, 2010; ˇSebesta et al., 2011). In Eastern Europe, homogenization of the Carpathian beech forests together with the acidification of topsoil was observed in Poland by Durak (2010). A similar extent of soil acidification and vegetation changes were described in beech- and spruce-dominated forests further east in the Ukraine (ˇSebesta et al., 2011), an area which includes the site described in this study. Therefore, deposition of acid pollutants should be considered as a potential threat to the soil and consequent vegetation development in those ecosystems. It should also be pointed out that at the same time scale, concurrent changes in forest management, game pressure, cattle grazing and climate change have also been documented, all of which are likely to alter soils and vegetation composition. Repeated historical soil surveys, originally established in the 1930s in primeval fir-beech-spruce forests in the Ukraine Carpathian Mts. (ˇSebesta et al., 2011; Kuˇcera et al., submitted for publication), and recent intensive measurements of soil solution chemistry and deposition in the spruce dominated site of Pop Ivan (Oulehle et al., 2010), allowed us to reconstruct and predict the soil and soil solution chemistry using the biogeochemical model MAGIC. The specific objectives of this study are: (1) model the extent of soil acidification over the last 130 years, (2) predict the future soil chemistry based on expected trends in S and N deposition until 2050, and (3) discuss the possible effects of soil acidification and N cycle alterations on observed changes in the vegetation composition. 2. Materials and methods 2.1. Site description The Pop Ivan site is a primeval coniferous forest situated near the border between Ukraine and Romania at 1480 m a.s.l. (24◦31 E; 47◦57 N) (Fig. 1). Study site corresponds to research plot 11b (1.50 ha) established by Zlatnik in the 1930s (Zlatník et al., 1938). The forest cover is dominated by Norway spruce (Picea abies (L.) Karsten). Soils were classified as Haplic Cambisols (Dystric) or Entic Podzols; Albic Podzols also rarely occur in the vicinity of study site at the highest elevations (classified according to Michéli et al., 2006). The bedrock consists of acid sensitive crystalline schist and gneiss on study site as well as in surroundings. The Pop Ivan site is situated on a steep slope oriented to the west; with a mean annual temperature of 2 ◦C and annual precipitation of 1.9 m. Because direct human impacts have been minimal in this area, Pop Ivan is probably among the most natural forests of such extent in Eastern Central Europe (Elbakidze and Angelstam, 2007). 2.2. Sampling and chemical analyses of precipitation, soil and soil water Precipitation (5 collectors for throughfall and 2 collectors for bulk precipitation) was collected monthly by polyethylene funnels (surface area of 122 cm2). During the winter season (October–April) high volume samplers (surface area of 990 cm2) for bulk and throughfall (surface area of 179 cm2) were used. The contents of the throughfall samplers were combined to create one sample for chemical analysis; bulk precipitation collectors were analyzed sep- arately. Soil water has been collected since September 2007 using suc- tion lysimeters at depths of 30 and 90 cm in the mineral soil (3 lysimeters in each depth). Zero-tension lysimeters were installed under the forest floor (3 replications). Thickness of the forest floor was 8.7 ± 2.5 cm. All lysimeter samples were collected monthly and combined to create one sample from each depth for each month. Ca, Mg, Na, K, Si and Al in soil water were determined by flame atomic absorption spectrometry (FAAS). pH was measured using a pH meter with a combination electrode (Radiometer model
- 3. 30 J. Hruˇska et al. / Ecological Modelling 244 (2012) 28–37 Fig. 2. Estimated trends of (a) sulphur, (b) nitrogen compounds and (c) sum of the base cations (SBC) at Pop Ivan for the period 1880–2050. GK-2401C). Cl, SO4 and NO3 were measured by exchange ion chro- matography. Samples processing and analysis were made in an Accredited Testing Laboratory according to criteria of the ISO/IEC 17025:2005. Soils were sampled by excavating four 0.5 m2 quantitative pits using the method described by Huntington et al. (1988). The Ol plus Of (litter plus fermented) horizons were sampled together as a sin- gle sample, and then the Oh (humification) horizon (e.g. Zanella et al., 2009) was sampled separately. Mineral soil was collected for the depths of: 0–10, 10–20, 20–40 and 40–80 cm. The soil samples were weighed, and then sieved after air-drying (mesh size of 5 mm for organic horizons and 2 mm for mineral horizons). Soil moisture was determined gravimetrically by drying at 105 ◦C. Exchange- able cations were analyzed in 0.1 M BaCl2 extracts by FAAS. Cation exchange capacity (CEC) was calculated as the sum of exchange- able Ca, Mg, Na, K and TEA. Base saturation (BS) was determined as the fraction of CEC associated with base cations. Total carbon (C) and total nitrogen were determined using a Carlo-Erba Fisons 1108 analyser. 2.3. Historical soil analysis To evaluate the historical analytical methods used to deter- mine the soil chemistry, the original methods of Gedroiz (1926) were used. Soils samples were extracted in 1 M NH4Cl at the soil pH (exchange of soil cations with NH4 +). From the eluate, cal- cium was determined as calcium oxalate (CaC2O4) by titration with 0.1 N KMnO4, Mg concentration was determined by weighing as the Mg(C9H6ON)2·2H2O precipitate; K concentration by weighing as potassium chloride (KClO4); and Na concentration by weigh- ing as sodium chloride (NaCl). For more details see Kuˇcera et al. (submitted for publication). 2.4. Water fluxes of the soil solution To assess the water and element fluxes through the soil profiles we used a measurement of the chloride (Cl) mass budget. Chlo- rine compounds tend to be highly soluble in water and mobile in soils, so atmospheric deposition and transport through terrestrial ecosystems is rapid if there is active hydrologic flow. In addition, small-watershed studies assume that weathering of Cl is negligible compared to atmospheric deposition (Juang and Johnson, 1967). Chlorine is a minor constituent of most rocks and has been assumed to be relatively unreactive in forest ecosystems (Schlesinger, 1997). Its content in metamorphic rock underlined our study site may be considered as minor based on litogeochemical database of the Czech Geological Survey. The main source of Cl in rivers is glob- ally sandstones and shales (Graedel and Keene, 1996). Estimated weathering of Cl from bedrock in Hubbard Brook experimental for- est (mica schist and quartzite) has been estimated only to 1–2% of average export in stream water (Lovett et al., 2005). On the other hand, internal cycling of Cl (vegetation uptake and release from soil organic matter) may have influence on Cl budget especially in areas where deposition of Cl is lower than ca. 6 kg ha−1 year−1 (Svensson et al., 2012). The changes in internal Cl cycling assume changes in biotic control over Cl for which we have no evidence. However, natural forest at Pop Ivan site may be considered as rela- tively sTab. with limited anthropogenic influence. Thus, Cl budget has been used to calculate water flux trough different horizon as follows: X = Clthf Clss where X is the water flux (mm) in the respective soil horizon, Clthf is the chlorine flux in throughfall (mg m−2) and Clss is the respec- tive soil solution Cl concentration. Solute fluxes were calculated by multiplying the annual average of each solute by the water flux. 2.5. Trends in deposition of sulphur, nitrogen and base cations Historical S and N depositions for Pop Ivan (Fig. 2a and b) were estimated using Czech emissions of SO2, NOx and NH3 for the period 1880–2006. Despite a lack of relevant emission inventories from Ukraine, the Czech emissions were tightly correlated with total emissions from Poland, Slovakia and Romania (Berge, 1997) in the period 1980–2006 (R2 = 0.98; p < 0.001 for SO2 and R2 = 0.93; p < 0.001 for NOx). For more details of calculation see Oulehle et al. (2010). For future S and N deposition up to the year 2050 we used the current models (Current Legislation scenarios – CLE) of the Co-operative Programme for Monitoring and Evaluation of the Long-range Transmission of Air Pollutants in Europe (EMEP, http://www.ceip.at/emission-data-webdab), which project lower emissions of S and N compounds in 2010 and 2020 than the values originally based on the Gothenburg Protocol (Schöpp et al., 2003). The trends in base cation deposition (Fig. 2c) were similar (but substantially less steep) to the trend in S deposition, with maxima in the 1980s, reflecting the maximum dust emissions associated with coal production and consumption (Hedin et al., 1994). Future deposition of base cations was held constant at 2008–2010 levels. 2.6. MAGIC model description and calibration MAGIC (Model of Acidification of Groundwater in Catchments) was designed to reconstruct past and predict future drainage water and soil chemistry (Cosby et al., 2001). The MAGIC model uses a lumped representation of soil properties (Table 1) because under- standing the catchment runoff chemistry or soil water chemistry does not require detailed knowledge of the spatial distribution of the parameters within a catchment or forest plot. Water fluxes, atmospheric deposition, net vegetation uptake, weathering, and a description of organic acids are required as external inputs to MAGIC. We used the new version, MAGIC 7ext developed on the basis of MAGIC 7 (Cosby et al., 2001; Oulehle et al., 2012), which includes a new formulation of N retention and loss in soils based directly on the microbial processes which determine the balance of N mineralization and immobilization. MAGIC 7ext was described and successfully tested on three Czech sites (Oulehle et al., 2012).
- 4. J. Hruˇska et al. / Ecological Modelling 244 (2012) 28–37 31 Table 1 Values of soil fixed parameters and resulting calibrated parameters for the calibration year. Units Value for soil +5–30 cm 30–80 cm Fixed parameters Discharge, annual m 0.41 0.43 Precipitation, annual m 1.18 1.18 Soil depth m 0.35 0.5 Bulk density (fraction < 2 mm) kg m−3 463 595 CEC mequiv kg−1 89.4 24.7 Al(OH)3 solubility constant log 10 8.45 8.65 SO4 adsorption half saturation mequiv m−3 100 100 SO4 maximum adsorption capacity mequiv kg−1 10 1 pCO2 atm 0.64 0.8 Temperature ◦ C 2.5 2.5 pK1 of organic acids −log 10 2.5 2.5 pK2 of organic acids −log 10 4.1 4.1 pK3 of organic acids −log 10 6.7 6.7 Dissolved organic acid mmol+ m−3 16.5 10 Optimised parameters Weathering Ca mequiv m−2 0 6 Weathering Mg mequiv m−2 40 5 Weathering Na mequiv m−2 13 7 Weathering K mequiv m−2 0 0 Weathering of (Ca + Mg + K + Na) mequiv m−2 53 18 Selectivity coeff. Al–Ca log −0.13 −0.26 Selectivity coeff. Al–Mg log 0.59 1.34 Selectivity coeff. Al–Na log −3.22 −2.78 Selectivity coeff. Al–K log −5.09 −4.89 Ca initial condition % of CEC 5.1 18.3 Mg initial condition % of CEC 9.0 13 Na initial condition % of CEC 1.7 2.5 K initial condition % of CEC 2.3 3 Initial base saturation (Ca + Mg + Na + K) % of CEC 18.1 36.8 Nitrogen parameters Initial C pool in soil mol m−2 837 Initial N pool in soil mol m−2 29 Initial C/N in soil mol mol−1 28.9 Plant uptake NH4 mmol m−2 year−1 150 Plant uptake NO3 mmol m−2 year−1 75 Nitrification % of inputs 60 Denitrification mmol m−2 year−1 7 Litter C flux mmol m−2 year−1 11,250 Litter C/N mol mol−1 50 C frac % 21 N frac % 60 Decomp frac % 3.9 The key parameters used in the MAGIC application at Pop Ivan are summarized in Table 1. Soil concentrations of exchangeable cations were weighted depending on the measured thickness of soil horizons and on the measured fine earth (<2 mm) bulk density. Partial pressure of CO2 in the soil water was assumed to be oversat- urated with respect to the atmospheric partial pressure of CO2 by almost a factor of three, a value that is within the observed range for soils (e.g. Cosby et al., 2001; Oulehle et al., 2007). We used a two soil layer version of MAGIC to model soil water solution at 30 cm and 90 cm separately. MAGIC was calibrated to the average soil water chemistry for the period 2008–2010 and the soil chemistry in 1935 and 2008. The calibration proceeded by sequential steps. The first steps involved calibration of the strong-acid anions; Cl and SO4 were calibrated by adjusting the deposition inputs such that for both ions the correct mass balance was obtained. Next, we calibrated the NO3 concentrations in water. The val- ues Cfrac and Nfrac, and the initial C and N content of the SOM pool were specified (Table 1). These values were jointly selected in an optimization procedure that minimized the differences between simulated and observed values of a number of criteria, given the input time-series of litter, runoff, and inorganic N deposition at each site. The values to be matched included the C content, the C/N ratio of the soil organic matter, and the concentrations of inorganic N, DON and DOC in soil water. The simulated values for the pools of C and N and the C/N ratio in the soil were forced to match the observed values for the years for which soil measure- ments were available. N dynamics were simulated only for the top soil (0–30 cm), assuming little N cycle alteration in the deep mineral soil. This optimization procedure resulted in a modelled sum of strong acid anions (SAA) in soil water equal to that observed. The next steps involved calibration of the base cations Ca, Mg, Na, and K. A trial and error process was used to adjust the weathering rates of Ca, Mg, Na, and K and initial soil exchange pools of these four cations until modelled concentrations of base cations in the soil water and modelled pools of base cations in the soil matched those observed for the calibration period. This step calculated the soil–soil solution selectivity coefficients for base cations and Al exchange (Table 1). At this point the modelled sum of base cations (SBC) equalled those observed for the calibration period, and thus the modelled acid neu- tralising capacity (ANC) also equalled the observed ANC (ANC was defined as SBC-SAA). The final step entailed calibration of the weak acids and bases such that the simulated concentrations of H+, Ali (inorganic alu- minium) and organic anions (A−) matched observations. This was achieved by adjusting the dissociation constants for organic acids, aluminium hydroxide, fluoride, and sulphate species, and organic
- 5. 32 J. Hruˇska et al. / Ecological Modelling 244 (2012) 28–37 Fig. 3. Measured (2008–2010, dots) and simulated (1880–2050, lines) changes in soil water chemistry at 30 cm (upper panel) and 90 cm (lower panel) at Pop Ivan. aluminium complexes. We used a triprotic model for organic acids with dissociation constants given by Hruˇska et al. (2003). 2.7. Vegetation dynamics Relevés were performed in the 1930s (Zlatník et al., 1938) and repeated in the period 1997–2006 on 141 square plots sized 10 m × 10 m in the massif of Maramuresh Pop-Ivan. Vege- tation changes after 59–68 years were evaluated by ˇSebesta et al. (2011). We focused on the herb layer of 22 repeatedly evaluated phytocoenological plots which were nearest the lysimeters and precipitation collectors. While a 6-member scale of abundance and dominance (Braun-Blanquet, 1934) and nomenclature of vascu- lar plants according to Polívka et al. (1928) were used during the original survey, repeated relevés were done using an 11-member abundance and dominance scale (Zlatník, 1953), and nomenclature was adapted according to Kubát (2002) and Dobrochayeva et al. (1999). The sets of data were converted to identical units before processing (see also ˇSebesta et al., 2011). Changes in the presence of plant species between the periods were evaluated by means of synoptic sTab., with calculations of frequency and fidelity for individual taxa applying the phi coef- ficient according to Chytr´y et al. (2002). Changes in the herb layer structure were evaluated with the use of an internal diversity index (Shannon–Wiener’s index) (Hill, 1974). In order to evaluate the herb layer response to environmental changes, we used phytoindi- cation with Ellenberg indicator values (EIV according to Ellenberg, 1996) in the software Juice 7.0 (Tich´y, 2002). Differences were tested by a paired T-test with the critical level of significance = 0.05. 3. Results and discussion 3.1. Soil water chemistry 3.1.1. Sulphate Mean annual sulphate concentrations (2008–2010) in soil water varied between 59 and 79 equiv L−1 at 30 cm and between 68 and 87 equiv L−1 at 90 cm, respectively (Fig. 3). Changes in sulphur deposition were the main factor driving factors in the soil biogeo- chemistry at Pop Ivan. The amount of historical sulphur deposition was estimated as proportional to the coal mining in Central Europe (Fig. 2 and Oulehle et al., 2010) for the period 1880–1990 and the historical background was estimated to be ca. 50 equiv L−1 for both depths. The highest concentrations for both depths were esti- mated to occur during the mid the 1980s (230 equiv L−1), when S deposition in the region peaked. Due to the low modelled soil sul- phur adsorption capacity (Table 1), soil water responded quickly to changes in atmospheric deposition. Thus, the decline of SO4 con- centrations proportionally followed the decrease of S deposition. If future S deposition follows CLE expectations (Fig. 2), predicted soil water SO4 concentrations will decrease to ca 50 equiv L−1 around 2020 and will remain sTab. until 2050. This value is similar to the SO4 concentration estimated for the historical background (Fig. 3). Despite this pronounced decline, SO4 will still be the dom- inant soil water anion in the future. The SO4 concentrations at Pop Ivan were markedly lower compared to the Norway spruce research plot Naˇcetín (under- lined by gneiss and dystric cambisol) in the Ore Mts., Czech Republic (Oulehle et al., 2006, 2007), where soil water SO4 concentration at the 30 cm depth varied between ca. 400 and 600 equiv L−1 between 2003–2006 and 500–600 equiv L−1 at 90 cm. At Naˇcetín, modelled soil water SO4 peaked in the mid 1980s (ca. 1200 equiv L−1) as a result of extremely high S deposition rates of 560 mequiv m−2 year−1 caused by high SOx emissions from coal-burning power plants. Compared to Naˇcetín, Pop Ivan received ca. 50% less S deposition. Due to the lower amount of draining soil water (370 mm at Naˇcetín) and lower soil adsorption capacity at Pop Ivan, observed and modelled SO4 concentrations at Pop Ivan were significantly lower compared to heavily acidified soils at the Czech Republic. 3.1.2. Nitrogen Mean annual NO3 concentrations in the soil solution at 30 cm and 90 cm were 32 and 36 equiv L−1, respectively between 2008 and 2010 (Fig. 3). The estimated low NO3 deposition prior to the 1950s (<3 kg ha−1 year−1 of N-NO3) together with effective Table 2 Long-term (1880–2050) cumulative N budget simulated by MAGIC for mentioned intervals. Percentage represented distribution of deposited nitrogen between fluxes and pools. 1880–1950 1950–2010 2010–2050 mmol m−2 % mmol m−2 % mmol m−2 % Deposition 3477 5585 2615 Soil accumulation 1862 54 1589 28 252 10 DIN leaching 0 0 2528 45 1390 53 DON leaching 1092 31 1005 18 684 26 Denitrification 497 14 420 8 280 11
- 6. J. Hruˇska et al. / Ecological Modelling 244 (2012) 28–37 33 Fig. 4. Measured (dot) and simulated (1880–2050, line) changes in soil C/N ratio of the layer 0–30 cm at Pop Ivan. immobilization of N in soil resulted in low leaching of nitrogen, mainly in the form of DON (dissolved organic nitrogen). As NO3 and NH4 deposition have increased since the late 1950s (Fig. 2) leach- ing of NO3 has dominated the losses of N from the system. Leaching of NO3 will be the major future pathway of N loss according to the model prediction (Table 2). Results of isotopic studies have revealed that NO3 in the stream/soil solution appears to be predominantly cycled through the microbial pool (Curtis et al., 2011); thus, control over the soil N retention rate could be attribuTab. to the efficiency of the microbial community to immobilize nitrogen. However, labelling experiments with different 15N forms undertaken at Pop Ivan have revealed that microbial community assimilates exclu- sively organic N (Tahovská et al., in preparation). The microbial preference of organic over inorganic N together with relatively high gross N mineralization processes (ammonification and nitrifica- tion) suggests that high N-NH4 and mainly N-NO3 content found in Pop Ivan soils can originate from the organic N pool, but not directly from inorganic N deposition (Tahovská et al., in preparation). The limited capacity of the studied ecosystem to retain nitrogen was successfully demonstrated by the model, which showed only lim- ited N soil accumulation since the 1950s when the major rise in deposition occurred (Fig. 2). Consequently, the modelled C/N ratio (mol mol−1) does not change very much over the last 50 years (decreasing from 26.7 to 25.5, Fig. 4). We assumed that the soil C pool has been sTab. over the whole modelled period and the DOC flux has been set up as a percentage of decomposition to fit the observed DOC in soil water. DON flux is than calculated according to the development of the soil C/N ratio. The initial C/N ratio in 1880 was estimated to be 28.9 and it will not change significantly in the future (Fig. 4). We assumed a “background” denitrification rate of 7 mmol m−2 year−1 as a plausible additional pathway of N loss from the ecosystem. 3.1.3. Base cations Mean annual averages of the sum of base cations (Ca + Mg + Na + K) were between 58–61 equiv L−1 (−30 cm) and 71–82 equiv L−1 (−80 cm) for the period 2008–2010 (Fig. 3). Both modelled base cations and SO4 increased over the histor- ical period 1880–1991 (Fig. 3). The base cations then declined and decreased further following the decline of SO4. During peak acidi- fication in the 1980s, concentrations of 152 equiv L−1 (30 cm) and 245 equiv L−1 (90 cm) were estimated, approximately twice the measured data from the 2000s. The low supply of base cations from the soil exchange-complex and weathering was a major contribu- tor to the acidification of soils at Pop Ivan. Measured concentrations are lower than the historical estimate, as a result of depletion of the soil cation-exchange complex and also declining base cation deposition (Fig. 2). A slight increase of SBC concentration is pre- dicted in the future for both depths as a result of declining strong anion concentrations. Thus SBCs for both depths will again reach their historical levels (Fig. 3). SBC concentrations were significantly lower compared to the heavily acidified Naˇcetín, where concentra- tions between 180 and 190 equiv L−1 were observed at 90 cm and around 130 equiv L−1 at 30 cm in the mid-2000s (Oulehle et al., 2006, 2007). Weathering rates (Table 1) were estimated within the MAGIC calibration procedure along with historic soil base saturation. As a result, high Mg weathering needed to be estimated for the upper soil to obtain measured concentrations in the soil water (Table 1, Fig. 3). One possible explanation is that there is intensive exchange of Mg within the internal flux of the tree canopy with subsequent cation-exchange between the soil matrix and soil water. Such rapid short-term litter decomposition/cation exchange is not part of the MAGIC model and thus must be estimated as weathering rate, even though it is not actual chemical weathering of the soil particles or parent material. The weathering rate of Mg for deeper mineral soil was estimated to be lower and thus more realistic for the crystalline schist and gneiss underlying Pop Ivan (18 mequiv m−2 annually). Langan et al. (2001) published 15 weathering rates estimated for granitic areas in northern Europe calculated in different ways (min- eral index, PROFILE model, Sr isotopes, depletion) ranging between 10 mequiv m−2 and 85 mequiv m−2 annually, and the high altitude Pop Ivan fits within this range. 3.1.4. pH, aluminium and Bc/Al ratio Chronic soil acidification caused a decline in pH and enhanced Al mobilization at both depths (Fig. 5). Measured pH was 4.49 (30 cm) and between 4.57 and 4.66 (90 cm) between 2008 and 2010. As a result of sulphur and nitrogen deposition and consequent base cation depletion, modelled pH declined to a minimum of 4.3 at 30 cm and 4.4 at 90 cm during the 1980s. These decreases were about 0.5 pH (30 cm) and 0.7 pH (90 cm) compared to the val- ues estimated for 1880. After a decade of declining deposition, the pH increased only slightly (Fig. 5). Future predictions show a slow increase to pH 4.6 at 30 cm and 4.8 at 90 cm. Soil water in both hori- zons will stay more acidic in comparison to historical estimates. Fig. 5. Measured (2008–2010, dots) and simulated (1880–2050, lines) changes in soil water chemistry at 30 cm (upper panel) and 90 cm (lower panel) at Pop Ivan.
- 7. 34 J. Hruˇska et al. / Ecological Modelling 244 (2012) 28–37 Fig. 6. Measured (dots) and simulated (1880–2050 full lines) changes in soil chemistry of the layer 0–30 cm (upper panel) and 30–90 cm (lower panel) at Pop Ivan. Similar trends were predicted for Naˇcetín in the Ore Mts., despite the fact that soil water at 90 cm was more acidified (minima of 4.25 in the 1980s) compared to the estimated pre-industrial pH of 4.7 (Oulehle et al., 2006, 2007). Dissolved inorganic Al was measured as between 6.6–10.3 mol L−1 (30 cm) and 7.8–8.3 mol L−1 (90 cm) between 2008 and 2010. Al concentrations in the MAGIC model are con- trolled by Al(OH)3 solubility. The Al(OH)3 solubility constant for mineral soil was optimized using soil water measurements between 2008 and 2010 to −pKAl(OH)3 = 8.45 (30 cm) and 8.65 (90 cm). These values were in good agreement with the results of Oulehle and Hruˇska (2005) at Naˇcetín, who found an equi- librium of Al3+ concentration in soil water between gibbsite (−pK = 8.04) and amorphous Al(OH)3 (−pK = 9.66). The highest modelled Al concentrations were observed during the 1980s (Fig. 5). The concentration of Al peaked with 50 mol L−1 (30 cm) and 40 mol L−1 (90 cm). Higher acidic deposition, lower pH and reduced ability of base cations to neutralize the acidity were the main factors affecting the mobilization of aluminium in the spruce stand. MAGIC predictions will lead to further decreases of Al at both depths as a result of increasing pH (Fig. 5). Nevertheless, Al concentrations at Pop Ivan are very low in comparison with more polluted areas in Central Europe. Al concentrations between 40 and 160 mol L−1 were found at Lysina (underlined by granite and spodosol) in the western Czech Republic (Hruˇska and Krám, 1994) for upper mineral soil, and 110 mol L−1 (Krám et al., 1995) for the mineral soil solution at 80 cm. Similarly, Oulehle et al. (2007) observed Al concentrations between 130 and 260 mol L−1 (90 cm) for Naˇcetín, and modelled maximum for the 1980s exceeded 400 mol L−1. The depletion of nutrient cations and enhanced concentration of potentially toxic Al in the soil solution may deteriorate forest health. The molar Bc/Al ratio ((Ca + Mg + K)/Al) has been widely used as criterion for the risk of tree damage (Sverdrup et al., 1992; Cronan and Grigal, 1995; Hruˇska et al., 2001). Based on experiments with seedlings Sverdrup et al. (1992) showed enhanced mortality if Bc/Al ratio was lower than 1. Field data from the Czech Republic (Hruˇska et al., 2001) suggested increasing tree damage with decreasing Bc/Al in soil solution of the rooting zone in Norway spruce stands. On the other hand limitation of this concept was show by De Witt et al. (2010). Only reduction of Mg uptake was observed after long- term experimental addition of AlCl3 to the rooting zone of Norway spruce in southern Norway. One of the results of increasing inorganic aluminium in the soil solution observed at Pop Ivan was a decline in the Bc/Al ratio (Fig. 5). Present ratios of 2.4 (30 cm) and 3.1 (90 cm) are much lower than estimated historical values (12 and 31 respectively), but still above critical value of 1 that can have a harmful effect on tree roots. Future estimates show an increase of Bc/Al until 2050. The lowest values modelled for the 1980s (1.2 and 2.3 respectively) show relatively favourable soil solution conditions. Thus, soil acidification may not have created harmful conditions for tree roots. 3.2. Soil chemistry The soil profile at Pop Ivan reflects chemistry typical for acidified forest soils in Central Europe. A soil mass-weighted base satura- tion of 6% was calculated for topsoil (0–30 cm) and 5.5% for deeper mineral soil (30–80 cm), respectively in 2008 (Fig. 6). The modelled soil base saturation in the topsoil decreased from 18.1% in 1880 to the 6.0% measured in 2008, and from 36.8% to 5.5% in the deeper mineral soil. The loss of base cations from cation-exchange sites was an important mechanism for neutral- izing incoming acidity, and during the peak of acidic deposition (from the 1950s to the 1990s) this loss was the dominant source of base cations in the soil water (Fig. 3). We evaluated our estimates of soil base saturation in the past by examining historical data. During the 1930s, a soil and vegetation survey was organized in the Ukraine Carpathians by the Czechoslo- vak government, and Pop Ivan was one of the investigated sites (Zlatník et al., 1938). Soil exchangeable Ca and Mg were deter- mined in 1935 by the method of Gedroiz (1926 – for more details see Section 2). There was concern over how historical methods can be compared with modern ones (AAS after 0.1 M BaCl2 extraction). Thus both methods were applied to soil samples taken at Pop Ivan and Javornik (a beech forest further west) in 2008 (for more details see Kuˇcera et al., submitted for publication). A statistically signif- icant linear relationship (p < 0.001) between the methods for both Ca and Mg was observed (Fig. 7). Generally, modern methods slightly underestimated Ca and overestimated Mg in comparison with historical ones. Using the obtained equations (Fig. 7), historical exchangeable Ca and Mg were recalculated to modern equivalents and then used for MAGIC mod- elling. Soil saturation of Ca (0–30 cm) was measured as 7.6% in 1935 and decreased to 2.1% in 2008 (Fig. 5). Ca saturation in the deeper mineral soil (30–80 cm) has declined from 18.3% to 2.5%. Similarly, soil saturation of Mg declined from 5.1% to 2.0% (0–30 cm) and from 12.4% to 1.4% (30–80 cm) between 1935 and 2008. Relatively high past deposition of S together with acid sensitive bedrock and high water fluxes depletes base cations from soils, resulting in such low base saturation. The lowest base saturation (SBC or Ca2+ and Mg2+) was estimated for the mid-1980s when S deposition peaked (Fig. 2). The predicted soil base saturation will increase steadily until 2050, but this increase will be very slight and base saturation will still be lower than the 1880 estimate or values measured in 1935 (Fig. 6). Better recovery was predicted for upper soils (0–30 cm) compared to mineral soils. Similar results were obtained for the Lysina catchment in the western Czech Republic (Hruˇska and Krám, 2003), where estimated
- 8. J. Hruˇska et al. / Ecological Modelling 244 (2012) 28–37 35 Fig. 7. Comparison between historical (Gedroiz) and modern (AAS) methods for determination of exchangeable Ca (n = 32) and Mg (n = 33) based on samples taken from a spruce site at Pop Ivan and a beech site at Javornik. soil base saturation (estimated for a soil mass-weighted base pro- file 0–90 cm) decreased from 25% in the middle of the 19th century to 7% measured in 1994 and 5.6% in 2004 respectively. Future pre- diction shows no recovery until 2050, but base saturation will not decline. Navrátil et al. (2007) used the SAFE model to estimate changes in soil base saturation in different soil horizons at Lysina and concluded there would be significant recovery of organic soil, but a continuation of acidification (decline of base saturation) for the B horizon. A lower magnitude of soil base saturation decline was modelled for Naˇcetín (Oulehle et al., 2007) where it declined from 14.1% (1850) to 7.5% measured and modelled for 1994. Recov- ery to ca. 10% was modelled for 2050. Naˇcetín received significant dry deposition of base cations in the past (as dust from nearby coal mining open-pit areas), and higher weathering rates also resulted in a partial mitigation of incoming atmospheric acidity. A decrease of soil base saturation as a result of acidic deposition has also been modelled for forest soils elsewhere in Europe (e.g. Malek et al., 2005; Belyazid et al., 2006). 3.3. Interactions with vegetation development The number of herb species had decreased after 59 years (Table 3). A total of 47 herb-layer taxa were recorded in 1938, of which 16 were not found during the repeat survey. On the other hand, only 6 plant taxa were new findings in the herb layer in 1997 (Table 4). Local development – relevant to the investi- gated lysimetric plot – well corresponded to the general changes in spruce-dominated forests in whole Maramuresh Pop-Ivan massif as described by ˇSebesta et al. (2011). Simultaneously, the observed statistically significant decrease in the Shannon–Wiener diver- sity index was the result of not only the decreasing number of taxa but also the decreasing equitability of plant species cover. In particular, nitrophilous and poorly shade-tolerant generalists (e.g. Calamagrostis villosa, Rubus idaeus, Athyrium distentifolium) with the highest fidelity (Table 4) dominated the herb layer more often during the repeat survey in 1997. The higher frequency of nitrophilous taxa was also reflected in the significant increase of EIV value for nitrogen (Table 3). This supports the hypothesis that enhanced nitrogen load resulting in a higher availability of inor- ganic nitrogen forms (Fig. 3) can cause changes in the vegetation composition. On the other hand, we did not detect an increase of acidophilous plant species, or a decrease of EIV for soil reaction, despite the fact that we observed and modelled long-term soil acidification (Figs. 5 and 6). We also assume that soil acidification was more likely a result of acidic deposition caused by long distance trans- port of acidifying pollutants (especially S), rather than on-going changes caused by vegetation succession or changes within the “forest cycle” (Korpel’, 1995; Král et al., 2010). A significant spread of acidophilous plant taxa – probably as a result of anthropogenic acidification – has been described by ˇSamonil and Vrˇska (2007), Durak (2010) and ˇSebesta et al. (2011) for naturally base-richer beech-dominated forests in the Eastern and Western Carpathians. The originally poor and acid spruce-dominated plant community at Pop Ivan probably did not respond to the enhanced soil acidifi- cation through a decrease soil reaction EIV because there was not a source of more acidophilous taxa. The plant taxa present have been shown to be resistant to soil acidification (see Falkengren-Grerup, 1990), and therefore this plant community does not seem to have a significant potential to detect the man-made acidification process through phytoindication. Insignificant changes in the EIV for soil reaction can be also associated with the observed gradual move- ment of broadleaf woody species to higher elevations at Pop Ivan (ˇSebesta et al., 2011), or with changes to landscape management in the vicinity of upland pastures, including a cessation of grazing pressure that in turn leads to nutrient accumulation in the biomass, and changes in forest management, often manifested by canopy closure and an alteration of light availability (e.g. Vrˇska et al., 2009). Those factors also have profound impacts on vegetation dynamics and may overwhelm the effects induced by soil acidification and alteration of the N cycle through enhanced N deposition. Never- theless, the preferential uptake of organic N over inorganic N by Table 3 Differences in the herb layer vegetation between the years of measurement. EIV – Ellenberg indication values, SD – standard deviation, p-value – level of significance, T-value – test of statistics, 22 phytocoenological plots. Variable 1938 year 1997 year T-Value p-Value Mean SD Mean SD Number of species 15.27 5.57 13.18 2.86 1.854 0.0779 Shannon–Wiener index 2.12 0.31 1.87 0.24 4.085 0.0005 EIV-light 4.71 0.49 4.72 0.29 −0.115 0.9099 EIV-temperature 4.11 0.25 3.97 0.16 2.522 0.0198 EIV-moisture 5.49 0.18 5.50 0.17 0.616 0.5446 EIV-soil reaction 3.85 0.45 3.97 0.30 −1.279 0.2149 EIV-soil N 4.55 0.40 4.84 0.39 −4.869 <0.0001
- 9. 36 J. Hruˇska et al. / Ecological Modelling 244 (2012) 28–37 Table 4 Synoptic Tab. of herb species found, sorted by the year of data collection; species are ordered according to their frequency (%); calculation of Fisher’s exact test – species with significance p < 0.05 have zero fidelity (/). Fidelity is demonstrated as an exponent of frequency. Year of measurement 1997 1938 No. of relevés 22 22 Luzula sylvatica 100 95 Vaccinium myrtillus 100 86 Oxalis acetosella 100 82 Dryopteris dilatata 91 91 Polygonatum verticillatum 86 73 Calamagrostis arundinacea 9132.5 64 Homogyne alpina 77 77 Athyrium distentifolium 9156.7 36 Soldanella montana 55 68 Hieracium transsylvanicum 50 64 Calamagrostis villosa 41 45 Campanula patula ssp. abietina 23 6441.3 Senecio nemorensis agg. 41 45 Luzula luzuloides ssp. rubella 41 41 Rubus idaeus 6446.2 18 Luzula luzuloides 36 45 Solidago virgaurea ssp. minuta 9 6456.7 Anemone nemorosa 14 5039.0 Stellaria nemorum 18 41 Gentiana asclepiadea 18 36 Rumex arifolius 27 23 Hypericum species 5 4547.2 Phegopteris connectilis 14 36 Rubus hirtus 23 23 Festuca picta 9 18 Athyrium filix-femina 9 18 Blechnum spicant 9 14 Prenanthes purpurea 9 14 Lastrea limbosperma . 2335.8 Streptopus amplexifolius 18 . Euphorbia carniolica . 18 Gymnocarpium dryopteris 9 5 Doronicum austriacum 5 9 Laserpitium krapfii 9 . Adenostyles alliariae 9 . Epilobium angustifolium 5 5 Poa chaixii . 9 Hypericum maculatum . 9 Anthoxanthum odoratum . 9 Potentilla aurea . 9 Huperzia selago . 9 Phyteuma orbiculare . 9 Dryopteris filix-mas 5 . Dryopteris carthusiana 5 . Petasites albus 5 . Rumex alpinus . 5 Melampyrum sylvaticum . 5 Crocus heuffelianus . 5 Lycopodium annotinum . 5 Cicerbita alpina . 5 Festuca altissima . 5 Galeobdolon luteum . 5 Leucanthemum rotundifolium . 5 microbes may lead to an alteration in plant–microbe competition, leaving more inorganic N available for plant uptake and/or leaching. 4. Conclusions Soils at Pop Ivan have been significantly acidified despite the long distance from major sources of sulphur deposition in Central Europe. The observed chemistry of soil water and soil was success- fully reproduced by the MAGIC model. Moreover, this calibration was able to satisfactorily reproduce historical soil chemistry data from the 1930s. At Pop Ivan, the depletion of exchangeable base cations from the soil played a crucial role in the acidification pro- cess, which resulted in a decrease of soil base saturation. The higher soil water anion concentration and lower pH caused by enhanced acidic deposition resulted in mobilization of dissolved aluminium. According to the modelled Bc/Al ratio, aluminium stress was not crucial for spruce stands at Pop Ivan, contrary to conditions in the more polluted Central Europe. The model simulation indicates that the spruce ecosystem at Pop Ivan is susceptible to N leaching, whereby N availability from mineralization and deposition exceeds the rate of microbial immo- bilization. The timing of enhanced leaching of inorganic N falls into the timescale of increased N deposition during the 2nd half of the 20th century. Thus, higher plant availability of inorganic N might play an additional role in the on-going vegetation changes in Eastern Carpathian forests. Acknowledgements Fieldwork, equipment, chemical analyses and travelling were supported by Czech Science Foundation (Project No. 526/07/1187), salary for Jakub Hruˇska and Filip Oulehle were funded by the research plan of the Czech Geological Survey (MZP 0002579801), salary for Pavel ˇSamonil was funded by the research plan of The Silva Tarouca Research Institute for Landscape and Ornamental Gardening (Project No. MSM 6293359101). References Belyazid, S., Westling, O., Sverdrup, H., 2006. Modelling changes in forest soil chemistry at 16 Swedish coniferous forest sites following deposition reduction. Environmental Pollution 144, 596–599. Berge, E., 1997. Part 1: emission, dispersion and trends of acidifying and eutrophying agents EMEP/MSC-W Report 1/97. Norwegian Meteorological Institute, Oslo. Bobbink, R., Hicks, K., Galloway, J., Spranger, T., Alkemade, R., Ashmore, M., et al., 2010. Global assessment of nitrogen deposition effects on terrestrial plant diver- sity: a synthesis. Ecological Applications 20, 30–39. Braun-Blanquet, J., 1934. Stupnice abundance a dominance. In: Novák, V., Kavina, K., Klika, K., (Eds.), Pˇríruˇcka metodiky rostlinné sociologie a ekologie. Sborník v´yzkumn´ych ústav ˚u zemˇedˇelsk´ych, vol. 125. Praha, pp. 1–244. Bull, K.R., Achermann, B., Bashkin, V., Chrast, R., Fenech, G., Forsius, M., et al., 2001. Coordinated effects monitoring and modelling for developing and supporting international air pollution control agreements. Water, Air, and Soil Pollution 130, 119–120. Chytr´y, M., Tich´y, L., Holt, J., Botta-Dukát, Z., 2002. Determination of diagnostic species with statistical fidelity measures. Journal of Vegetation Science 13, 79–80. Cosby, B.J., Ferrier, R.C., Jenkins, A., Wright, R.F., 2001. Modelling the effects of acid deposition: refinements, adjustments and inclusion of nitrogen dynamics in the MAGIC model. Hydrology and Earth System Sciences 5, 499–508. Cronan, C.S., Grigal, D.F., 1995. Use of calcium/aluminum ratios as indicators of stress in forest ecosystems. Journal of Environment Quality 24, 209–216. Curtis, C.J., Evans, C.D., Goodale, C.L., Heaton, T.H.E., 2011. What have sTab. isotope studies revealed about the nature and mechanisms of N saturation and nitrate leaching from semi-natural catchments? Ecosystems 14, 1021–1027. De Witt, H.A., Eldhuset, T.D., Mulder, J., 2010. Dissolved Al reduces Mg uptake in Norway spruce forest: results from a long-term field manipulation experiment in Norway. Forest Ecology and Management 259, 2072–2082. Dobrochayeva, D.N., Kotov, M.I., Prokudin, J.H., 1999. Opredeliteˇl vysˇsich rastenij Ukrainy. Fitosociocentr, Kiev. Dupre, C., Stevens, C.J., Ranke, T., Bleeker, A., Peppler-Lisbach, C., Gowing, D.J.G., et al., 2010. Changes in species richness and composition in European acidic grasslands over the past 70 years: the contribution of cumulative atmospheric nitrogen deposition. Global Change Biology 16, 344–347. Durak, T., 2010. Long-term trends in vegetation changes of managed versus unman- aged Eastern Carpathian beech forests. Forest Ecology and Management 260, 1333–1334. Elbakidze, M., Angelstam, P., 2007. Implementing sustainable forest management in Ukraine’s Carpathian Mountains: the role of traditional village systems. Forest Ecology and Management 249, 28–38. Ellenberg, H., 1996. Vegetation Mitteleuropas mit den Alpen in okologischer, dynamischer und historischer Sicht. Verlag Eugen Ulmer, Stuttgart. Evans, C.D., Cullen, J.M., Alewell, C., Kopáˇcek, J., Marchetto, A., Moldan, F., et al., 2001. Recovery from acidification in European surface waters. Hydrology and Earth System Sciences 5, 283–287. Falkengren-Grerup, U., 1990. Distribution of field-layer species in Swedish decidu- ous forests in 1929–54 and 1979–88 as related to pH. Vegetation 86, 146–150. Gedroiz, K.K., 1926. Chemische Bodenanalyse. Verlag von Gebrüder Bornträger, Berlin. Graedel, T.E., Keene, W.C., 1996. The budget and cycle of Earth’s natural chlorine. Pure and Applied Chemistry 68, 1689–1697.
- 10. J. Hruˇska et al. / Ecological Modelling 244 (2012) 28–37 37 Hedin, L.O., Granat, L., Likens, G.E., Buishand, T.A., Galloway, J.N., Butler, T.J., et al., 1994. Steep declines in atmospheric base cations in regions of Europe and North- America. Nature 367, 351–354. Hedl, R., 2004. Vegetation of beech forests in the Rychlebske Mountains, Czech Republic, re-inspected after 60 years with assessment of environmental changes. Plant Ecology 170, 243–245. Hill, M.O., 1974. Diversity and evenness: a unifying notation and its consequences. Ecology 54, 427–432. Hruˇska, J., Krám, P., 1994. Aluminium chemistry of the root zone of forest soil affected by acid deposition at the Lysina catchment, Czech Republic. Ecological Engineer- ing 3, 5–6. Hruˇska, J., Cudlín, P., Krám, P., 2001. Relationship between Norway spruce status and soil water base cations/aluminum ratios in the Czech Republic. Water, Air, and Soil Pollution 130, 983–988. Hruˇska, J., Moldan, F., Krám, P., 2002. Recovery from acidification in Central Europe – observed and predicted changes of soil and streamwater chemistry in the Lysina catchment, Czech Republic. Environmental Pollution 120, 261–264. Hruˇska, J., Krám, P., 2003. Modelling long-term changes in stream water and soil chemistry in catchments with contrasting vulnerability to acidification (Lysina and Pluhuv Bor, Czech Republic). Hydrology and Earth System Sciences 7, 525–529. Hruˇska, J., Kohler, S., Laudon, H., Bishop, K., 2003. Is a universal model of organic acid- ity possible: comparison of the acid/base properties of dissolved organic carbon in the boreal and temperate zones. Environmental Science and Technology 37, 1726–1730. Huntington, T.G., Ryan, D.F., Hamburg, S.P., 1988. Estimating soil-nitrogen and carbon pools in northern hardwood forest ecosystem. Soil Science Society of America Journal 52, 1162–1167. Jenkins, A., Camarero, L., Cosby, B.J., Ferrier, R.C., Forsius, M., Helliwell, R.C., et al., 2003. A modelling assessment of acidification and recovery of European surface waters. Hydrology and Earth System Sciences 7, 447–455. Juang, F.H.T., Johnson, N.M., 1967. Cycling of chlorine through a forested watershed in New England. Journal of Geophysical Research 72, 5641–5647. Korpel’, S., 1995. Die Urwälder der Westkarpaten. Gustav Fischer Verlag, Stuttgart. Král, K., Vrˇska, T., Hort, L., Adam, D., ˇSamonil, P., 2010. Developmental phases in a temperate natural spruce-fir-beech forest: determination by a super- vised classification method. European Journal of Forest Research 129, 339–341. Krám, P., Hruˇska, J., Driscoll, C.T., Johnson, C.E., 1995. Biogeochemistry of aluminum in a forest catchment in the Czech Republic impacted by atmospheric inputs of strong acids. Water, Air, and Soil Pollution 85, 1831–1836. Kubát, K., 2002. Klíˇc k urˇcování rostlin ˇCeské republiky. Academia, Praha. Langan, S., Hodson, M., Bain, D., Hornung, M., Reynolds, B., Hall, J., 2001. The role of mineral weathering rate determination in generating uncertainties in the calculation of critical loads of acidity and their exceedance. Water, Air, and Soil Pollution: Focus 1, 229–232. Lovett, G.M., Likens, G.E., Buso, D.C., Driscoll, C.T., Bailey, S.W., 2005. The biogeo- chemistry of chlorine at Hubbard Brook, New Hampshire, USA. Biogeochemistry 72, 191–192. Malek, S., Martinson, L., Sverdrup, H., 2005. Modelling future soil chemistry at a highly polluted forest site at Istebna in Southern Poland using the SAFE model. Environmental Pollution 137, 568–573. Maskell, L.C., Smart, S.M., Bullock, J.M., Thompson, K., Stevens, C.J., 2010. Nitrogen deposition causes widespread loss of species richness in British habitats. Global Change Biology 16, 671–679. Michéli, E., Schad, P., Spaargaren, O., Dent, D., Nachtergale, F., 2006. World reference base for soil resources. World Soil Resources Reports 103. Food and Agricultural Organization of the United Nations, Rome. Navrátil, T., Kurz, D., Krám, P., Hofmeister, J., Hruˇska, J., 2007. Acidification and recovery of soil at a heavily impacted forest catchment (Lysina, Czech Republic) – SAFE modeling and field results. Ecological Modelling 205, 464–474. Nygaard, P.H., Odegaard, T., 1999. Sixty years of vegetation dynamics in a south boreal coniferous forest in southern Norway. Journal of Vegetation Science 10, 5–6. Oulehle, F., Hruˇska, J., 2005. Tree species (Picea abies and Fagus sylvatica) effects on soil water acidification and aluminium chemistry at sites subjected to long-term acidification in the Ore Mts., Czech Republic. Journal of Inorganic Biochemistry 99, 1822–1829. Oulehle, F., Hofmeister, J., Cudlín, P., Hruˇska, J., 2006. The effect of reduced atmo- spheric deposition on soil and soil solution chemistry at a site subjected to long-term acidification, Nacetin, Czech Republic. Science of the Total Environ- ment 370, 532–534. Oulehle, F., Hofmeister, J., Hruˇska, J., 2007. Modeling of the long-term effect of tree species (Norway spruce and European beech) on soil acidification in the Ore Mountains. Ecological Modelling 204, 359–361. Oulehle, F., Hleb, R., Houˇska, J., ˇSamonil, P., Hofmeister, J., Hruˇska, J., 2010. Anthro- pogenic acidification effects in primeval forests in the Transcarpathian Mts., western Ukraine. Science of the Total Environment 408, 856–864. Oulehle, F., Cosby, B.J., Wright, R.F., Hruˇska, J., Kopáˇcek, J., Krám, P., et al., 2012. Mod- elling soil nitrogen: The MAGIC model with nitrogen retention linked to carbon turnover using decomposer dynamics. Environmental Pollution 165, 158–166. Polívka, F., Domin, K., Podpˇera, J., 1928. Klíˇc k úplné kvˇetenˇe republiky ˇCeskoslovenské. Nakladatel R. Promberger, Olomouc. Reuss, J.O., Johnson, D.W., 1985. Effect of soil processes on the acidification of water by acid deposition. Journal of Environment Quality 14, 26–31. ˇSamonil, P., Vrˇska, T., 2007. Trends and cyclical changes in natural fir-beech forests at the north-western edge of the Carpathians. Folia Geobotanica 42, 337–341. ˇSamonil, P., Vrˇska, T., 2008. Long-term vegetation dynamics in the Sumava Mts. natural spruce-fir-beech forests. Plant Ecology 196, 197–204. Schöpp, W., Posch, M., Mylona, S., Johansson, M., 2003. Long-term development of acid deposition (1880–2030) in sensitive freshwater regions in Europe. Hydrol- ogy and Earth System Sciences 7, 436–446. ˇSebesta, J., ˇSamonil, P., Lacina, J., Oulehle, F., Houˇska, J., Buˇcek, A., 2011. Acidification of primeval forests in the Ukraine Carpathians: vegetation and soil changes over six decades. Forest Ecology and Management 262, 1265–1269. Schlesinger, W., 1997. Biogeochemistry. An Analysis of Global Change. Academic Press, San Diego. Svensson, T., Lovett, G.M., Likens, G.E., 2012. Is chloride a conservative ion in forest ecosystems. Biogeochemistry 107, 125–134. Sverdrup, H., Warfvinge, P., Rosén, K., 1992. A model for the impact of soil solution Ca:Al ratio, soil moisture and temperature on tree base cation uptake. Water, Soil, and Air Pollution 61, 365–373. Thimonier, A., Dupouey, J.L., Bost, F., Becker, M., 1994. Simultaneous eutrophication and acidification of a forest ecosystem in northeast France. New Phytologist 126, 533–539. Tich´y, L., 2002. JUICE, software for vegetation classification. Journal of Vegetation Science 13, 451–453. van den Berg, L.J.L., Vergeer, P., Rich, T.C.G., Smart, S.M., Guest, D., Ashmore, M.R., 2011. Direct and indirect effects of nitrogen deposition on species composition change in calcareous grasslands. Global Change Biology 17, 1871–1873. Vrˇska, T., Adam, D., Hort, L., Koláˇr, T., Janík, D., 2009. European beech (Fagus sylvatica L.) and silver fir (Abies alba Mill.) rotation in the Carpathians – a developmental cycle or a linear trend induced by men? Forest Ecology and Management 258, 347–356. Wright, R.F., Larssen, T., Camarero, L., Cosby, B.J., Ferrier, R.C., Helliwell, R.C., et al., 2005. Recovery of acidified European surface waters. Environmental Science and Technology 39, 64A–72A. Zanella, A., Jabiol, B., Ponge, J.-F., Sartori, G., De Waal, R., Van Delft, B., et al., 2009. Towards a European humus forms reference base. Studi Trentini di Scienze Naturali 85, 145–151. Zlatník, A., 1953. Fytocenologie lesa – 1. ˇcást. SPN, Praha. Zlatník, A., Korsuˇn, F., Koˇcetov, M., Kseneman, M., 1938. Prozkum pˇrirozen´ych les ˚u na Podkarpatské Rusi. Ministerstvo zemˇedˇelství republiky ˇCeskoslovenské, Praha.