September 1 - 0830 - Zouheir Massri
•Download as PPTX, PDF•
0 likes•6 views

11th International Drainage Symposium August 30-September 2, 2022 Des Moines, Iowa
![Biological Nitrogen
fixation
Nitrogen-fixing
bacteria in root
nodules and soil
Plant roots and
residues
And animal proteins
Decomposition
Nitrogen
from human activity
[fertilizers: CO (NH2)2]
Through the process of nitrification by soil microbes:
1). Nitrosomonas converts NH4
+ to NO2
-, (Ammonia-oxidizing microbes)
2). Nitrobacter converts NO2
- to NO3
-, (Nitrite-oxidizing microbes)
N- Mineralization
The biological process of converting organic N
to NH4
+ (Ammonification by ammonifying
bacteria)
N- Nitrification
Conversion of NH4
+ to NO3
-
SOM
by soil
Microbes
Ammonification
Immobilization
SOM
(microbes)
NH3
Volatility
N2O
NO
N2
Denitrification
Atmospheric
nitrogen
NH3
NH3
NH3
Nitrate (NO3
-) constitutes the primary form of nitrogen (N) loss in agricultural fields.
Eutrophication
Leaching
(20- 50%)](data:image/gif;base64,R0lGODlhAQABAIAAAAAAAP///yH5BAEAAAAALAAAAAABAAEAAAIBRAA7)
Recommended
Recommended
More Related Content
Similar to September 1 - 0830 - Zouheir Massri
Similar to September 1 - 0830 - Zouheir Massri (20)
More from Soil and Water Conservation Society
More from Soil and Water Conservation Society (20)
Recently uploaded
Recently uploaded (20)
September 1 - 0830 - Zouheir Massri
- 1. Reduction of nitrate leaching and threats to surface water under conservation tillage in an edge of field monitoring at the micro-catchment scale Z. Massri (1), J. Asher (2), and J. R. Piwarski (3) Michigan State University (1) Zouheir Massri, Ph.D., Department of Biosystems and Agricultural Engineering, Michigan State University (MSU), 524 S Shaw Ln, East Lansing, MI 48824, USA. Corresponding author. zmassri@msu.edu. (2) Jeremiah Asher, Institute of Water Research, Michigan State University, East Lansing, MI 48824, USA. 3) Jason R. Piwarski, USDA-ARS Soil Drainage Research Unit, 590 Woody Hayes Drive, Columbus, OH 43210
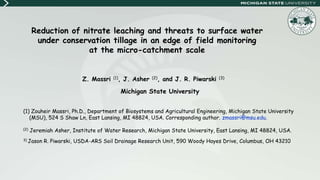
- 2. Biological Nitrogen fixation Nitrogen-fixing bacteria in root nodules and soil Plant roots and residues And animal proteins Decomposition Nitrogen from human activity [fertilizers: CO (NH2)2] Through the process of nitrification by soil microbes: 1). Nitrosomonas converts NH4 + to NO2 -, (Ammonia-oxidizing microbes) 2). Nitrobacter converts NO2 - to NO3 -, (Nitrite-oxidizing microbes) N- Mineralization The biological process of converting organic N to NH4 + (Ammonification by ammonifying bacteria) N- Nitrification Conversion of NH4 + to NO3 - SOM by soil Microbes Ammonification Immobilization SOM (microbes) NH3 Volatility N2O NO N2 Denitrification Atmospheric nitrogen NH3 NH3 NH3 Nitrate (NO3 -) constitutes the primary form of nitrogen (N) loss in agricultural fields. Eutrophication Leaching (20- 50%)
- 3. Problem statement: Nitrate leaching is a pathway of N loss and of high concern to water quality. The problem is exacerbated in Ag. fields with tile-drainage (sub-surface) systems and creates a negative impact on the freshwater ecosystem. Process: Nitrate leaching occurs when there is an accumulation of NO3 - in the soil profile that coincides with or is subject to periods of high drainage. Causes: 1. Soil particles do not retain nitrate (NO3 -) very well because both are negatively charged. 2. Subsurfce drainage designed to improve the soil system, removes excess sub-surface water from agricultural fields. As a result, nitrate (NO3 -) easily leaches with water in the soil. 3. Soils’ Cation Exchange Capacity (CEC): Low soil CEC has less ability to hold and exchange with ammonium cation (NH4 +). 4. Soils texture: Leaching is a big concern in coarsely-texture soils with higher rates of infiltration. 5. Seasonal extreme-precipitation: When precipitation exceeds the annual precipitation average (April-June), a period complies with slow plant uptake of nitrogen. Nitrogen is converted from ammonium (NH4 +) and nitrified to nitrate form (NO3 -) and can be subject to high loss and leaching. Impact: Sub-surface drainage can increase the nitrate (NO3 -) load of surface water bodies and degrade water quality and contribute to hypertrophic or eutrophic conditions due to nitrate (NO3 -) mobility, water solubility, and persistence, particularly in the presence of oxygen.
- 4. The Innovative Research Approach was based on: Improving the soil health functions, through soil management systems that are essential to protect and enhance groundwater and surface water quality, especially the reduction of nitrate (NO3-) loss. Coupling of an edge of field tile-drainage monitoring at the micro-catchment scale with healthy soil functions to learn, characterize and assess the nitrogen fate. Research Concept: Introduction of No-Till (NT) in 2013 as an alternative land management practice to Conventional Tillage (CT) to mitigate N loss and improve soil N retention and water quality benefits. Research inputs and assessment : Investigate the impact of NT versus CT : 1. Improving soil health functions: increasing soil carbon and nitrogen retention, and other soil physical and chemical properties. 2. Reducing nitrate (NO3 -) loss and load to surface water. 3. Assessment of the nitrate (NO3 -) exchange and retention using a resin-membrane technique. 4. Extraction of soil solution using micro-lysimeters.
- 5. Treatments of Conventional Till (CT) and the Conservation No-Till (4 acre each) spread over dominant Sebewa (Sb) soil series classified under Mollisols soil order. Soil map of Michigan Numbers 1-6 are showing the grid soil sampling points in the CT and NT treatments Layout of the research site in St. Johns, MI. Mollisols soil order 2013 ISCO ISCO
- 6. Research tools: Automated water sampling and analysis of nitrate: An (ISCO 6712) automated water sampler was mounted at each edge of treatment for water sampling and collecting 800 ml of water per day in a bottle from the drainage structure. Nutrient quantities such as nitrate (NO3-N ppm N as) and dissolved reactive phosphorus (DRP) in forms of HPO4 2− and/ or H2PO4 − (orthophosphate) were analyzed in the lab using Spectrophotometry (colorimetry) Gallery Analyzer UV- VIS (https://www.thermofisher.com/). HYDROS-21 water-level sensor and V-notch weir, which measure the flow rate of the drainage water and generate a value used to find the total daily load, thus calculating and reporting the quantities of monthly cumulative N load. The Edge-of-Field sampling structure including the ISCO 6712 automated sampler. Experimental approach for water sampling and collecting 800 ml of water per day in a bottle with ISCO ProPak bag from the drainage structure.
- 7. We have used positively charged ions (cations) exchange resins to capture negatively charged ions (anions) such as nitrate (NO3-N ppm N as) and orthophosphate (HPO4 2−) as a measure for assessing soil nitrogen and phosphate availability (Masri et al., 2022). Research tools:
- 8. Research tools: 10 RHIZON SMS 10 cm Micro-lysimeters (Eijkelkamp: https://www.eijkelkamp.com, Wageningen, the Netherlands) were used to extract the soil solution that are utilized most easily by plant and soil organisms. In lab, we measure the soluble ionic forms of nitrate (NO3-) as nitrate (NO3-N ppm N as), P (HP04 2-) as reactive phosphorous, K+, ammonium (NH4 +), and solution EC and pH. The micro-lysimeters are made of microporous hydrophilic Teflon of hole- sizes 0.12-0.18 μM, which enables a bar (or 15 PSI) improved suction of the soil solution when using a 30 ml plastic syringe (Masri et al., 2019).
- 9. Assessment of soil health function: Six soil samples were taken in each CT and NT treatment at 0- 15 cm for complete soil health assessment and were analyzed at AgSource lab (https://vas.com/soil-testing/). AgSource uses methods of soil health assays, based on those developed by Haney et al., (2018), the Soil Health Tool Explanation 4.7, and Soil Health Tool Master File of Rick Haney, as follows: CO2 Respiration (CO2-R): Re-hydrated (not saturated) dried and the ground sample incubated for 24 hours, and the CO2 evolved is read with a gas analyzer (CO2 analyzer “LiCor 840A IRGA”) as referenced in the Soil Health Tool 4.7. Soil Health Score (SHS): SHS= (CO2 Resp./C: N) + ((water extractable organic carbon (WEOC)/100) + ((water extractable organic nitrogen (WEON/10)). C: N Ratio: WEOC/WEON, Mineralizable Nitrogen and Mineralizable Phosphorus analysis are based on stoichiometric relationships between carbon mineralization and N and P release. Both are calculated from the CO2 respiration rate, WEOC, and WEON. Haney H3A Extraction (Orthophosphate-P, Phosphorus, Potassium, Calcium, Iron, and Aluminum).
- 10. 0 20 40 60 80 100 0.0 0.5 1.0 1.5 2.0 1-Oct 1-Nov 1-Dec 1-Jan 1-Feb 1-Mar 1-Apr 1-May 1-Jun 1-Jul 1-Aug 1-Sep Precipitation (mm) Nitrate load (Kg/ha) NO3-N Load 2020 WY (Soybean) NT The figure shows most of the nitrate (NO3 -) load with soybean in the NT treatment reported during October through February with a little load during April-May 2020. kg/ha Results and discussion 9.6 (Kg/ha)
- 11. 0 20 40 60 80 100 0.0 0.5 1.0 1.5 2.0 1-Oct 1-Nov 1-Dec 1-Jan 1-Feb 1-Mar 1-Apr 1-May 1-Jun 1-Jul 1-Aug 1-Sep Precipitation (mm) Nitrate load (kg/ha) NO3-N Load 2020 WY (Soybean) CT While in the nitrate (NO3 -) load with soybean in the CT treatment reported during October through July 2020. kg/ha Results and discussion 18.3 (Kg/ha)
- 12. 0 20 40 60 80 100 0.0 0.5 1.0 1.5 2.0 1-Oct 1-Nov 1-Dec 1-Jan 1-Feb 1-Mar 1-Apr 1-May 1-Jun 1-Jul 1-Aug 1-Sep Precipitation (mm) Nitrate load (Kg/ha) NO3-N Load 2021 WY (Corn) NT Mostly, these quantities of nitrate (NO3 -) load in 2021 WY reported of the same values in the CT and NT treatments (5.4 vs 5.8 kg/ha) kg/ha Results and discussion NT 5.8 (Kg/ha)
- 13. 0 20 40 60 80 100 0.0 0.5 1.0 1.5 2.0 1-Oct 1-Nov 1-Dec 1-Jan 1-Feb 1-Mar 1-Apr 1-May 1-Jun 1-Jul 1-Aug 1-Sep Precipitation (mm) Nitrate load (Kg/ha) NO3-N Load 2021 WY (Corn) CT Mostly, these quantities of nitrate (NO3 -) load in 2021 WY reported of the same values in the CT and NT treatments (5.4 vs 5.8 kg/ha) kg/ha Results and discussion 5.4 (Kg/ha)
- 14. Monthly cumulative drainage (mm), N load (kg/ha), and the precipitation (mm) in the corn (2020) and soybean cropping system for both conventional till (CT) and conservation No-till (NT) treatments. Monthly Cumulative Drainage (mm) Monthly Cumulative N Load (kg/ha) Cumulative Precipitation (mm) Soybean Corn Soybean Corn Soybean Corn 2020 2021 2020 2021 2020 2021 CT NT CT NT CT NT CT NT CT and NT CT and NT 596 403 40 30 18.3 9.6 5.4 5.8 843 663 The corn crop demands for nitrogen and water removal and uptake are high (2021 WY). Soybean demands are lower for nitrogen and water (2020 WY) associated with a shorter growth period. Corn receives higher nitrogen application (130 kg/ ha). Soybean receives less than (2 kg/ha) of nitrogen. Because soybean is a legume crop and fixes nitrogen in root nodules and carries- over part of the N applied to the corn previous crop. Nitrogen is soluble in soil water and leachable. Higher SHS, CO2-R, and SOM in the NT vs CT, indicating that a considerable part of the ammonium and nitrate were comprehensively cycled by the soil micro-organisms which lead to immobilization, and reduced leaching. Therefore, the monthly cumulative load of N for soybean in (2020 WY) was lower in NT vs CT (9.6 vs 18.3 kg/ha).
- 15. Resin exchange technology, revealed higher values of N mineralization/nitrification rates and Nitrate availability in the NT vs CT treatment and their N spatial long-term variability. June 02- 16, 22 14 days June 02- July 07, 22 35 days 6.5 18. 2 0 10 20 CT NT 17.5 57.0 0 20 40 60 CT NT 0 2 4 6 Precipitation (mm) June 02 June 09 June 16 June 23 June 30 July 07 ppm ppm
- 16. Values of Nitrate (NO3-N) and DRP (orthophosphate (HPO4 2−)) in the extracted soil solution in the NT treatment at a depth of 45 cm. NO3 - (NT) DRP (NT) Nitrogen (NO3-N) and DRP (HP04 2-) rates that are utilized most easily by plant and soil microbiomes. No extraction in the CT treatment (Michigan drought impact). 0.0 10.0 20.0 30.0 40.0 50.0 0.000 0.010 0.020 0.030 0.040 0.050 Nitrogen (NO3-N) (ppm) HPO 4 2- (ppm) July 25 July 28 Aug. 04 Aug. 09 Aug. 11 Aug. 18 Aug. 22 ppm ppm Days of measurements, 2022
- 17. 14.0 16.0 18.0 20.0 CT NT 16.7 19.1 Treatments SHS 0.0 20.0 40.0 60.0 80.0 CT NT 51.7 62.4 Treatments Soil CO2 Respiration 0.0 20.0 40.0 60.0 80.0 CT NT 59.9 72.1 (kg/ ha Treatments Mineralizable N 0.0 20.0 40.0 60.0 80.0 CT NT 51.7 62.4 (g H 2 O/ g dry soil) Treatments WHC Values of CO2 Respiration (CO2-R) and Soil Health Score (SHS) measured for the CT and NT treatments:
- 18. Treatments Soil samples Soil texture Soil texture class Soil organic matter (OM) Water holding capacity (WHC ) Aggregates stability Clay Silt Sand Wet sieving (%) % % (g H2O/ g dry soil) > 0.5 mm > 0.2 mm Conventional Till (CT) Sample 1 28.4 37.6 34.0 Clay-loam 4.6 0.32 13.89 35.61 Sample 2 22.4 31.6 46.0 Loam 4.4 0.30 14.72 34.98 Sample 3 30.4 33.6 36.0 Clay-loam 4.8 0.30 14.77 35.45 Sample 4 28.4 39.6 32.0 Clay-loam 6.1 0.33 18.28 39.54 Sample 5 24.4 33.6 42.0 Loam 3.6 0.29 12.12 34.61 Sample 6 20.4 25.6 54.0 Sandy-Clay-loam 4.9 0.28 12.46 34.61 Average 25.7 33.6 40.7 4.73 0.31 14.38 35.75 No-Till (NT) Sample 1 20.4 33.6 46.0 Loam 4.1 0.31 15.37 41.69 Sample 2 22.4 27.6 50.0 Sandy-Clay-loam 4.9 0.32 15.66 44.01 Sample 3 22.4 25.6 52.0 Sandy-Clay-loam 7.9 0.31 20.54 46.47 Sample 4 26.4 25.6 48.0 Sandy-Clay-loam 4.8 0.38 14.41 40.80 Sample 5 24.4 25.6 50.0 Sandy-Clay-loam 10.2 0.34 22.08 45.87 Sample 6 32.4 27.6 40.0 Clay- Loam 10.3 0.36 22.37 44.75 Average 24.7 27.6 47.7 7.0 0.35 18.40 43.93 Detailed measurements of soil texture analysis, soil organic matter, soil water holding capacity, and wet aggregate stability are listed for the CT and NT treatments.
- 19. Treatments Soil samples Soil Health Score Soil CO2 Respiration C: N Mineral soil nitrate- N Water soluble Total Nitrogen NO3-N Mineralizable N SHS ppm Ratio - - - - - - - - - - - - - - ppm - - - - - - - - - - - - - kg/ ha Conventional Till Sample 1 17.6 49.1 4.0 9.6 39.7 12.1 63.1 Sample 2 18.9 57.9 4.0 9.4 37.7 11.3 72.3 Sample 3 12.9 37.5 5.0 11.6 36.0 11.8 40.9 Sample 4 21.6 68.9 4.0 16.5 41.4 15.8 80.2 Sample 5 12.2 42.0 6.0 7.4 32.4 10.0 37.2 Sample 6 17.1 54.9 5.0 9.6 36.6 10.5 65.9 Average 16.7 51.7 4.7 10.7 37.3 11.9 59.9 No-Till Sample 1 16.4 60.4 6.0 8.3 37.6 7.5 67.4 Sample 2 20.3 72.3 5.0 10.5 38.8 11.4 82.4 Sample 3 24.7 79.5 4.0 14.5 45.9 15.7 96.3 Sample 4 19.0 65.2 5.0 10.5 39.4 11.2 75.1 Sample 5 18.7 55.1 5.0 13.2 45.8 15.9 63.4 Sample 6 15.4 41.9 5.0 12.5 45.6 14.2 48.2 Average 19.1 62.4 5.0 11.6 42.2 12.7 72.1 A complete package of soil health parameters was analyzed for soil samples taken at 0-15 cm in the treatments of CT and NT on May 25th, 2022.
- 20. Conclusion: Introduction of No-Till improved soil health functions: SHS, CO2-R, SOM, Soil Wet-Aggregate Stability, Water Holding Capacity, and other soil physical and chemical properties. Improvement of soil health functions reduced the nitrate load in the NT vs CT treatment with soybean. Soil health management systems are essential to protect and enhance groundwater and surface water quality, especially nitrate (NO3-N) loss. Innovative research techniques such as Resin Nutrient Exchangers and Micro-lysimeters can help to estimate the dynamic forms of nutrients in the soil, in terms of their spatial and long-term availability, transport, and leaching. In summary, our research provided a better understanding on how healthy soil functions- through improved management practices- influence the hydrologic processes in the field and subsequent transport and reduction of nitrate (NO3-) leaching to surface water.
- 21. Contact information: Zouheir Massri zmassri@msu.edu (517) 282- 5300 Ph.D., Soil Physics Sustainable Agriculture and Soil Health BAE/IWR Michigan State University Please, find detailed information in: 22AIM ASABE Article_2200070 Questions, please The project was funded by the Michigan Department of Agricultural and Rural Development (MDARD).
Editor's Notes
- The resin data are primarily used to compare in situ N mineralization/nitrification rates and N availability between treatments – not as a way to evaluate N stocks.
- The challenge of increasing nitrate concentrations in groundwater and surface waters represents one of the most widespread and acute impacts of modern agriculture on the environment. Improper effects of agricultural activities such as conventional tillage (CT) on surface and groundwater quality have been a topic of concern in many parts of the world for several decades.